Increasing power density and dye decolorization of an X-3B-fed microbial fuel cell via TiO2 photocatalysis pretreatment†
Lin Sua,
Xianpeng Fana,
Tao Yina,
Haihua Chenb,
Xiaoxia Linad,
Chunwei Yuana and
Degang Fu*abc
aState Key Laboratory of Bioelectronics, Southeast University, Nanjing, 210096, China. E-mail: fudegang@seu.edu.cn; Tel: +86 025 83793091
bSchool of Chemistry and Chemical Engineering, Southeast University, Nanjing, 210096, China
cSuzhou Key Laboratory of Environment and Biosafety, Suzhou, 215123, China
dSchool of Material Engineering, Jinling Institute of Technology, Nanjing 211169, China
First published on 17th September 2015
Abstract
To improve the output power density of dye-fed microbial fuel cells (MFCs), which decreases with increasing dye concentration, a new strategy involving TiO2 photocatalysis pretreatment of high content dye wastewater was proposed and demonstrated in this study. 200 mg L−1 X-3B wastewater was treated using F-doped nano-TiO2 under visible light for 2.5 h and then mixed into the substrate, and the maximum output power density (PM) of MFC reached 392 mW m−2. As a comparison, PM was only 276 mW m−2 when untreated X-3B wastewater was used as the substrate. About 42% power density was retrieved from the MFC fed with high concentration X-3B wastewater via prior photocatalytic treatment. Moreover, the decolorization rate of X-3B was also enhanced from 42% to 56.5% when combined with the photocatalysis process. The increase of power density after photocatalysis of X-3B was attributed to less electron consumption by decomposed X-3B, extra electron donors and mediators from produced intermediates as well as increased bacterial diversity in the anode chamber. These results demonstrated TiO2 photocatalysis pretreatment as an effective and easy to implement technology for improving both the electricity harvest and pollutant elimination from wastewaters that contain concentrated hard-to-use biomass without specially acclimatizing or modifying MFC.
1. Introduction
Microbial fuel cells (MFCs) generate current during the anaerobic metabolism of electricigens, which can use a great variety of organics present in wastewaters and remove the discarded pollutants simultaneously.1,2 Some chemicals in the substrates are poisonous, harmful or biorefractory to the microorganisms and severely disable or weaken the performance of MFCs.3,4 For example, azo dyes are environmentally hazardous chemicals that are widely used in the textile industry. The treatment of dye containing wastewaters still presents a technical challenge as the dyes are highly stable and are resistant to microorganisms.5,6 During the past decade, MFCs have been utilized for the decolorization of dye wastewaters.7,8 It was found that the decolorization of dyes was accelerated in MFCs compared to traditional anaerobic technologies; moreover, electricity could be simultaneously generated.9 However, the MFC power density decreases with increasing dye concentration, which can be commonly attributed to the enhanced toxic effect to microbes and more electrons being competitively captured by dye molecules.10 From the point of energy harvesting, MFCs running under higher dye content will lose significant amounts of chemical energy in the fuel associated with less electricity generation. A similar problem occurred in MFCs supplied with wastewaters containing biorefractory compounds because extra energy was needed to metabolize these substrates.3,11,12Recently, researchers have mainly focused on improving MFC performance to enhance dye decolorization by novel reactor designs, anode modification, acclimation of biofilm, and coupling with other wastewater treatment technologies, although the output power density of MFCs running with dye wastewaters was still low, especially with very high dye content (Table S1†). In general, the output power of a MFC fed with easily biodegradable wastewaters could be dramatically reduced due to the import of toxic chemicals in the substrate considering the complexity of real wastewaters in practice. Thus, it is desirable to be able to promptly restore or increase power density of MFC without heavily modifying the electrode, system configuration or operating conditions, which has been less explored.13 One feasible method was the suitable pre-treatment of wastewater to make the substrates more appropriate to microorganisms such as dilution,14 using an autoclave,15 and sonication.16 For example, Mahmoud et al. tested fermentation as the pretreatment technology for recalcitrant substrates to enrich the carbohydrates that are easier for biodegradation.17 However, simply avoiding such a situation by separating toxic chemicals out from the substrates such as adsorption will cause the loss of the chemical energy stored in these compounds and also cause the possible problem of so-called secondary pollution.
Photocatalysis based on nano-TiO2 is a powerful technique that could decompose almost all organic chemicals and has been extensively studied in cleaning air and water.18 In particular, modified TiO2 with visible light catalysis activity by element doping (such as fluorine and nitrogen) or narrow band semiconductors can utilize solar energy for pollutant treatment,19,20 enabling energy-saving photocatalysis. By this technology, it is possible to disintegrate toxic or biorefractory chemicals into non-toxic and bioavailable substrates. For example, Vinodgopal reported the TiO2 photocatalytic degradation of an azo dye acid orange 7, wherein 1,2-naphthoquinone and phthalic acid were identified as the intermediates.21 The toxicity of sulfonamides was significantly lowered after TiO2 photocatalysis,22 which could be further used in biological procedures. In our previous research,23,24 progressive decoloration of azo dyes under visible light was easily achieved using a magnetically separable composite photocatalyst. Research on TiO2 photocatalysis has concentrated on how to decompose the organics thoroughly (Table S1†); however, there has been no consideration of using TiO2 photocatalysis as a pretreatment technology to increase the power density of a MFC fed with dye wastewater to date. It is not clear whether or how the output of MFC could be significantly improved when the toxic or biorefractory substrates are incompletely decomposed on purpose by TiO2 photocatalysis instead of thoroughly degraded into carbon dioxide after feeding into MFC.
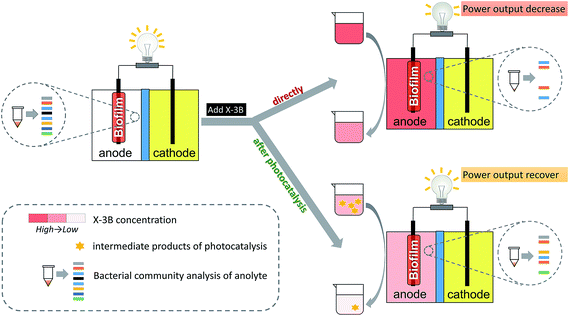
In this study, to the best of our knowledge, we demonstrate for the first time a strategy (Fig. 1) that utilizes photocatalysis pretreatment of X-3B (reactive brilliant red dye) to improve electricity production in MFC supplied with high content dye wastewater without specially acclimatizing or optimizing the cell operation, while simultaneously enhancing the dye decolorization. X-3B was chosen because it is one of the most widely used azo dyes in the textile industry and is toxic to organisms and degradation resistant in nature.25,26 The influence of untreated X-3B and pretreated X-3B on the power output of MFC is evaluated. The power recovery owing to visible light photocatalysis of X-3B prior to its use as a fuel are investigated, and the potential benefits of the method are also discussed.
2. Materials and methods
2.1. MFC set-up, operation and characterization
An “H” type MFC with two chambers was used, and the volume of each chamber, separated by a proton exchange membrane (Nafion117, DuPont), was 245 mL. Both the anode and cathode were made from carbon paper (HCP020N, Hesen, Shanghai) with a size of 4.0 × 4.0 cm, and the distance between electrodes was set at 4 cm. A copper wire was used to connect the external circuit containing a resistance of 1500 Ω. Nonconductive epoxy resin was utilized for isolating exposed metal surfaces from solutions.The sludge inoculum was obtained from the Wastewater Treatment Plant of Nanjing City and under anaerobic culture for more than 24 h. A mixture of cultured sludge and medium solution (1![[thin space (1/6-em)]](https://www.rsc.org/images/entities/char_2009.gif) :
:![[thin space (1/6-em)]](https://www.rsc.org/images/entities/char_2009.gif) 4, v/v) was used as the initial anodic inoculum. The medium solutions with pH = 7.0 contained (per liter of deionized water) NH4Cl (0.31 g), KCl (0.13 g), Na2HPO4 (11.54 g), and NaH2PO4 (2.78 g). The catholyte contained the same medium solution as well as 50 mmol L−1 potassium ferricyanide. The experimental temperature was controlled at 30 °C. During the start-up stage, only glucose (1.0 g L−1) was added as carbon sources for the growth of the anode-associated biofilm. When the cell voltage was lower than 50 mV, fresh substrates were added into the anode chamber and the cell operated in a new running cycle. The output voltage was stable and maintained for 2–3 months after about more than 10 cycles, start-up was then finished and MFC was ready for subsequent experiments.
4, v/v) was used as the initial anodic inoculum. The medium solutions with pH = 7.0 contained (per liter of deionized water) NH4Cl (0.31 g), KCl (0.13 g), Na2HPO4 (11.54 g), and NaH2PO4 (2.78 g). The catholyte contained the same medium solution as well as 50 mmol L−1 potassium ferricyanide. The experimental temperature was controlled at 30 °C. During the start-up stage, only glucose (1.0 g L−1) was added as carbon sources for the growth of the anode-associated biofilm. When the cell voltage was lower than 50 mV, fresh substrates were added into the anode chamber and the cell operated in a new running cycle. The output voltage was stable and maintained for 2–3 months after about more than 10 cycles, start-up was then finished and MFC was ready for subsequent experiments.
Voltages across the resistance in the external circuit were automatically recorded by a data acquisition system (U120816, HYTEK Automation). The output power density (mW m−2) was calculated as P = 1000U2/(RA), where A is the projected surface area of the anode (m2), U is the voltage (V), and R is the resistance (Ω) used in the external circuit. The power density curve of MFC was measured by the replacement of the external resistance.27 The effects of three types of substrates were evaluated. Glu-XM-0 was pure glucose (400 mg L−1) used as the blank control. Glu-XPM-200 was a mixture of TiO2 pretreated X-3B (200 mg L−1) with glucose (400 mg L−1), which was used to analyze the ability of photocatalysis to power recovery, and Glu-XM-Y was a mixture of glucose (400 mg L−1) with untreated X-3B (Y mg L−1) for the purpose of comparison. Before renewal of the substrate for a new run, MFC was cultivated with a medium containing 1.0 g L−1 glucose to ensure the cell could display the original state if necessary.
The electrochemical experiments were conducted by the CHI760D systems (Shanghai CH Instrument Co., Ltd) using a three electrode system with an anode as the working electrode and a cathode as the counter electrode. All the potentials were recorded against a saturated calomel electrode (SCE). The cyclic voltammogram (CV) was measured at a scan rate of 10 mV s−1.
2.2. Photocatalytic pretreatment of X-3B
The fluorine (F) doped nano-TiO2 composite with active magnetic carbon granules (ACG), i.e., F-TiO2/magnetite/ACG, was synthesized according to our previous study (see ESI†). The photocatalytic system used in the experiment consists of a glass beaker (1000 mL capacity) covered with a aluminized paper, and a light source (MVL-210, 290 W, MEJIRO GENOSSEN) at the upper surface of the reactor. The photocatalytic degradation experiment was performed with the following procedure: composite catalyst powder (final concentration of 1.5 g L−1) was mixed with X-3B dye (200 mg L−1) in the dark for 30 min to reach adsorption–desorption equilibrium, then the reactor was irradiated with visible light under continuous stirring. During the photocatalysis, samples were collected at a time interval of every 30 min. A UV-visible spectrophotometer (Shimadzu Corporation) was used for absorbance measurements of X-3B at the wavelength of 535.5 nm24 and a LC-MS (1260-6224, Agilent Technologies) instrument was used to analyze the products in the solution after degradation.2.3. Bacterial community and phylogenetic analysis
Along with MFC evaluation, the samples containing different substrates, i.e., Glu-XPM-200, Glu-XM-200 and Glu-XM-0, were taken from the anode chamber of MFC at the midpoint of a running cycle for DGGE (denaturing gradient gel electrophoresis) analysis, using a DCode universal mutation detection system (Bio-Rad Laboratories, United States). The biofilm sample that was carefully scraped from the anode surface of MFC was also used for DGGE analysis. DNA was extracted using the FastDNA extraction kit (2 mL spin, MP Bio medicals) and stored at −20 °C until further analysis.Extracted DNA was amplified via PCR with an annealing temperature of 56.5 °C to obtain fragments with lengths around 200 base pairs. Bacterial primers used were F341 (5′-CCTAC GGGAG GCAGC AG-3′) and R518 (5′-ATTAC CGCGG CTGCT GG-3′).28,29 An additional G–C clip (5′-CGCCC GCCGC GCGCG GCGGG CGGGG CGGGG GCCCG GGGGC-3′) was added before F341 to enhance the DGGE resolution. All samples were stored at 4 °C until use. The denatured gradient in the DGGE gel ranged from 30% to 60%, where 100% denaturation corresponds to 40% (v/v) formamide and 7 M urea. Target gel bands were extracted and purified using the Poly-Gel DNA Extraction Kit (Omega) and then sent for cloning and sequencing (BGI, China). Sequencing results were uploaded to the EMBL (European Molecular Biology Laboratory) Nucleotide Sequence Database with the accession no. from LM655401 to LM655406.
3. Results and discussion
3.1. Effect of glucose on the performance of MFC
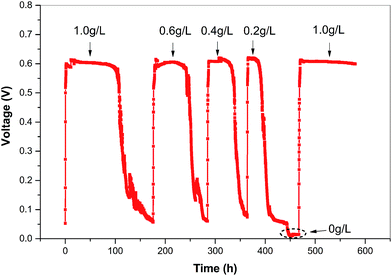
Glucose is commonly used as a co-substrate for bio-decolorization of azo dyes.10,30 After MFC was successfully started, the voltage output of MFC as a function of glucose content was examined. As shown in Fig. 2, when the substrate contained 100 mg L−1 X-3B and the glucose concentration varied from 1 g L−1 to 0.2 g L−1, the output voltage for each substrate replacing-running cycle was near constant, while the time period of a cycle decreased with reduced glucose concentration. As the resistor with the same resistance value was linked in external circuit, the similar voltage output regardless of varied glucose concentration meant that the electrochemically active biofilm on the anode of MFC has been well developed. The diverse microorganisms enriched during the start-up of the MFC ensure the solid stability of the biofilm, as observed from other sludge inoculated microbial consortia.31 The voltage dropped at the end of each cycle when all glucose had been expended, but the output could be quickly restored once a fresh substrate was supplied.In MFC, glucose was the sole carbon source in the anode chamber; therefore, the activity of the microbes, including electricigens, would sharply decline as glucose was used up. With less glucose, depletion occurred faster, resulting in a shorter duration of current production (Fig. 2). In contrast to the running period, the coulombic efficiency decreased with increasing glucose concentration (Fig. S1†). In this study, we set the glucose concentration in the substrate as 400 mg L−1 for subsequent assessment experiments. It should be noted that only X-3B without glucose in the substrate could not support the operation of MFC (indicated as the circle in Fig. 2). However, the output of MFC could be rapidly restored after re-addition of 1.0 g L−1 glucose, which further confirmed that the adapted anodophilic consortia was stable enough to suffer from the variation of the substrate.
3.2. Influence of X-3B concentration on MFC performance
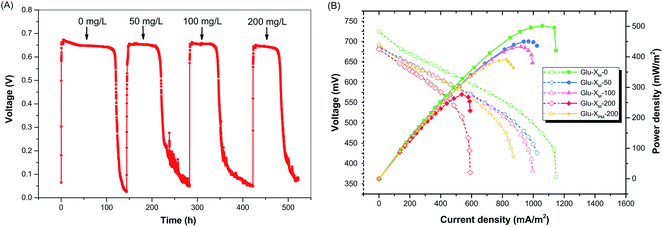
Once the glucose concentration was fixed at 400 mg L−1 in the substrate, the Glu-XM-Y substrate was used to explore the influence of X-3B on MFC performance, where Y represents the X-3B concentration in mg L−1 in the substrate. In particular, Glu-XM-0 was the pure glucose substrate without X-3B and used as the blank control. Fig. 3a shows that the voltage at each cycle was maintained at around 650 mV despite the concentration of X-3B. This indicated that the biofilm on the anode remained stable and presented a higher tolerance to the gradual increasing of X-3B.32 However, the running period obviously decreased once 50 mg L−1 X-3B was added into substrate, while the open circuit voltage (OCV) and maximum power density were also reduced (Fig. 3b). These facts undoubtedly reveal the negative effect of X-3B on electricity generation in accordance with previous reports.8,33,34 The accompanied decrease of OCV with the addition of X-3B implied significant energy was consumed in intracellular metabolism.11 As X-3B reached higher concentrations, considerable deterioration of the power output occurred, as seen in Fig. 3b. The maximum power density of MFC in the blank control experiment using substrate Glu-XM-0 was 502 mW m−2. It was 450 and 433 mW m−2 using Glu-XM-50 and Glu-XM-100 substrates, respectively, with 10.3% or 13.7% power density lost relative to the blank control. However, using the Glu-XM-200 substrate, the maximum power density dropped to 276 mW m−2 and was only 55% that of the blank control, corresponding to a 45% loss of the power density. The current density of the MFC fed with Glu-XM-200 began to drop quickly upon reaching about 0.5 A cm−2, due to the significant increase in mass transfer resistance at higher current density. Although the rate of decrease in duration reduced as the X-3B concentration increased from 50 mg L−1 to 100 mg L−1 and then 200 mg L−1, reflecting the adaptive capacity of the biofilm to environmental stress, the maximum power density and current density dramatically decreased when the X-3B concentration was 200 mg L−1. To utilize the biomass energy more efficiently, pretreating 200 mg L−1 X-3B by TiO2 photocatalysis to fragment X-3B was considered for the purpose of power recovery, instead of diluting X-3B solution. It is expected that after fragmentation by TiO2 photocatalysis, these substrates could not only be more easily utilized by microorganisms, but also retain the available chemical energy in an organic fuel as much as possible.3.3. Power recovery by photocatalysis pretreatment
The 200 mg L−1 X-3B solution was treated under visible light for 2.5 h using the as prepared photocatalyst. Then, the catalyst was separated and the solution was mixed with glucose as the substrate (Glu-XPM-200) for operation of MFC. The voltage and the duration of MFC using Glu-XPM-200 were similar to those using Glu-XM-200 (Fig. S2†), as well as using Glu-XM-100 (Fig. 3a). However, an obvious current increase could be found from the cyclic voltammogram of the anode biofilm in Glu-XPM-200 (Fig. 4). The CV exhibited an anodic catalytic wave with typical sigmoidal shape normally found in electrochemistry of electricity-generating biofilms. While the cathodic peak current showed a small increase, the absolute anodic peak current changed from 3.27 mA in Glu-XM-200 to 4.21 mA in Glu-XPM-200 with about a 28.7% increase. The higher anodic current means more electrons can transfer to external circuit from the Glu-XPM-200 substrate and thus one can expect higher power output for MFC. The oxidation and reduction potentials of the anode biofilm in Glu-XPM-200 (−0.333 and −0.541 V) and in Glu-XM-200 (−0.325 and −0.546 V) were almost the same and are close to the CV peak positions of electricigens reported in the literature,35,36 suggesting the EET pathways of anode biofilm in two substrates (Glu-XPM-200 and Glu-XM-200) were almost unchanged.37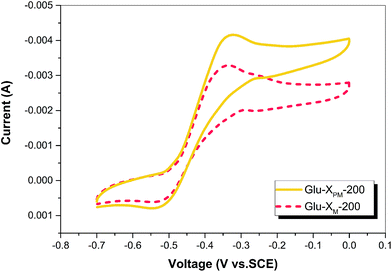 | ||
| Fig. 4 CV spectra of the anode biofilm in different substrates. The anodic peak current increased in Glu-XPM-200, while the peak position was nearly the same in both cases. | ||
In agreement with the CV observation, the maximum power density of MFC using substrate Glu-XPM-200 was 392 mW m−2, equal to about 78.1% of the blank control, as shown in Fig. 3b. Compared with using Glu-XM-200, about 23% power density of the control was restored and 42% power density was increased when X-3B was treated by TiO2 photocatalysis ahead of its addition into MFC. With the same strategy, much more power density (about 64.4%) could be recovered in a single strain inoculated MFC (Fig. S3†), which further demonstrates the effectiveness of the method. With respect to power recovery, the photocatalytic pretreatment to decompose X-3B into fragments could bring some advantages that contribute to the enhancement of MFC performance. First, fewer electrons were used to reduce the azo linkages as the concentration of X-3B was decreased by photocatalysis. In contrast, X-3B in Glu-XM-200 consumed more electrons released from glucose by bacteria metabolism and fewer electrons were used for current output. Second, after photocatalytic pretreatment of X-3B, the concentration of possible toxic chemicals in the substrate was decreased, which induced less environmental stress to the microbial communities in the anolyte. As a result, more microorganisms could survive in the anode chamber, especially those microbes sensitive to X-3B. Third, photocatalysis produced some intermediate compounds that became usable directly for bacterial consortia (Fig. S4† and 5) and served as supplementary electron donors such as aliphatic acids38,39 or perhaps as mediators similar to quinones facilitating electron transfer from bacteria to the anode.40,41 Due to abovementioned positive effects caused by photocatalytic pretreatment, the bioavailability of the X-3B containing substrate was increased and therefore the power output of MFC using Glu-XPM-200 was improved.
3.4. Degradation of X-3B
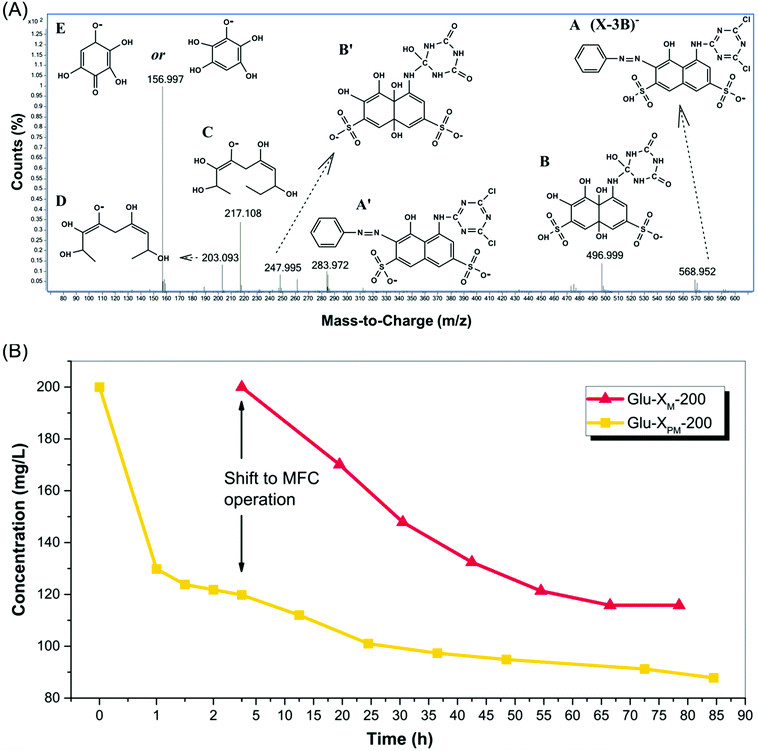
According to a previous research, the degradation of X-3B during TiO2 photocatalysis involved the formation of intermediates such as aniline-like and naphthalene-like compounds as well as triazene-like compounds (Fig. S4†). The naphthalene ring could transform to benzene-like compounds as well as other benzoic acid derivatives, and aniline-like compounds could be oxidized as phenol and quinones, while benzoic acid derivatives could further turn into aliphatic acids. Some released byproducts, such as aliphatic acids (C, D) and polyphenol (E) in X-3B solution after 2.5 h photocatalytic pretreatment, could be identified from LS-MS, as shown in Fig. 5a. The result followed the general degradation mechanism of X-3B and validated our inference that deliberate photocatalysis could disintegrate X-3B into fragments as extra electron donors available to microbes. The concentration of X-3B decreased from 200 mg L−1 at the beginning to 120 mg L−1, corresponding to 40% degradation of total X-3B in photocatalytic process (Fig. 5b). X-3B was further decomposed in Glu-XPM-200 during MFC running and lowered to about 91 mg L−1 after 70 h operation or 87 mg L−1 after a whole running, i.e., 82 h, which means 24% or 27.5% additional degradation in MFC. The overall degradation efficiency of X-3B in Glu-XPM-200 was 54.5% or 56.5% upon combining 2.5 h photocatalysis and 70 h or 82 h MFC handling. As a comparison, the final concentration in Glu-XM-200 after a whole MFC operation, i.e., 76 h running, was 116 mg L−1, corresponding to a total 42% degradation (Fig. 5b). Therefore, the percent degradation of X-3B in Glu-XPM-200 was higher than in Glu-XM-200. This result further demonstrated the advantage of photocatalytic pretreatment of X-3B. It was not only helpful for electricity generation, but also beneficial for the degradation of the dye.On considering the degradation of X-3B in MFC, the percent degradation was higher in Glu-XM-200 than in Glu-XPM-200. This was consistent with the suggestion that fewer released electrons were consumed by X-3B in Glu-XPM-200. Another observation in Fig. 5b was that the degradation curve of Glu-XM-200 reaches a plateau at the end stage of MFC operation due to exhaustion of glucose, but there was still a slow X-3B degradation in Glu-XPM-200 even at the end of operation. This reflects in some way the fact that besides glucose, some intermediate compounds (Fig. 5a) produced during the photocatalytic process could be the carbon source in Glu-XPM-200 to provide additional electrons and support the degradation of X-3B in MFC.
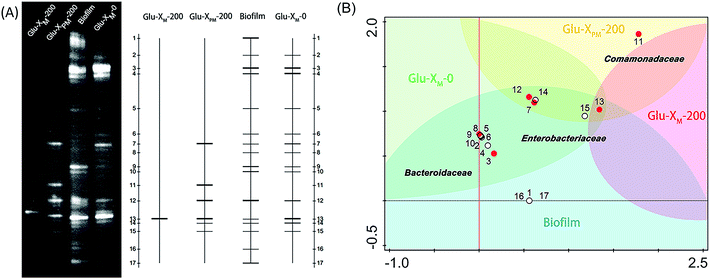
3.5. Community analysis
Analysis using DGGE was able to profile the diversity of the microbial community. The different cDNA fragments shown as separate bands in the DGGE gel-image visually exhibited the diversity of bacterial consortia (Fig. 6a). The anode-associated biofilm of MFC contained the most abundant microbial species, as expected. According to previous studies, rich and diverse sources of bacteria are helpful in producing high power densities42,43 owing to syntrophic microbial interactions and/or synergistic bacterial communication. For example, mediators produced by one germ in a biofilm or in an anolyte could be used by other species as electron shuttles.44 The biofilm maintained a high biodiversity, thus supporting its outstanding stability as previously discussed. While the microbial populations in anolytes with different X-3B content were assessed and compared in Fig. 6a, a significant and successive decrease of the microbial species was clearly observed in Glu-XM-0, Glu-XPM-200 and Glu-XM-200. There was less diversity of microbial communities in Glu-XPM-200 and Glu-XM-200 than in Glu-XM-0, reflecting the toxicity of azo dyes. However, after photocatalytic pretreatment of X-3B, more microbes (band 7, 11, 12) survived in Glu-XPM-200 than in Glu-XM-200. The result of the electrophoretogram was in agreement with the observed MFC output discussed above.To understand the role of microorganisms in the anolyte, the main bands in the DGGE gels (band 3, 7, 9, 11, 12 and 13) were excised, sequenced, and then the phylogenetic analysis was performed based on the 16S clone library (Fig. S5†), which indicated that most of them belonged to Enterobacteriaceae (band 7, 12, and 13), Bacteroidaceae (band 3 and 9) and Comamonadaceae (band 11). More detailed detrended correspondence analysis (DCA) combining sequencing results with the bands information is shown in Fig. 6b. The biofilm included almost all the species except Comamonadaceae (band 11), which was only enriched in Glu-XPM-200. It is known that this strain has tolerance to benzene compounds (photocatalysis products of X-3B).45 Therefore, after photocatalytic treatment of X-3B, bacteria readily appeared and was abundant in Glu-XPM-200, and may play a role in the degradation of aromatic compounds. In contrast, in Glu-XM-200, X-3B killed almost all the bacteria apart from one strain (band 13) belonging to Enterobacteriaceae, which is usually found in environments containing azo dyes.46 However, all Enterobacteriaceae species (band 7, 12, and 13) were found in the anolyte containing Glu-XM-0 or Glu-XPM-200, as well as in the biofilm. High quantities of the Enterobacteriaceae species explained the stability and tolerance of the biofilm to X-3B as well as the notable power recovery of MFC using Glu-XPM-200 relative to using Glu-XM-200, and again demonstrated the role of pre-treatment of X-3B. The bacteria from Bacteroidaceae (band 3 and band 9) shown in the lower left region were found in the biofilm and in the anolyte containing only pure glucose (Glu-XM-0). Previous studies47,48 proved that some of the Bacteroidaceae bacteria are members of electricigens, so these species may be responsible for the current generation. It is noted that these species were not seen in the anolyte containing Glu-XPM-200 or Glu-XM-200, which means that they are very sensitive to X-3B.
4. Conclusions
As a promising technology, MFCs are highly desired for producing electricity and simultaneously removing various discarded pollutants such as high concentration dyes in wastewaters very effectively. As a demonstration, we showed that 200 mg L−1 X-3B in substrate dramatically reduced the power density (about 45% of the control) and current density of MFC, but the power density was significantly restored (23% of the control) when X-3B was pre-treated by TiO2 photocatalysis under visible light for 2.5 h with synchronous enhancement of X-3B elimination. It was found that the decrease of consumed electrons by X-3B, the increase of strains survived in anode chamber, and extra electron donors from degradation intermediates by photocatalysis were beneficial to the performance recovery of MFC. It should be mentioned that MFC used in this study was not specially acclimatized to X-3B. In principal, the strategy used in this study should be applicable to wastewaters containing other types of biorefractory compounds in higher concentrations.Real wastewaters are very complex and contain poisonous and recalcitrant compounds with changeable contents. The results in this study demonstrate the potent ability of TiO2 photocatalysis on decomposing hard-to-use biomass into bioavailable fragments, while keeping transformable chemical energy in these substrates as soon as possible for energy harvesting. Compared to the fermentation process, the technique is applicable to almost all substrates, while the former does not work well with toxic compounds or indigestible organics. It should be noted that this photocatalytic pretreatment of high content dye wastewater is feasible in practice (Fig. 5b and S7†), as the chemical is not needed to degrade totally, which is difficult at present for TiO2 photocatalysis (Table S1†). While incompletely degraded, the as prepared magnetic separable photocatalyst can be easily isolated from the product (Fig. S6†), which is convenient to arrange the pretreatment process with MFC operation. More importantly, not only can the lost energy be recovered from MFC unoptimized to harmful substrates by performing so designed photocatalysis prior to feeding the substrate, but also such a pre-treatment process could easily be implemented using solar energy in an energy-saving manner (Fig. S7†). These advantages confer the technology as a green and cost-effective pretreatment approach to retrieve electric energy from poisonous or indigestible wastewaters by MFC in high quantities.
Acknowledgements
This study was supported by the National Natural Science Foundation of China (No. 51172043) and the State Key Laboratory of Bioelectronics, Southeast University.References
- W. Li, H. Yu and Z. He, Energy Environ. Sci., 2014, 7, 911–924 CAS.
- D. Pant, G. van Bogaert, L. Diels and K. Vanbroekhoven, Bioresour. Technol., 2010, 101, 1533–1543 CrossRef CAS PubMed.
- Y. Luo, R. Zhang, G. Liu, J. Li, M. Li and C. Zhang, J. Hazard. Mater., 2010, 176, 759–764 CrossRef CAS PubMed.
- T. Catal, Y. Fan, K. Li, H. Bermek and H. Liu, J. Power Sources, 2008, 180, 162–166 CrossRef CAS PubMed.
- M. A. Brown and S. C. de Vito, Crit. Rev. Environ. Sci. Technol., 1993, 23, 249–324 CrossRef CAS PubMed.
- C. Wang, A. Yediler, D. Lienert, Z. Wang and A. Kettrup, Chemosphere, 2002, 46, 339–344 CrossRef CAS.
- S. Kalathil, J. Lee and M. H. Cho, Bioresour. Technol., 2012, 119, 22–27 CrossRef CAS PubMed.
- K. Solanki, S. Subramanian and S. Basu, Bioresour. Technol., 2013, 131, 564–571 CrossRef CAS PubMed.
- B. Chen, M. Zhang, C. Chang, Y. Ding, K. Lin, C. Chiou, C. Hsueh and H. Xu, Bioresour. Technol., 2010, 101, 4737–4741 CrossRef CAS PubMed.
- J. Sun, Y. Hu, Z. Bi and Y. Cao, Bioresour. Technol., 2009, 100, 3185–3192 CrossRef CAS PubMed.
- U. Schröder, Phys. Chem. Chem. Phys., 2007, 9, 2619–2629 RSC.
- J. Yu, J. Seon, Y. Park, S. Cho and T. Lee, Bioresour. Technol., 2012, 117, 172–179 CrossRef CAS PubMed.
- H. Cheng, B. Liang, Y. Mu, M. Cui, K. Li, W. Wu and A. Wang, Water Res., 2015, 81, 72–83 CrossRef CAS PubMed.
- B. Min, J. Kim, S. Oh, J. M. Regan and B. E. Logan, Water Res., 2005, 39, 4961–4968 CrossRef CAS PubMed.
- S. Oh, J. Y. Yoon, A. Gurung and D. Kim, Bioresour. Technol., 2014, 165, 21–26 CrossRef CAS PubMed.
- T. T. More and M. M. Ghangrekar, Bioresour. Technol., 2010, 101, 562–567 CrossRef CAS PubMed.
- M. Mahmoud, P. Parameswaran, C. I. Torres and B. E. Rittmann, Bioresour. Technol., 2014, 151, 151–158 CrossRef CAS PubMed.
- K. Hashimoto, H. Irie and A. Fujishima, Jpn. J. Appl. Phys., 2005, 44, 8269 CrossRef CAS.
- S. H. S. Chan, T. Yeong Wu, J. C. Juan and C. Y. Teh, J. Chem. Technol. Biotechnol., 2011, 86, 1130–1158 CrossRef CAS PubMed.
- D. Robert and S. Malato, Sci. Total Environ., 2002, 291, 85–97 CrossRef CAS.
- K. Vinodgopal, D. E. Wynkoop and P. V. Kamat, Environ. Sci. Technol., 1996, 30, 1660 CrossRef CAS.
- W. Baran, J. Sochacka and W. Wardas, Chemosphere, 2006, 65, 1295–1299 CrossRef CAS PubMed.
- Y. Ao, J. Xu, D. Fu and C. Yuan, J. Alloys Compd., 2009, 471, 33–38 CrossRef CAS PubMed.
- J. Xu, Y. Ao, D. Fu and C. Yuan, Appl. Surf. Sci., 2008, 254, 3033–3038 CrossRef CAS PubMed.
- Y. Cheng and Q. Zhou, J. Environ. Sci., 2002, 14, 136–140 CAS.
- J. W. Daly, D. M. Jerina and B. Witkop, Experientia, 1972, 28, 1129–1149 CrossRef CAS.
- F. Zhao, R. C. T. Slade and J. R. Varcoe, Chem. Soc. Rev., 2009, 38, 1926 RSC.
- M. D. Yates, P. D. Kiely, D. F. Call, H. Rismani-Yazdi, K. Bibby, J. Peccia, J. M. Regan and B. E. Logan, ISME J., 2012, 6, 2002–2013 CrossRef CAS PubMed.
- N. T. Phung, J. Lee, K. H. Kang, I. S. Chang, G. M. Gadd and B. H. Kim, FEMS Microbiol. Lett., 2004, 233, 77–82 CrossRef CAS PubMed.
- J. Sun, Y. Li, Y. Hu, B. Hou, Y. Zhang and S. Li, Appl. Microbiol. Biotechnol., 2013, 97, 3711–3719 CrossRef CAS PubMed.
- J. R. Kim, B. Min and B. E. Logan, Appl. Microbiol. Biotechnol., 2005, 68, 23–30 CrossRef CAS PubMed.
- S. Ishii, S. Suzuki, T. M. Norden-Krichmar, K. H. Nealson, Y. Sekiguchi, Y. A. Gorby and O. Bretschger, PLoS One, 2012, 7, e30495 CAS.
- A. Pandey, P. Singh and L. Iyengar, Int. Biodeterior. Biodegrad., 2007, 59, 73–84 CrossRef CAS PubMed.
- A. B. Dos Santos, F. J. Cervantes and J. B. van Lier, Bioresour. Technol., 2007, 98, 2369–2385 CrossRef CAS PubMed.
- H. Richter, K. P. Nevin, H. Jia, D. A. Lowy, D. R. Lovley and L. M. Tender, Energy Environ. Sci., 2009, 2, 506 CAS.
- S. Srikanth, E. Marsili, M. C. Flickinger and D. R. Bond, Biotechnol. Bioeng., 2008, 99, 1065–1073 CrossRef CAS PubMed.
- A. A. Carmona-Martinez, F. Harnisch, L. A. Fitzgerald, J. C. Biffinger, B. R. Ringeisen and U. Schröder, Bioelectrochemistry, 2011, 81, 74–80 CrossRef CAS PubMed.
- Z. He, N. Wagner, S. D. Minteer and L. T. Angenent, Environ. Sci. Technol., 2006, 40, 5212–5217 CrossRef CAS.
- H. Luo, G. Liu, R. Zhang and S. Jin, Chem. Eng. J., 2009, 147, 259–264 CrossRef CAS PubMed.
- F. P. van der Zee and F. J. Cervantes, Biotechnol. Adv., 2009, 27, 256–277 CrossRef CAS PubMed.
- K. Watanabe, M. Manefield, M. Lee and A. Kouzuma, Curr. Opin. Biotechnol., 2009, 20, 633–641 CrossRef CAS PubMed.
- B. E. Logan, Nat. Rev. Microbiol., 2009, 7, 375–381 CrossRef CAS PubMed.
- K. Rabaey and W. Verstraete, Trends Biotechnol., 2005, 23, 291–298 CrossRef CAS PubMed.
- D. R. Bond and D. R. Lovley, Appl. Environ. Microbiol., 2003, 69, 1548–1555 CrossRef CAS.
- S. A. B. Weelink, N. C. G. Tan, H. Ten Broeke, C. van den Kieboom, W. van Doesburg, A. A. M. Langenhoff, J. Gerritse, H. Junca and A. J. M. Stams, Appl. Environ. Microbiol., 2008, 74, 6672–6681 CrossRef CAS PubMed.
- Y. Su, Y. Zhang, J. Wang, J. Zhou, X. Lu and H. Lu, Bioresour. Technol., 2009, 100, 2982–2987 CrossRef CAS PubMed.
- Y. Zhang, B. Min, L. Huang and I. Angelidaki, Bioresour. Technol., 2011, 102, 1166–1173 CrossRef CAS PubMed.
- H. Rismani-Yazdi, S. M. Carver, A. D. Christy, Z. Yu, K. Bibby, J. Peccia and O. H. Tuovinen, Bioresour. Technol., 2013, 129, 281–288 CrossRef CAS PubMed.
Footnote |
| † Electronic supplementary information (ESI) available. See DOI: 10.1039/c5ra16043j |
| This journal is © The Royal Society of Chemistry 2015 |

