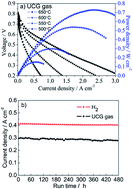
A high performance ceria-based solid oxide fuel cell operating on underground coal gasification gas

Jie Xiong *a, Chengran Jiao b, Minfang Han c, Wentao Yi a, Jie Ma a and Chunyan Yan a
aCollege of Chemistry, Chemical Engineering and Material Science, Zaozhuang University, Zaozhuang 277160, Shandong, China. E-mail: cumtbxiongjie@163.com; Fax: +86 632 3786735; Tel: +86 632 3786735
bSchool of Mechanical and Electronic Engineering, Zaozhuang University, Zaozhuang 277160, Shandong, China
cDepartment of Thermal Engineering, Tsinghua University, Beijing 100084, China

Received 9th August 2015 , Accepted 2nd October 2015

First published on 2nd October 2015


Abstract

This paper investigates the equilibrium species and theoretical electromotive forces (EMF) of cells fed with 3% H2O humidified simulated underground coal gasification (UCG) gas, and the performance of an anode-supported NiO-Gd0.1Ce0.9O2−δ (GDC)‖GDC‖Ba0.9Co0.7Fe0.2Nb0.1O3−δ (B0.9CFN) cell operated with the UCG gas. The results show that EMF values are always above 1.05 V, and the UCG gas fed cell exhibits maximum power densities of 0.151, 0.299, 0.537 and 0.729 W cm−2 at 500, 550, 600 and 650 °C, respectively, slightly inferior to that of hydrogen fed cell of 0.330, 0.544, 0.765 and 0.936 W cm−2, respectively, as a result of the sluggish reaction kinetics of the UCG gas at the anode. However, the synergy between slow anode reaction kinetics and the sufficient and fast migration of oxygen ions to the anode, attributed to the using of GDC electrolyte and B0.9CFN cathode, suppresses carbon deposition at intermediate temperatures. Only a slight current density decrease ranging from 0.2959 to 0.2790 A cm−2 is observed during the 480 h of durability testing under a constant 0.7 V output voltage at 600 °C for the UCG gas fed cell. The subsequent SEM inspection of the tested cell indicated no measurable carbon deposition on the anode surface, thereby demonstrating that UCG gas is a promising fuel for utilization in SOFCs.

1. Introduction

A number of investigations have been carried out on hydrocarbon-fuelled solid oxide fuel cells (SOFCs) because hydrocarbon fuels are readily available and cost effective.1–5 However, nearly all SOFC systems designed for operation with hydrocarbon fuels these days have to convert hydrocarbons into a mixture of hydrogen and carbon monoxide by steam reforming to avoid the cracking of hydrocarbons and deposition of carbon at the anode. An S/C (the molar ratio of steam to carbon) of greater than 2 is usually used to prevent the deposition of carbon, which results in decreases in the cell voltage and system efficiency and possible degradation of the anode due to Ni oxidation under conditions of high fuel depletion.2,6,7 Therefore, the development of direct hydrocarbon-fuelled SOFCs without a complex fuel processing system, i.e. an external reformer, is important to SOFC research.

Recently, some successful operations of SOFCs running directly on various hydrocarbons (e.g., natural gas, methanol, gasoline, diesel, octane, etc.) have been reported,1,2,8–10 and these studies employed either Ru-, Pt- or Cu-based cermets or perovskite oxides as the anodes to resist carbon deposition. Although these approaches are promising, the electrical conductivity and electro-catalytic activity for Cu-based cermets and perovskite oxides are a concern.11–14 Besides, noble metals such as Pt, Pd and Ru are too expensive to be used in large-scale commercial applications.

As previously reported, Ni is a good catalyst for hydrocarbon cracking reactions,14–17 thereby Ni-based cermets could be a desirable alternative for hydrocarbon internal reforming reactions as long as the cracking carbon particles can be oxidized by O2− immediately. For example, Koh et al.18 found that SOFCs running on 3 vol% H2O humidified methane could operate without carbon deposition at 750 °C, when the cell current density was higher than 100 mA cm−2, by employing a Ni–YSZ anode. However, carbon deposition was favored dynamically when the cell ran at a lower current density. Thus, it is evident that high current density allows a sufficient O2− supply to combine with the hydrocarbons and thereby successfully avoids carbon deposition. So in that sense, it will be better to substitute gadolinia-doped ceria (GDC) for YSZ because the ionic conductivity of GDC has been reported as 1.01 × 10⁻² to 2.53 × 10⁻² S cm−1 at 600 °C, which is two orders of magnitude higher than that of the YSZ electrolyte (approximately 10−4 S cm−1) at the same temperature.19,20 Thus GDC can provide a much higher oxygen ion conductivity for the anodes and enhance the oxidation rate of cracking carbon. Another advantage of GDC is that the doped-ceria material has the ability for continuous carbon cleaning due to its oxygen storage/release capacity.15,21

So far, the influence of various hydrocarbons on the performance and durability of SOFCs has been reported and the results are available in the literature. Nevertheless, the study of SOFCs fed with underground coal gasification (UCG) gas, a widely used hydrocarbon in China, Australia and India, is rarely reported.22,23 UCG is a clean coal technology with in situ gasification which largely eliminates the problems of mining and ash disposal while offering the possibility of economical exploitation of low rank coal, which offers an attractive option of utilizing unmineable coal.22–24 In addition, SOFCs can convert the chemical energy in the fuel directly to electricity with fuel flexibility, high efficiency, and low emissions of greenhouse gas such as CO2 and environmental pollutants like NOx.25–27 If researchers could couple UCG with an SOFC to generate electrical power directly, it would be both environmentally friendly and a high efficiency power-generating approach. The aim of this work is to demonstrate the possibilities, both in theory and practice, of the operation on UCG gas fuels using a state-of-the-art solid oxide fuel cell with a Ni/GDC cermet anode and a newly developed A-site deficient Ba0.9Co0.7Fe0.2Nb0.1O3−δ cathode.

2. Experimental section

A SOFC is essentially an oxygen concentration cell where an electromotive force (EMF) is produced due to the electrochemical potential gradient of oxygen between the anode and the cathode of the cell. The EMF for a SOFC can be described by the following Nernst eqn (1), given that the electrolyte is a pure ionic conductor:28
 
image file: c5ra15980f-t1.tif(1)
where R is the gas constant, T is the absolute temperature, F is the Faraday constant, and PO2 and PO2 are the oxygen partial pressures at the cathode and the anode, respectively.

The cathode is exposed to ambient air in a fuel cell, so PO2 is equal to 0.21 atmospheric pressure. While PO2, the oxygen partial pressure in the fuel, is determined thermodynamically. The equilibrium composition of a fuel mixture is calculated by means of the Gibbs free energy minimization method.29 The EMFs for SOFCs running on 3% H2O-humidified H2 or simulated underground coal gasification (UCG) gas were calculated according to eqn (1).

To prepare the anode, Gd0.1Ce0.9O2−δ (GDC) and NiO powders, in a weight ratio of 1[thin space (1/6-em)]:[thin space (1/6-em)]1, were mixed thoroughly, followed by additions of ethanol and butanone solvents, polyvinyl butyral binder, dibutyl phthalate plasticizer, castor oil dispersant and graphite pore former in appropriate proportions. After ball milling for 24 h, the slurry was tape cast. Green tapes, approximately 0.5 mm thick were obtained, and then pellets with a diameter of 20 mm were punched from these tapes. After burning out the binder at 1000 °C in air for 2 h, disks of the porous NiO/GDC anode substrate were obtained. An electrolyte suspension comprised of GDC, ethylcellulose and terpineol was ball milled for 24 h, and then this electrolyte slurry was coated on the presintered anode substrate. Subsequently, the pellets consisting of the anode substrate coated with the GDC electrolyte slurry were co-fired at 1350 °C for 5 h in air to produce the anode-supported half-cell. Then the A-site deficient Ba0.9Co0.7Fe0.2Nb0.1O3−δ (B0.9CFN) cathode paste was screen printed on the other surface of the GDC electrolyte, as reported in a previous study,30 followed by sintering at 1000 °C for 2 h to get single cells; the effective area of the cathode was 0.28 cm2.

The final anode-supported NiO-GDC‖GDC‖B0.9CFN fuel cell was then sealed on an alumina tube with a ceramic sealant (CERAMABOND 552, USA). After sealing, cell performances, including IV characterizations and long term stability, were evaluated with an Arbin multi-channel instrument (BT2000, USA) at various temperatures (500–650 °C) in H2 and simulated UCG gas with 3 vol% H2O at a flow rate of 80 mL min−1 on the anode side and stationary air on the cathode side. The electrochemical impedance of the cells was investigated under open circuit conditions using an electrochemical workstation (IM6, ZAHNER, Germany) in the frequency range of 0.01 Hz to 4 MHz with 10 mV as the excitation ac amplitude. The microstructures of the single cell before testing and the Ni/GDC anode after the cell performance stability test were observed by a field emission scanning electron microscope (JSM-7800F, JEOL, Japan) with an energy dispersive X-ray detector (X-Max, Oxford, England).

3. Results and discussion

The composition of the simulated UCG gas is listed in Table 1.
Table 1 The composition of simulated UCG gas at room temperature
Constituents H2 CO CH4
Volumetric percentages (%) 66 19 15


The equilibrium concentrations of chemical species in the cell fed with 3% H2O humidified simulated UCG gas are presented as a function of the temperature, between 400 and 900 °C, in Fig. 1, assuming that the various chemical species reach complete thermodynamic equilibrium. The molar fraction labeled in the figure is the concentration of the chemical species in the total equilibrium products, including solid graphite C(s). The derived equilibrium products, as shown in Fig. 1, indicate that no graphite thermodynamically forms below 450 °C, the graphite deposition above 450 °C progressively intensifies with increasing temperature, and the concentration of decomposed carbon at all temperatures is less than ten percent. The amounts of H2 and CO increase steadily with increasing temperature, while CH4 and H2O follow a reverse pattern. The CO2 and H2O species will be helpful in inhibiting carbon deposition at the anode via CO2 reforming and steam reforming.


image file: c5ra15980f-f1.tif
Fig. 1 Calculated equilibrium product distribution as a function of temperature for 3% H2O humidified simulated UCG gas.

Fig. 2 shows the temperature dependence of the equilibrium oxygen partial pressures at the anode and the calculated EMF of a SOFC running on humidified H2 and simulated UCG gas. The oxygen partial pressure at anode in the simulated UCG gas increases with temperature from 10−30 kPa at 400 °C to 10−19 kPa at 900 °C, which is higher than that in the equilibrium system of hydrogen below 770 °C, and lower than that of hydrogen above 770 °C. However, a high oxygen partial pressure at the anode causes a decrease in the EMF according to eqn (1). As can be seen in Fig. 2, the lower equilibrium oxygen partial pressure from the hydrogen give rise to the higher EMF at temperatures below 770 °C, while the UCG gas achieves a higher EMF as a result of the lower oxygen partial pressure when the temperature is higher than 770 °C. Moreover, the EMF for the simulated UCG gas increases monotonically with increasing temperature, opposite of the trend shown for hydrogen, and EMF values at all temperatures were above 1.05 V. The high EMF indicates operating SOFCs with UCG gas are feasible.


image file: c5ra15980f-f2.tif
Fig. 2 Variation of the equilibrium oxygen partial pressure at the anode (hollow symbols) and the EMF (solid symbols) with temperature for cells fuelled by 3% H2O humidified H2 and simulated UCG gas.

A cross section image of the NiO-GDC‖GDC‖B0.9CFN single cell before testing is given in Fig. 3. It can be seen that the individual components of SOFC contact tightly, without de-lamination, cracking, or obvious defects, and the interface is smooth and regular. The GDC electrolyte is dense, with a thickness of 13 µm. The B0.9CFN cathode layer has porous structure and a thickness of approximately 25 µm. The porosity of the anode, however, is slightly lower, which could be naturally improved after the reduction of NiO particles in the anode. The observed good adhesion between the dense electrolyte and the porous electrodes could extend the spatial structure, lengthen the triple phase boundaries, and thus increase the active sites substantially as well as ensuring good electrochemical performance and durability of the cell.


image file: c5ra15980f-f3.tif
Fig. 3 A cross-section view of the NiO-GDC‖GDC‖B0.9CFN single cell before testing.

Fig. 4a shows the cell impedance spectra for the 3% H2O humidified H2 and simulated UCG gas at different temperatures under open circuit conditions. The high frequency intercept represents the ohmic resistance Ro of the cell, and the differences in ohmic resistance between the H2 and simulated UCG gas as the fuel were almost negligible, indicating the bulk resistance of cells with the two fuels remains to be same. The polarization resistance Rp (i.e. the difference between the intercepts of the impedance arc on the real axis) of the cell with simulated UCG gas was higher than that of the cell with H2 fuel at all temperatures though. Moreover, the differences of the Rp values of cells with H2 and simulated UCG gas decreased with increasing temperature, and the polarization resistance of cells with the two fuels at 650 °C were relatively close to each other, implying that the UCG gas fed cell would produce a high power output at intermediate temperatures. From the polarization resistances of the symmetrical cell with B0.9CFN electrodes measured with a GDC electrolyte in a configuration of B0.9CFN‖GDC‖B0.9CFN with 3% H2O humidified H2 and simulated UCG gas at 500–650 °C under open circuit conditions, shown in Fig. 4b, the activation energies can be determined to be 0.75 and 0.95 eV for hydrogen and UCG gas, respectively. The higher activation energy for UCG gas results in slow kinetics at low temperatures, which likely caused the relatively decreased maximum powder density (MPD) shown in Fig. 5. However, the activation energy for the UCG gas is much lower than those of other hydrocarbon fuels. For example, the activation energy for 3% H2O humidified CH4 was reported to be 1.18–1.31 eV,31 and the activation energy for C4H10 was as high as 202 kJ mol−1,32 i.e. 2.09 eV. Thus, the UCG gas fuel is expected to have a higher MPD than other hydrocarbons, especially at intermediate temperature.


image file: c5ra15980f-f4.tif
Fig. 4 (a) Cell impedance and (b) electrode polarization resistance of symmetrical cells as a function of operating temperature.

image file: c5ra15980f-f5.tif
Fig. 5 Voltage and power density versus current density curves for cells with (a) 3% H2O humidified H2 and (b) simulated UCG gas at various temperatures.

The current–voltage and current–power characterization of cells with humidified H2 and simulated UCG gas at temperatures ranging from 500 to 650 °C is presented in Fig. 5. As expected, the performance was enhanced with increasing temperature. The cell using hydrogen as fuel always gave the higher power, with maximum power densities of 0.330, 0.544, 0.765 and 0.936 W cm−2 at 500, 550, 600 and 650 °C, respectively. The UCG gas fueled cell exhibited maximum powder densities of 0.151, 0.299, 0.537 and 0.729 W cm−2 at 500, 550, 600 and 650 °C, respectively, which are a little higher than those of a methanol fueled SOFC,9 and at least twice the maximum power density of that of a methane fueled SOFCs.33,34 For clarity, the measured open circuit voltage (OCV) values are listed in Table 2, including the calculated EMF values in parentheses. The trend in the experimental OCV values and the calculated EMF values with temperature is the same. Although the experimental OCV values are less than the calculated EMFs, presumably indicating the existence of electronic conductivity in the GDC electrolyte under a reducing atmosphere from the partial reduction of Ce4+ to Ce3+, the measured OCV values of the H2 and simulated UCG gas fed cells appear to be equally matched. So it is reasonable to draw the conclusion that UCG gas shows excellent prospects as a fuel for ceria-based SOFCs at intermediate temperature.

Table 2 Experimental open circuit voltage and thermochemically calculated EMF (in parentheses) at various temperatures
Temperature/°C Open circuit voltage (calculated EMF)/V
H2 UCG gas
500 0.872 (1.152) 0.779 (1.057)
550 0.835 (1.144) 0.786 (1.059)
600 0.805 (1.136) 0.808 (1.063)
650 0.777 (1.128) 0.814 (1.070)


The performance stability of the cells was also investigated. The current density at a constant cell voltage of 0.7 V at 600 °C with H2 and simulated UCG gas as a function of time is shown in Fig. 6. No measurable performance loss was observed in the case of the hydrogen fueled cell, implying the superior chemical stability of B0.9CFN, steady electric characteristics of the electrodes, and strong bonding between the electrolyte and electrodes, as shown in Fig. 3. For the cell operating with UCG gas, a slight current density decrease ranging from 0.2959 to 0.2790 A cm−2 was observed during the 480 h of testing, and the subsequent cross-section SEM inspection (Fig. 7) of the tested cell indicated no measurable carbon deposition on the anode surface. Furthermore, the EDS results for the NiO–GDC anode after performance stability testing with simulated UCG gas are displayed in Fig. 8, and a small C peak was found. Therefore, it can be concluded that the ceria-based anode supported SOFC with the B0.9CFN cathode can effectively inhibit or remove carbon species when using UCG gas as a fuel. The cell running with UCG gas exhibited reliable durability due to the much higher current density obtained at 0.7 V than the critical current density of 0.100 A cm−2 for carbon deposition mentioned by Koh et al.18 using 3 vol% H2O humidified methane fuel gas employing a Ni–YSZ anode at 750 °C.


image file: c5ra15980f-f6.tif
Fig. 6 Time-dependent history of current density at 0.7 V for cells fed with 3% H2O humidified H2 and simulated UCG gas at 600 °C.

image file: c5ra15980f-f7.tif
Fig. 7 Cross-section SEM micrographs of Ni/GDC anodes exposed to 3% H2O humidified simulated UCG gas after a cell performance stability test at 600 °C.

image file: c5ra15980f-f8.tif
Fig. 8 EDX results for the NiO–GDC anode after operation with simulated UCG gas (3% H2O) at 600 °C for 480 h.

Since the fuel gas was at a constant rate of 80 mL min−1, the theoretical carbon deposition can be calculated on the basis of the ideal gas state equation and the equilibrium compositions of the UCG gas showed in Fig. 1. The theoretical carbon deposition of the cell running with humidified simulated UCG gas at 600 °C is 0.006812 mol h−1 (i.e., 0.08174 g h−1 carbon). However, the coking result of the cell running with simulated UCG gas was not as bad as predicted. There may be two reasons for the better than predicted long-term stability. On one hand, the slow kinetics at 600 °C causes less pyrolysis of the methane species in the UCG gas, resulting in less coke formation, since the thermodynamic equilibrium analysis assumes that all chemical species reach complete thermodynamic equilibrium at the anode side, although the equilibration kinetics factors are not fully considered. On the other hand, the relatively sufficient O2− supply, to react with the deposited carbon particles due to fast migration of oxygen ions, contributes to the inhibition of carbon deposition at low operating temperatures. We assume that the A-site deficient B0.9CFN is responsible for the adequate O2− transport from the cathode to the anode because additional oxygen vacancies created from A-site deficiencies are beneficial to the oxygen reduction reaction and facilitate oxygen ion diffusion within the oxide bulk, as our previous study showed,30,35,36 along with others.37,38 Meanwhile, the GDC electrolyte contributes to the fast migration of oxygen ions due to its relatively high ionic conductivity at intermediate temperatures. So even if some carbon deposits would occur, the oxygen species from GDC can promote their removal, similar to the effects of ceria-based materials mentioned in other literatures.39,40 The Ni-GDC‖GDC‖B0.9CFN cell fed with UCG gas demonstrated an excellent stability against coke formation, maintaining a relatively stable current density, suggesting that the UCG gas could be a potential hydrocarbon fuel for SOFCs.

4. Conclusions

The equilibrium compositions of fuel in a cell fed with 3% H2O humidified simulated UCG gas were calculated in the temperature range between 400 and 900 °C based on thermochemical calculations using the Gibbs free energy minimization method, assuming that various chemical species reached complete thermodynamic equilibrium. Based on these equilibrium compositions, the EMFs for SOFCs running with H2 and simulated UCG gas were calculated. Afterwards these two fuels were supplied to ceria-based electrolyte single cells, and a systematic study was conducted. Compared to the calculated EMFs assuming a pure ionic conducting electrolyte is adopted, the measured OCVs of the cells were lower, indicating some electronic conduction in the GDC electrolyte under the temperatures and oxygen pressures employed in this study. Besides, the UCG gas fed cell demonstrated exceptional electrochemical performance, only slightly inferior to that of hydrogen fed cell, and comparatively stable long-term stability. SEM inspection of a cell after 480 h of operation in UCG gas at 600 °C at 0.7 V showed that the anode itself remained free of any carbon deposits. This work suggests that the UCG gas has an intriguing future for direct utilization in SOFCs, and affords the simplicity of not having to reform the fuel with an expensive external reformer. Such a fuel would be ideal for an industrial integrated coal gasification fuel cell system (IGFC).

Acknowledgements

Financial supports from MOST of China (2012CB215404) and the NSFC of China (51261120378) are greatly appreciated.

References

  1. Z. L. Zhan and S. A. Barnett, Science, 2005, 308, 844 CrossRef CAS PubMed.
  2. M. L. Faro and A. S. Arico, Int. J. Hydrogen Energy, 2013, 38, 14773 CrossRef PubMed.
  3. T. J. Lee and K. Kendall, J. Power Sources, 2008, 181, 195 CrossRef CAS PubMed.
  4. T. M. Gur, M. Homel and A. V. Virkar, J. Power Sources, 2010, 195, 1085 CrossRef PubMed.
  5. Y. M. Park and H. Kim, Int. J. Hydrogen Energy, 2014, 39, 16513 CrossRef CAS PubMed.
  6. P. Hofmann, K. D. Panopoulos, L. E. Fryda, A. Schweiger, J. P. Ouweltjes and J. Karl, Int. J. Hydrogen Energy, 2008, 33, 2834 CrossRef CAS PubMed.
  7. J. G. Lee, C. M. Lee, M. Park and Y. G. Shul, RSC Adv., 2013, 3, 11816 RSC.
  8. J. Liu and S. A. Barnett, Solid State Ionics, 2003, 158, 11 CrossRef CAS.
  9. M. F. Liu, R. R. Peng, D. H. Dong, J. F. Gao, X. Q. Liu and G. Y. Meng, J. Power Sources, 2008, 185, 188 CrossRef CAS PubMed.
  10. H. Q. Li, Y. Tian, Z. M. Wang, F. C. Qie and Y. D. Li, RSC Adv., 2012, 2, 3857 RSC.
  11. Z. B. Yang, Y. Chen, C. Jin, G. L. Xiao, M. F. Han and F. L. Chen, RSC Adv., 2015, 5, 2702 RSC.
  12. Y. Q. Li, X. B. Zhu, Z. Lu, Z. H. Wang, W. Jiang, X. Q. Huang and W. H. Su, Int. J. Hydrogen Energy, 2014, 39, 7980 CrossRef CAS PubMed.
  13. P. Zhang, Y. H. Huang, J. G. Cheng, Z. Q. Mao and J. B. Goodenough, J. Power Sources, 2011, 196, 1738 CrossRef CAS PubMed.
  14. S. D. Song, M. F. Han, J. Q. Zhang and H. Fan, J. Power Sources, 2013, 233, 62 CrossRef CAS PubMed.
  15. M. J. Escudero, I. Gómez de Parada, A. Fuerte and J. L. Serrano, J. Power Sources, 2014, 253, 64 CrossRef CAS PubMed.
  16. S. E. Evans, O. J. Good, J. Z. Staniforth, R. M. Ormerod and R. J. Darton, RSC Adv., 2014, 4, 30816 RSC.
  17. C. W. Sun and U. Stimming, J. Power Sources, 2007, 171, 247 CrossRef CAS PubMed.
  18. J. H. Koh, Y. S. Yoo, J. W. Park and H. C. Lim, Solid State Ionics, 2002, 149, 157 CrossRef CAS.
  19. B. C. H. Steele, Solid State Ionics, 2000, 129, 95 CrossRef CAS.
  20. D. J. Seo, K. O. Ryu, S. B. Park, K. Y. Kim and R. H. Song, Mater. Res. Bull., 2006, 41, 359 CrossRef CAS PubMed.
  21. M. J. Beier, T. W. Hansen and J. D. Grunwaldt, J. Catal., 2009, 266, 320 CrossRef CAS PubMed.
  22. V. Prabu and S. Jayanti, Appl. Energy, 2012, 94, 406 CrossRef CAS PubMed.
  23. V. Prabu and S. Jayanti, Int. J. Hydrogen Energy, 2012, 37, 1677 CrossRef CAS PubMed.
  24. A. W. Bhutto, A. A. Bazmi and G. Zahedi, Prog. Energy Combust. Sci., 2013, 39, 189 CrossRef CAS PubMed.
  25. P. Arunkumar, S. Preethi and K. S. Babu, RSC Adv., 2014, 4, 44367 RSC.
  26. F. Wang, W. Wang, J. F. Qu, Y. J. Zhong, M. O. Tade and Z. P. Shao, Environ. Sci. Technol., 2014, 48, 124277 Search PubMed.
  27. S. M. Jamil, M. H. D. Othman, M. A. Rahman, J. Jaafar, A. F. Ismail and M. A. Mohamed, RSC Adv., 2015, 5, 58154 RSC.
  28. T. Kudo and H. Obayashi, J. Electrochem. Soc., 1976, 123, 415 CrossRef CAS PubMed.
  29. K. Sasaki and Y. Teraoka, J. Electrochem. Soc., 2003, 150, A878 CrossRef CAS PubMed.
  30. Z. Liu, L. Z. Cheng and M. F. Han, J. Power Sources, 2011, 196, 868 CrossRef CAS PubMed.
  31. H. Lv, D. J. Yang, X. M. Pan, J. S. Zheng, C. M. Zhang, W. Zhou, J. X. Ma and K. A. Hu, Mater. Res. Bull., 2009, 44, 1244 CrossRef CAS PubMed.
  32. C. Lu, W. L. Worrell, R. J. Gorte and J. M. Vohs, J. Electrochem. Soc., 2003, 150, A354 CrossRef CAS PubMed.
  33. Y. B. Lin, Z. L. Zhan, J. Liu and S. A. Barnett, Solid State Ionics, 2005, 176, 1827 CrossRef CAS PubMed.
  34. B. Huang, X. F. Ye, S. R. Wang, H. W. Nie, J. Shi, Q. Hu, J. Q. Qian, X. F. Sun and T. L. Wen, J. Power Sources, 2006, 162, 1172 CrossRef CAS PubMed.
  35. Z. B. Yang, C. Jin, C. H. Yang, M. F. Han and F. L. Chen, Int. J. Hydrogen Energy, 2011, 36, 11572 CrossRef CAS PubMed.
  36. Z. B. Yang, C. H. Yang, C. Jin, M. F. Han and F. L. Chen, Electrochem. Commun., 2011, 13, 882 CrossRef CAS PubMed.
  37. H. L. Zhao, Y. F. Cheng, N. S. Xu, Y. Li, F. S. Li, W. Z. Ding and X. G. Lu, Solid State Ionics, 2010, 181, 354 CrossRef CAS PubMed.
  38. F. C. Wang, D. J. Chen and Z. P. Shao, Electrochim. Acta, 2013, 103, 23 CrossRef CAS PubMed.
  39. Y. Li, X. X. Wang, C. Xie and C. S. Song, Appl. Catal., A, 2009, 357, 213 CrossRef CAS PubMed.
  40. Z. M. Wang, Y. Li and J. W. Schwank, J. Power Sources, 2014, 248, 239 CrossRef CAS PubMed.

This journal is © The Royal Society of Chemistry 2015
Click here to see how this site uses Cookies. View our privacy policy here.