High temperature dielectric relaxation anomalies in Ca0.9Nd0.1Ti0.9Al0.1O3−δ single crystals

G. Murugesana, R. Nithyab, S. Kalainathan*a and Shamima Hussainc
aCentre for Crystal Growth, School of Advanced Sciences, VIT University, Vellore 632 014, Tamil Nadu, India. E-mail: s.kalainathan@gmail.com
bMaterials Science Group, Indira Gandhi Centre for Atomic Research, Kalpakkam 603 102, Tamil Nadu, India
cUGC-DAE Consortium for Scientific Research, Kalpakkam Node, Kokilamedu 603104, India

Received 7th August 2015 , Accepted 3rd September 2015

First published on 4th September 2015


Abstract

We herein report dielectric studies on Ca0.9Nd0.1Ti0.9Al0.1O3−δ single crystals grown by the optical floating zone technique in the temperature range from room temperature to 660 K. Two dielectric anomalies were observed at ∼436 K and 520 K, which correspond to relaxor-like behaviour due to Maxwell–Wagner relaxations and conduction relaxation associated with doubly ionized oxygen vacancies respectively. The presence of Ti3+ for charge carrier hopping and oxygen vacancies is confirmed by X-ray photoelectron spectroscopy analysis.

Introduction

Due to its versatile properties CaTiO3 (CTO) has been used as a matrix for storing nuclear waste (SYNROC).1 High permittivity and low dielectric loss make it suitable for microwave dielectric applications as resonators and filters,2 and it can also be used as a host for rare earth ions for efficient luminescence.3 CaTiO3 is an incipient ferroelectric material at low temperatures and doping of Pb up to x = 0.3 in Ca1−xPbxTiO3 makes it ferroelectric.4,5 CaTiO3 (orthorhombic)–NdAlO3 (rhombohedral) based ceramics are structurally compatible which allows them to be used for commercial production of microwave dielectric resonators in wireless communications.6

Recently dielectric anomalies occurring at higher temperatures, other than ferroelectric transitions, are being reported.7–13 These anomalies are strongly related to oxygen vacancies and the Maxwell–Wagner mechanism which is due to the electrical inhomogeneity in the sample. Oxygen vacancies bring about dielectric relaxation in the material and also they are a key factor to understand many properties like electrical, magnetic and optical properties.7 Thus interest has been focused on understanding the vital importance of oxygen vacancies. Few reports on high temperature dielectric studies on single crystals reveal that these anomalies are dielectric relaxations due to oxygen vacancies, dipolar and Maxwell–Wagner mechanisms.7–9 Bidault et al.14 have done high temperature dielectric studies on flux grown CTO single crystals, where they found an anomaly at 680 °C which was attributed to mono-dispersive Debye-type dielectric relaxation due to oxygen vacancies. To our knowledge there are no investigations on the high temperature dielectric properties of Ca0.9Nd0.1Ti0.9Al0.1O3−δ (CNTAO) single crystals. This motivated us to undertake investigations of dielectric properties at high temperatures. In this paper, we present the dielectric properties of CNTAO single crystals at temperatures ranging from room temperature to 660 K.

Experimental

The single crystals of CNTAO were grown by the optical floating zone technique in an argon atmosphere.15 The temperature dependence of the dielectric response was measured in the heating mode at the rate of 1 °C min−1 from 315 K to 660 K using an N4L PSM1735 (Newton4th Ltd, UK) impedance analyzer in the frequency range of 100 Hz to 1 MHz. The frequency dependence of the dielectric response was measured in the frequency range of 50 Hz to 5 MHz. X-ray photoelectron spectra for the as grown crystals were recorded using an M/s Specs Spectrometer with a DLSEGD detector with a monochromatic Al Kα X-ray source (resolution was 0.1 eV at a band pass energy of 50 eV).

Results and discussion

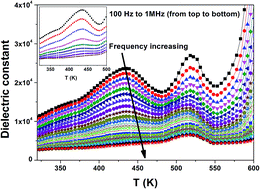
Fig. 1 shows the temperature dependence of the real part of the complex permittivity for CNTAO single crystals in the measured temperature range at various frequencies. It is clear that there are two anomalies occurring at ∼436 K and 520 K. The peak position of the low temperature anomaly moves to the higher temperature side with decreasing peak intensity as the frequency increases proving it to be a relaxor-like behaviour.7,8 The higher temperature anomaly is frequency independent but its intensity decreases for increasing frequency which is termed as a phase-transition-like anomaly.7,8 The subsequent increase of the dielectric constant at higher temperatures is due to the increase of conduction in the sample.14
image file: c5ra15876a-f1.tif
Fig. 1 Temperature dependence of the real part of permittivity for CNTAO single crystals measured at various frequencies from 100 Hz to 1 MHz (from top to bottom). Inset shows the magnified part of the low temperature anomaly.

In order to understand the nature of the dielectric relaxations leading to these anomalies, we investigated the frequency dependent dielectric permittivity at various temperatures. The frequency dependence of the dielectric constant (ε′) and dielectric loss (ε′′) are shown in Fig. 2 and 3 respectively.


image file: c5ra15876a-f2.tif
Fig. 2 Dielectric constant as a function of frequency for CNTAO single crystals measured at different frequencies. Inset shows the magnified image of the low temperature region.

image file: c5ra15876a-f3.tif
Fig. 3 Dielectric loss as a function of frequency for CNTAO single crystals measured at different frequencies.

A step like decrease in ε′ with increasing frequency signifies the presence of relaxation in the grown crystal for the low temperature region.16 The relaxation processes could be analyzed in terms of Debye behaviour or Maxwell–Wagner (MW) behaviour. For a Debye system ε′′ tends to zero as the frequency reduces to zero, whereas in the MW behaviour ε′′ tends to infinity as the frequency reduces to zero.17 In our case the latter one is applicable. From Fig. 3 it is evident that ε′′ tends to higher values rather than zero proving it to be a MW relaxation process. The increase of ε′′ with decreasing frequency indicates it to be a MW effect.17 MW type relaxation can occur due to the electrical inhomogeneities of the sample or grain boundaries.18 The grain boundary contribution to the polarization effect is being eliminated by doing the measurements on single crystals. The electrode polarization (EP) effect is seen for lower frequencies, since the charge carriers have enough time at low frequencies to accumulate at the sample–electrode interfaces.19

The formation of Schottky barriers (layers with depleted charge carriers) at the electrode–sample interface due to the difference in work functions of the metal (electrode) and the semiconductor (sample) can also be attributed to electrode polarization. In order to determine the conducting nature of the grown crystal, impedance analysis was done. The variation of the real part of impedance (Z′) with the frequency for various temperatures is shown in Fig. 4. The decrease of Z′ with the increase in temperature at lower frequencies shows a negative temperature coefficient of a resistance type behaviour similar to that of semiconductors; further, the merging of Z′ values for all temperatures at high frequencies may be due to the release of space charge due to the reduction in barrier properties with a rise in temperature.20 This clearly indicates the accumulation of charges at the sample–electrode interface.


image file: c5ra15876a-f4.tif
Fig. 4 Frequency dependence of the real part Z′ for CNTAO single crystals at various temperatures.

The variation of Z′′ with frequency at different temperatures is shown in Fig. 5. The broadening of the peak, which is slightly asymmetrical, with the rise in temperature suggests that there is temperature dependent electrical relaxation in grown single crystals of CNTAO.20,21 The relaxation time τ is calculated using the relation 2πfpτ = 1 (here fp is the frequency corresponding to maximum Z′′) from the peak positions of the plot in Fig. 5 (Z′′ vs. frequency). The inset in Fig. 5 shows the variation of τ vs. 1000/T, where the activation energy is found by linear fit of the Arrhenius equation:

 
image file: c5ra15876a-t1.tif(1)
where τ0 is the pre-exponential factor, T is the temperature and kB is the Boltzmann constant.


image file: c5ra15876a-f5.tif
Fig. 5 Frequency dependence of the imaginary part Z′′ for CNTAO single crystals at various temperatures. Inset shows plot of ln(τ) vs. 1000/T.

The deviation in the Arrhenius equation at higher temperature clearly shows the presence of another relaxation mechanism at higher temperature. The activation energy for the LT region is found to be 0.40 eV and HT region is found to be 1.0 eV. In order to understand the physical nature of the relaxations, the frequency dependence of tan[thin space (1/6-em)]δ was analyzed in the low and high temperature regions. The frequency dependence of tan[thin space (1/6-em)]δ is shown in Fig. 6. The inset in Fig. 6 shows peak position fm (frequency corresponding to maximum tan[thin space (1/6-em)]δ at a particular temperature) vs. 1000/T. The deviation in the Arrhenius equation is clearly seen from the low temperature region to higher temperature region. The activation energies calculated for the two regions are 0.40 eV and 0.83 eV respectively. The deviation in the Arrhenius equation and the presence of different activation energies for the different temperature regions is due to the change of relaxation mechanisms.7 The value of the activation energy for the low temperature region is associated with oxygen vacancy clustering; the energy required to move these clusters is less than the energy required to move individual oxygen vacancies.7,22,23 Oxygen vacancies can also trap charge carriers, the hopping of trapped charge carriers between trap sites with the increase in temperature gives rise to a dipolar effect.7 To further probe the relaxation behaviour of the low temperature anomaly, the electric modulus was calculated and the plot for M′′ (T) is shown in Fig. 7. It is clear from the plot that there is a shift in peak temperature for higher temperatures with increasing frequency indicating thermally activated relaxation.8


image file: c5ra15876a-f6.tif
Fig. 6 Frequency dependence of tan[thin space (1/6-em)]δ for CNTAO single crystals at various temperatures. The inset shows the Arrhenius plot of tan[thin space (1/6-em)]δ peak.

image file: c5ra15876a-f7.tif
Fig. 7 Temperature dependence of the imaginary part of electric modulus for CNTAO crystals at various frequencies. Inset shows the Arrhenius plot of the LT relaxation.

From the Arrhenius law the relaxation parameters are calculated,

 
image file: c5ra15876a-t2.tif(2)
where f0 is the pre-exponential factor, Erelax. is the activation energy for relaxation, kB is the Boltzmann constant and Tp is the temperature corresponding to the peak maximum in M′′ (T). The inset of Fig. 7 shows the Arrhenius plot, from which the activation energy for relaxation was deduced to be 0.52 eV. In order to determine whether these anomalies are related to oxygen vacancies, the grown crystals were annealed in an O2 atmosphere at 1000 °C for 6 h. The as grown crystals were black in colour and when annealed they became transparent, which is shown in the inset in Fig. 8. The dielectric properties as a function of temperature were investigated for the annealed sample. Fig. 8 shows the temperature dependence of the dielectric constant for pre-annealed and post-annealed samples. It is clearly seen that the intensity of both anomalies decreases for O2 annealed samples proving it to be related to oxygen vacancies. Earlier reports have proved that the relaxation similar to the LT region is due to dipolar relaxation (hopping motion of trapped charge carriers) and MW relaxation due to the blocking of the hopping carriers at the sample/electrode interface.8,9 The activation energy of the high temperature region is compatible with the activation energy of the movement of oxygen ions or oxygen vacancies.7,24 The high temperature region anomaly is conduction relaxation due to the movement of doubly ionized oxygen vacancies which will be explained later.


image file: c5ra15876a-f8.tif
Fig. 8 Temperature dependence of the dielectric constant for as prepared and O2 annealed crystals measured at 300 Hz. Inset shows (a) an as cut grown crystal before annealing, (b) a part of the crystal after annealing.

In order to study the electrode polarization effect, we conducted a Nyquist plot analysis in order to separate the interfacial effect from the bulk effect. The Nyquist plot (Z′′ vs. Z′) is shown in Fig. 9. It is evident that the decrease in the radius of the semicircle with the increase in temperature shows that the resistivity decreases with the temperature. The semicircle in the Nyquist plot shows the presence of dielectric relaxation in the crystal with its diameter representing the resistance of the measured sample.25 A single semicircular arc is present at all temperatures in the higher frequency region which is due to the relaxation belonging to the bulk dielectric response of the material. The faint tail appearing at low frequency can be ascribed to the dielectric response due to the contact of the sample/electrode.25 Fig. 10 shows the Nyquist plot for CNTAO crystals at 574 K, this behaviour is modelled by a double layered model consisting of two RC (R – Resistance, CPE – Constant Phase Element) circuits (one for bulk and other one for contact) connected in series as shown in the inset of Fig. 10.26 The equivalent circuit was fitted by using EIS spectra analyser 1.0.27 Due to the electrode polarization effect, we could not observe a full semi circular arc for all the temperatures. The semicircular arc for the bulk dielectric response is simulated as shown in Fig. 10. The constant phase element is a non-ideal frequency dependent capacitance which can be associated with the distribution of relaxation times.28,29 The impedance of CPE is defined as

 
image file: c5ra15876a-t3.tif(3)
where the CPE is treated as an ideal capacitor for n = 1 and resistor for n = 0.26 Fitted parameters of the equivalent circuit are shown in Table 1. The values of R1, C1 & n1 correspond to dielectric response due to the electrode/sample interface and the values of R2, C2 & n2 correspond to the bulk response of the material. The n2 value is about 0.978 (close to 1) which shows that the CPE for the bulk dielectric response can be treated as an ideal capacitor.


image file: c5ra15876a-f9.tif
Fig. 9 Nyquist plot for CNTAO single crystals at various temperatures.

image file: c5ra15876a-f10.tif
Fig. 10 Nyquist plot for CNTAO single crystals at 574 K.
Table 1 Resulting parameters of the Nyquist plot fitted to an equivalent circuit described in the text
Fitted parameters Values Error (%)
R1 1 × 10⁶ Ω 4.0098
R2 31[thin space (1/6-em)]974 Ω 0.13634
CPE (C1) 9.1253 × 10⁻⁷ F 0.13451
n1 0.388 0.040817
CPE (C2) 3.581 × 10⁻¹¹ F 0.68214
n2 0.978 0.050278


Fig. 11 shows the spectroscopic plots of M′′ at various temperatures. The positions of the modulus peaks shift to higher frequencies with the increasing temperature, which shows the presence of thermally activated relaxation in the CNTAO crystals.25


image file: c5ra15876a-f11.tif
Fig. 11 Frequency dependence of the imaginary part M′′ for CNTAO single crystals at various temperatures.

The high temperature dielectric anomalies in oxides is due to the oxygen vacancies, and the activation energy value lies between 0.3–1.0 eV for the relaxations caused by oxygen vacancies.8 To prove that these anomalies in single crystal samples are related to delocalized carriers, we performed an analysis on the conduction behaviour of CNTAO single crystals. Fig. 12 shows the Arrhenius plot of AC conductivity measured at 300 Hz. The AC conductivity (σ) is given by,

 
image file: c5ra15876a-t4.tif(4)
where σ0 is a constant. The Arrhenius plot (Fig. 12) can be fitted with an activation energy of 0.54 eV for the low temperature region and 1.05 eV for the high temperature. The deviation in the Arrhenius equation at higher temperature proves the presence of conduction relaxation in the grown crystals at higher temperatures.7 The activation energy of 1.05 eV proves that the conduction phenomenon is due to the migration of oxygen vacancies at higher temperatures.24 The Arrhenius plot of AC conductivity for O2 annealed crystals is shown as an inset in Fig. 12, the activation energies for low temperature and high temperature anomalies is 0.56 eV and 1.08 eV. The increase in activation energy after O2 annealing, from 0.54 eV to 0.56 eV for low temperature anomaly and 1.05 eV to 1.08 eV for high temperature anomaly, signifies the reduction of oxygen vacancies due to annealing. The calculated activation energies for the high temperature region are around 1.05 eV which corresponds to the activation energies of doubly ionized oxygen vacancies.11


image file: c5ra15876a-f12.tif
Fig. 12 Temperature dependence of conductivity for the grown CNTAO crystals. Inset shows the temperature dependence of conductivity for O2 annealed crystals.

Fig. 13 shows the variation of the AC conductivity with frequency for different temperatures. It is clearly seen from the plot that dispersion exists in the conductivity values at lower frequencies, but at higher frequencies the curves converge. The deviation in the low frequency region (encircled) is due to the electrode polarization effect.30 The increase in AC conductivity with frequency can be explained by the charge carriers hopping between Ti4+ and Ti3+ ions. The resultant increase in the conduction process is due to the enhancement of charge carriers hopping with increased frequency.12,31 In most titanates oxygen vacancies play a role as mobile charge carriers, and conduction electrons are produced by the ionization of oxygen vacancies which is explained by the Kroger–Vink notation as follows,32

image file: c5ra15876a-t5.tif


image file: c5ra15876a-f13.tif
Fig. 13 Frequency dependence of AC conductivity of CNTAO crystals for various temperatures.

The oxygen vacancies and excess electrons are the products of the reduction reaction. These excess electrons bond with Ti4+ following the reaction Ti4+ + e ↔ Ti3+ resulting in Ti3+ ions. The presence of Ti3+ ions was confirmed by X-ray Photoelectron Spectroscopy (XPS) measurements.

The elemental composition and chemical state of the grown crystal are provided by XPS. The full spectrum in Fig. 14 shows that the grown crystals contain Ca, Ti, O, Nd, Al and C elements. The Ti 2p spectrum shown in Fig. 15 was deconvoluted using a Gaussian function. The core level binding energy of Ti 2p1/2 and Ti 2p3/2 appeared at 463.64 eV and 457.97 eV respectively with a spin orbit coupling of 5.7 eV, confirming the oxidation state is Ti4+. The difference in binding energy for Ti 2p3/2 (457.96 eV) and TiO2 bulk (459.0 eV) is of ∼1 eV suggesting that the presence of Ca affects the ionic character of the Ti–O bond, which results in the increase of bond length and hence a decrease in the binding energy as compared with bulk TiO2.33,34 The presence of Ti2O3 (Ti3+) at 456.4 eV is attributed to the presence of oxygen deficiencies in the grown crystal.35 Fig. 16 shows the O 1s spectrum which has well resolved doublet peaks at 529.2 eV and 531.6 eV. The lowest binding energy peak at 529.2 eV is assigned to the oxygen species in the perovskite structure. The higher binding energy peak at 531.6 eV is ascribed to oxygen vacancies.36–40 The suppression of the peak at 531.6 eV after O2 annealing (shown as inset in Fig. 16) proves the decrease of oxygen vacancies after O2 annealing treatment. This shows that the grown crystal has oxygen vacancies and these are attributed to the dielectric relaxations.


image file: c5ra15876a-f14.tif
Fig. 14 Wide XPS spectrum of CNTAO single crystals.

image file: c5ra15876a-f15.tif
Fig. 15 Ti 2p XPS spectrum of CNTAO crystals.

image file: c5ra15876a-f16.tif
Fig. 16 O 1s XPS spectrum of CNTAO crystals, inset shows the O 1s spectrum after O2 annealing.

Conclusion

Dielectric studies on CNTAO single crystals were done in the temperature range between RT and 660 K. Two kinds of dielectric anomalies were observed, the first one occurring at ∼436 K showing a relaxor-like behaviour. Dipolar and Maxwell–Wagner relaxations are the cause for this anomaly. The activation energies of ∼0.4 to 0.5 eV for the low temperature anomaly prove that these anomalies are due to oxygen vacancies. The annealing treatment in an O2 atmosphere has also proved that these anomalies are dependent on oxygen vacancies. The electrode polarization effect dominates the Maxwell–Wagner relaxations. The formation of Schottky barriers could be the reason for electrode polarization. The higher temperature anomaly occurring at ∼520 K is a kind of conduction relaxation associated with doubly ionized oxygen vacancies with an activation energy of ∼1.05 eV. The XPS results confirmed the presence of Ti3+ ions and presence of oxygen vacancies in the grown single crystals.

Acknowledgements

GM would like to express his gratitude to UGC-DAE Consortium for Scientific Research for providing financial support and VIT University management for their constant encouragement. This work has been carried out at UGC-DAE Consortium for Scientific Research, Kalpakkam Node, Kokilamedu. GM also thanks Dr V. Subramanian and Mr G. Ramesh, Department of Physics, IIT Madras for dielectric measurements, Dr Fumio Hamada and Dr Yoshihiko Kondo, Akita University for XPS measurements.

References

  1. R. C. Ewing, Prog. Nucl. Energy, 2007, 49, 635–643 CrossRef CAS PubMed.
  2. B. Jancar, D. Suvorov, M. Valant and G. Drazic, J. Eur. Ceram. Soc., 2003, 23, 1391–1400 CrossRef CAS.
  3. K. Lemanski, A. Gagor, M. Kurnatowska, R. Pazik and P. J. Deren, J. Solid State Chem., 2011, 184, 2713–2718 CrossRef CAS PubMed.
  4. V. V. Lemanov, A. V. Sotnikov, E. P. Smirnova, M. Weihnacht and R. Kunze, Solid State Commun., 1999, 110, 611–614 CrossRef CAS.
  5. V. V. Lemanov, A. V. Sotnikov, E. P. Smirnova and M. Weihnacht, Appl. Phys. Lett., 2002, 81, 886–888 CrossRef CAS PubMed.
  6. E. R. Kipkoech, F. Azough, R. Freer, C. Leach, S. P. Thompson and C. C. Tang, J. Eur. Ceram. Soc., 2003, 23, 2677–2682 CrossRef CAS.
  7. C. C. Wang, C. M. Lei, G. J. Wang, X. H. Sun and T. Li, J. Appl. Phys., 2013, 113, 094103 CrossRef PubMed.
  8. L. N. Liu, C. C. Wang, C. M. Lei, T. Li and G. J. Wang, Appl. Phys. Lett., 2013, 102, 112907 CrossRef PubMed.
  9. C. Wang, M. Zhang and W. Xia, J. Am. Ceram. Soc., 2013, 96, 1521–1525 CrossRef CAS PubMed.
  10. D. Kobor, B. Guiffard, L. Lebrun, A. Hajjaji and D. Guyomar, J. Phys. D: Appl. Phys., 2007, 40, 2920–2926 CrossRef CAS.
  11. S. Bhardwaj, J. Paul, S. Chand, K. K. Raina and R. Kumar, J. Mater. Sci.: Mater. Electron., 2014, 25, 4568–4576 CrossRef CAS.
  12. M. R. Shah and A. K. M. Akther Hossain, J. Mater. Sci. Technol., 2013, 29, 323–329 CAS.
  13. J. L. Ye, C. C. Wang, W. Ni and X. H. Sun, J. Alloys Compd., 2014, 617, 850–854 CrossRef CAS PubMed.
  14. O. Bidault, P. Goux, M. Kchikech, M. Belkaoumi and M. Maglione, Phys. Rev. B: Condens. Matter Mater. Phys., 1994, 49, 7868 CrossRef CAS.
  15. G. Murugesan, R. Nithya, S. Kalainathan and T. R. Ravindran, CrystEngComm, 2015, 17, 1982–1988 RSC.
  16. F. Kremer and A. Schomhals, Broadband Dielectric Spectroscopy, Springer, 2003, ISBN: 978-3-642-62809-2 Search PubMed.
  17. D. O’Neill, R. M. Bowman and J. M. Gregg, Appl. Phys. Lett., 2000, 77, 1520 CrossRef PubMed.
  18. U. Adem, N. Mufti, A. A. Nugroho, G. Catalan, B. Noheda and T. T. M. Palstra, J. Alloys Compd., 2015, 638, 228 CrossRef CAS PubMed.
  19. H. Lu, X. Zhang, B. He and H. Zhang, J. Appl. Polym. Sci., 2006, 102, 3590 CrossRef CAS PubMed.
  20. S. Sahoo, U. Dash, S. K. S. Parashar and S. M. Ali, J. Adv. Ceram., 2013, 2, 291–300 CrossRef CAS.
  21. S. Sen and R. N. P. Choudhary, Mater. Chem. Phys., 2004, 87, 256–263 CrossRef CAS PubMed.
  22. W. Li, K. Chen, Y. Y. Yao, J. S. Zhu and Y. N. Wang, Appl. Phys. Lett., 2004, 85, 4717 CrossRef CAS PubMed.
  23. X. F. Wang, X. M. Lu, C. Zhang, X. B. Wu, W. Cai, S. Peng, H. F. Bo, Y. Kan, F. Z. Huang and J. S. Zhu, J. Appl. Phys., 2010, 107, 114101 CrossRef PubMed.
  24. Z. Yu, C. Ang, P. M. Vilarinho, P. Q. Mantas and J. L. Baptista, J. Appl. Phys., 1998, 83, 4874 CrossRef CAS PubMed.
  25. J. Wang, Q. Li, Y. Yu, J. Zhang, J. Zheng, C. Cheng, Y. Li, H. Wang and C. Wang, Phys. B, 2014, 447, 62–64 CrossRef CAS PubMed.
  26. A. Baral, K. R. S. P. Meher and K. B. R. Varma, Bull. Mater. Sci., 2011, 34, 53 CrossRef CAS.
  27. A. S. Bondarenko and G. A. Ragoisha, in Progress in Chemometrics Research, ed. A. L. Pomerantsev, Nova Science Publishers, New York, 2005, pp. 89–102, http://www.abc.chemistry.bsu.by/vi/analyser/ Search PubMed.
  28. C. Longo and M.-A. de Paoli, J. Braz. Chem. Soc., 2003, 14, 889–901 CrossRef CAS.
  29. C. Longo, A. F. Nogueira and M.-A. de Paoli, J. Phys. Chem. B, 2002, 106, 5925 CrossRef CAS.
  30. D. K. Pradhan, R. N. P. Choudhary and B. K. Samantaray, Int. J. Electrochem. Sci., 2008, 3, 597 CAS.
  31. S. Sarangi, T. Badapanda, B. Behera and S. Anwar, J. Mater. Sci.: Mater. Electron., 2013, 24, 4033–4042 CrossRef CAS.
  32. F. A. Kroger and H. J. Vink, Solid State Phys., 1956, 3, 307 CAS.
  33. P. V. Nagarkar, P. C. Searson and F. D. Gealy III, J. Appl. Phys., 1991, 69, 459 CrossRef CAS PubMed.
  34. Y. Mao and S. S. Wong, Adv. Mater., 2005, 17, 2194 CrossRef CAS PubMed.
  35. K. Bapna, D. M. Phase and R. J. Choudhary, J. Appl. Phys., 2011, 110, 043910 CrossRef PubMed.
  36. M. Naeem, S. K. Hasanain, M. Kobayashi, Y. Ishida, A. Fujimori, S. Buzby and S. I. Shah, Nanotechnology, 2006, 17, 2675–2680 CrossRef CAS PubMed.
  37. A. Younis, D. Chu and S. Li, J. Phys. D: Appl. Phys., 2012, 45, 355101 CrossRef.
  38. J. Gan, X. Lu, J. Wu, S. Xie, T. Zhai, M. Yu, Z. Zhang, Y. Mao, S. C. I. Wang, Y. Shen and Y. Tong, Sci. Rep., 2013, 3, 1021 Search PubMed.
  39. P. Mohanty, N. C. Mishra, R. J. Choudhary, A. Banerjee, T. Shripathi, N. P. Lalla, S. Annapoorni and C. Rath, J. Phys. D: Appl. Phys., 2012, 45, 325301 CrossRef.
  40. P. R. Mandal and T. K. Nath, J. Alloys Compd., 2015, 628, 379–389 CrossRef CAS PubMed.

This journal is © The Royal Society of Chemistry 2015