
Seeded swelling polymerized sea urchin-like core–shell typed polystyrene/polyaniline particles and their electric stimuli-response
Dana Kima,
Yu Tianb and
Hyoung Jin Choi*a
aDepartment of Polymer Science and Engineering, Inha University, Incheon 402-751, Korea. E-mail: hjchoi@inha.ac.kr
bState Key Laboratory of Tribology, Tsinghua University, Beijing 100084, People's Republic of China
First published on 21st September 2015
Abstract
Core–shell structured sea urchin-like polystyrene/polyaniline (PS/PANI) particles were synthesized by a seeded swelling polymerization process, in which an aniline monomer was initially absorbed into the PS particles due to π–π* stacking interactions and an initiation step of the polymerization of aniline was carried out by ferric ions added. The morphology of the product particles was observed by scanning electron microscopy and transmission electron microscopy images. Their chemical bonding was examined via Fourier transform-infrared spectroscopy, while their thermal stability was studied by thermogravimetric analysis. The fabricated PS/PANI particles were dispersed in silicone oil to produce an electrorheological (ER) fluid, and then their ER characteristics were observed using both optical microscopy and a rotational rheometer to study rheological properties including shear viscosity, shear stress and dynamic yield stress in an electric field, exhibiting typical ER characteristics. Dielectric spectra were further analyzed by using a LCR meter.
1. Introduction
Electrorheological (ER) fluids are smart materials which consist of dielectric and/or semi-conducting particles and insulating carrier liquids.1,2 Their phase can be changed from a liquid-like to a solid-like state under an external electric field applied because the dispersed polarized particles in the medium attract each other and form chains perpendicular to the electrodes.3–5 By tuning the external electric field strength, their rheological properties such as yield stress, shear viscosity, and shear stress can be controlled6 similarly with magnetorheological (MR) fluids under a magnetic field instead of an electric field. Thereby the ER fluids are applicable to various applications including clutches, shock absorbers, haptic device controllers and human muscle stimulator because they represent reversible and drastic change of their state.7–9Among various electro-responsive particles for ER fluids including inorganic particles, carbonaceous materials, conducting polymers10–13 and their hybrids, the polyaniline (PANI) has received considerable interests for a long time owing to its good conductivity, environmental stability, low density, ease of synthesis and low cost. Consequently, PANI and its family with different shapes, composites, core–shell structured microspheres, and copolymers have been introduced as potential ER materials.14–18
On the other hand, the morphology of PANI is known to be associated with experimental conditions of its synthesis such as temperature, pH, type of oxidant, ratio of the oxidant to monomer and type of polymerization.19–23 Note that morphology of the dispersed particles associated with shape or size changes of the particles is reported to be an important factor in the rheological performance for ER fluids. Especially, researches for hierarchical structure on ER characteristics have drawn a great attention. For example, urchin-like particles, such as PANI/vanadium oxide,24 Cr-doped titania,25 hollow TiO2 microspheres,26 PANI27 and zinc oxide/carbonyl iron,28 were introduced into either ER or MR materials, consequently exhibiting better sedimentation stability than particles with a smooth surface and improved rheological behavior for some cases. Because surface area of the sea urchin-like structure is larger than that of the particles with smooth surface, sea urchin-like structured particles are expected to have larger drag force and inter-particular friction. Therefore, it could demonstrate a higher ER efficiency and higher yield stress at the same experimental condition. Herein, sea urchin shaped polystyrene/PANI (PS/PANI) particles are also expected to improve both rheological behavior and dispersion stability. In addition, particles with PS core are easy to control the particle size of the final products by adjusting the size of the PS seeds, as well as mechanically stronger than particles with only prickly shape of the PANI.
Recently, PS/PANI particles of the core–shell type have been actively studied. Similarly aniline derivative was also used instead of aniline.29 Some of the studies were carried out under acidic conditions at a low temperature.30–33 By putting HCl, aniline forms a hydrophilic aniline hydrochloride which can be soluble in water. Alternatively, it was synthesized by using sulfonated PS.34–36 By forming a sulfonic acid group to the PS surface through the sulfonation processing, aniline monomer may be more readily adsorbed. In addition the cationic sphere is also used.37,38
In this study, the sea urchin-like PS/PANI particles have been synthesized by a seeded swelling emulsion polymerization process using monodisperse polystyrene microspheres as seeds and oxidant ferric salt without any surface treatment. Compared with previous studies, extra processes of surface modification, temperature control as well as the use of hydrochloric acid are not required. Furthermore the synthesis was carried out with uncomplicated equipment such as a magnetic stir at room temperature. Therefore, process of experiment is simple and facile. Herein the reason for using the PS as a seed is that it has the spherical shape and monodisperse. Aniline monomer was anchored in PS seed owing to π–π* stacking interaction of phenyl group.31 Synthesis of the particle was carried through iron(III) nitrate nonahydrate that results in the formation of urchin-like PANI nanofibers on the exterior surface of PS microspheres. The produced particles were dispersed in silicone oil to prepare an ER fluid and its rheological behavior was examined under an applied electric field.
2. Experimental
2.1. Materials
All the chemicals of styrene, isopropyl alcohol (IPA) (DC Chemical, Korea), polyvinylpyrrolidone (PVP) (Mw = 55![[thin space (1/6-em)]](https://www.rsc.org/images/entities/char_2009.gif) 000 g mol−1, Sigma-Aldrich), aniline (DC Chemical, Korea), azobisisobutyronitrile (AIBN), iron(III) nitrate nonahydrate [Fe(NO3)3·9H2O] (Sigma-Aldrich), and ammonium persulfate [(NH4)2S2O8] (Daejung) were used directly without further purification. Deionized water was used for all the processes.
000 g mol−1, Sigma-Aldrich), aniline (DC Chemical, Korea), azobisisobutyronitrile (AIBN), iron(III) nitrate nonahydrate [Fe(NO3)3·9H2O] (Sigma-Aldrich), and ammonium persulfate [(NH4)2S2O8] (Daejung) were used directly without further purification. Deionized water was used for all the processes.
2.2. Preparation of PS microsphere
At first, 192.6 g of IPA was mixed with 105 g of deionized water, and 1.92 g of PVP was dissolved in this mixed solvent. After an amount of 0.5 g refined AIBN was dissolved in the 31.9 g of styrene separately, it was put in the prepared PVP solution. The styrene in the whole mixture was polymerized at 70 °C for 12 h stirring with 150 rpm. The product was centrifuged with ethanol and deionized water, and finally dried for 24 h.2.3. Preparation of sea urchin-like PS/PANI particles
The sea-urchin like particles were synthesized by a seeded swelling polymerization method. First, 0.3 g of PS microspheres was dispersed in 20 ml H2O, and then 0.56 g of aniline was put into this solution with the PS microspheres. By using magnetic bar, the mixture was stirred for 3 hours at a room temperature. 14.54 g of iron(III) nitrate nonahydrate was then added as an oxidant (molar ratio of aniline:oxidant = 1:6), following a chemical oxidative polymerization of the aniline for 12 h stirring. After the reaction was completed, the by-products were washed with ethanol and deionized water.
2.4. Preparation of PS/PANI particles with a smooth surface
On the other hand, in order to synthesize PS/PANI particles with a smooth surface, a method similar to creating sea urchin-like particles was followed, 0.3 g of PS microspheres was dispersed in 20 ml H2O, and then 0.28 g of aniline was put into this solution. The 0.68 g of APS was added as the oxidant instead, and the molar ratio of aniline and APS was 1:1.
Similarly, at the end of the reaction of 12 hours, it washed with ethanol and de-ionized water.
2.5. Characterization
The morphology of PS/PANI particles was observed by scanning electron microscopy (SEM) (SU8010, Hitachi) and transmission electron microscopy (TEM) (CM200, Philips). The chemical bonds and structures were measured by Fourier transform infrared spectroscopy (FT-IR) (System 2000, Perkin-Elmer). Thermal properties of the particles were studied by thermo gravimetric analysis (TGA) (TA instrument Q50, USA). Measurement of the electrical conductivity was performed by using a standard four-probe method (MCP-T610, Mitsubishi Chemical). Density of the particles was measured by a pycnometer (Gas Displacement Density Analyzer, Accupyc 1330, Micromeritics Instrument Co.). Optical microscopy (OM) (BX-51, Olympus) was used to observe the chain formation of the dispersed particles in silicone oil (10 cSt) when an electric field is applied. The ER properties were measured by using a rotational rheometer (MCR300, Anton Paar) equipped with an external DC high voltage power supply unit (HCP 14-12500, Fug Elektronik) and CC17 geometry. The dielectric properties were carried out using a LCR meter (Precision LCR Meter, 4284A, Agilent Technologies). A Turbiscan (MA2000, Classic) was further used to measure dispersion stability through the transmission of suspension.3. Results and discussion
Scheme 1 shows reaction processes of the sea urchin-like PS/PANI particles. Firstly, monodispersed PS microspheres were dispersed in water. The aniline monomer was added into the above solution and then after a certain period of stirring, the aniline monomer was absorbed into the PS particles due to π–π* stacking interactions of phenyl groups.31,39 | ||
| Scheme 1 Schematic diagram of urchin-like PS/PANI particles. | ||
After iron(III) nitrate nonahydrate was added into the solution, the aniline encountered the oxidant presented in the solution to initiate polymerization at the PS/water interface and the oxidative polymerization of the aniline was carried out. As the reaction proceeds, the swollen PS particles act as monomer sources that release aniline to the external space to keep the diffusion and interfacial polymerization. As a result, it becomes more efficient to form the surface layer.30
In the course of oxidation, the iron(III) ions could oxidize aniline and then were reduced to iron(II) ions. The produced radical ions of aniline react with another monomer to form dimers, oligomers and continuously PANI through stepwise reactions.40 Scheme 2 shows this reaction mechanism. The low oxygen potential of oxidant and the low concentration of aniline monomer inhibit the secondary growth.41 Thereby, the nanofibers were forming on the surface of PS. Finally the sea urchin-like particles were obtained.42 On the contrary, secondary growth from the surface of the fiber occurs very easily in the case of the APS with a high oxidation potential.41,43 Moreover, the APS creates a high density of polymerization centers, so that the particles have a core–shell structure shaped smooth surface.44
 | ||
| Scheme 2 Polymerization of aniline in terms of iron(III) ions. | ||
The morphology of the particles can be observed using both SEM and TEM. Fig. 1 illustrates the SEM images of the PS seeds (Fig. 1(a)) and the urchin-like PS/PANI particles (Fig. 1(b)). Fig. 2 displays TEM images of PS seed (Fig. 2(a)) and the urchin-like PS/PANI particle (Fig. 2(b)). It can be seen to ensure that the smooth surface of the PS microspheres was changed. PS seeds were present in the core, and the outer surface was coated with PANI. PS seed has smooth surface with diameter of 1 μm, whereas the PANI-coated particle has uneven surface with an average diameter of 1.3 μm. Fig. 3 displays SEM and TEM images of the particles with smooth surface using APS as an oxidant. It can be confirmed that the surface became rough compared to pure PS. Moreover, the thickness was about 50 nm, because we reduce the amount of aniline in half compared with sea-urchin like PS/PANI.
 | ||
| Fig. 1 SEM images of (a) polystyrene seed particles and (b) urchin-like PS/PANI particles. | ||
 | ||
| Fig. 2 TEM images of polystyrene seed particle (a), and urchin-like PS/PANI particle (b). | ||
 | ||
| Fig. 3 (a) SEM image and (b) TEM image of PS/PANI particle with smooth surface. | ||
The FT-IR spectra of PS and PS/PANI particles are shown in Fig. 4. Those particles were prepared by KBr pellet procedure. We mixed a dash of solid sample and KBr thoroughly in a mortar. We placed evenly the mixed powder in pellet die and applied a pressure. And it was measured from 400 cm−1 to 4000 cm−1 wave number separately.
 | ||
| Fig. 4 FT-IR spectrum of (a) PS, (b) PANI and (c) urchin-like PS/PANI particles. | ||
The spectra of PS in Fig. 4(a) reveals characteristic peaks including aromatic ![[double bond, length as m-dash]](https://www.rsc.org/images/entities/char_e001.gif) C–H stretching vibrations at 3024 cm−1, alkyl C–H stretching vibrations at 2917 cm−1, aromatic ring stretching vibrations at 1600–1430 cm−1, aromatic C–H out-of-plane deformation vibrations at 757 cm−1, and out-of-plane ring deformation vibration 698 cm−1.45 Fig. 4(b) gives the spectrum of PANI. Its characteristic peaks include the non-symmetric vibration mode of CC in quinoid and benzenoid ring at 1587 cm−1 and 1494 cm−1, C–N stretching vibration of benzenoid ring at 4303 cm−1 and 1145 cm−1, out of C–H plane bending vibration at 829 cm−1.
C–H stretching vibrations at 3024 cm−1, alkyl C–H stretching vibrations at 2917 cm−1, aromatic ring stretching vibrations at 1600–1430 cm−1, aromatic C–H out-of-plane deformation vibrations at 757 cm−1, and out-of-plane ring deformation vibration 698 cm−1.45 Fig. 4(b) gives the spectrum of PANI. Its characteristic peaks include the non-symmetric vibration mode of CC in quinoid and benzenoid ring at 1587 cm−1 and 1494 cm−1, C–N stretching vibration of benzenoid ring at 4303 cm−1 and 1145 cm−1, out of C–H plane bending vibration at 829 cm−1.
Fig. 5 shows thermal decomposition characteristics of the PS seed and urchin-like PS/PANI particles, exhibiting the weight loss percentage vs. temperature. Thermal analysis proceeded under an air condition in the range of 30 °C–800 °C. Pure PS seed shows a weight loss starts at around 300 °C. Pure PANI was decomposed little by little at the initial stage, and the degradation curve was sharply declined right above 350 °C. In the case of PS/PANI, a two-step thermal degradation procedure can be observed. The first weight loss was observed at approximately 300 °C, followed the second loss around 360 °C. The former means the decomposition of the PS, and the latter refers to the decomposition of PANI. From 300 °C to 350 °C, about 35% of weight loss represented the degradation of PS and the other part is due to the PANI. In this case, a complete decomposition temperature of PS is lower than that of pure PS, because the thermal conductivity of PANI might accelerate the decomposition of PS.31
 | ||
| Fig. 5 TGA analysis of PS, PANI and urchin-like PS/PANI particles. | ||
The electric conductivity of urchin-like PS/PANI particles was measured to be 1.13 × 10⁻² S cm−1 by the four-probe method. If the conductivity of the material is too high, the short circuit occurs when an electric current is applied for the ER fluid. Thus, it needs to be controlled in a semi-conducting regime through a dedoping process using a base. The pH value was set to be 10 by adding 1 M of NaOH. After the dedoping process, the conductivity of particles was altered to 2.34 × 10⁻¹¹ S cm−1, which is appropriate for its ER application.
On the other hand, Fig. 6 exhibits the movement of dispersed PS/PANI particles under an applied electric field condition, in which the ER fluid was prepared by dispersing the particles in 10 cSt silicone oil. Without an electric field applied, the particles were distributed randomly. However, particles became connected each other, forming a chain arrangement under an applied electric field. From this direct observation of the chain formation, the dedoped urchin-like PS/PANI particles are considered to be used as the ER material.
 | ||
| Fig. 6 Optical microscope images of urchin-like PS/PANI particles (a) without an electric field and (b) with an electric field (500 V). | ||
Rheological measurement for the flow curves of PS/PANI based ER fluid was performed via a controlled shear rate (CSR) mode within a range of electric fields. Fig. 7(a) is a shear viscosity graph as a function of shear rate. In the absence of an electric field, it indicated the nature like a fluid. Under electric fields, while the ER fluid posses much higher shear viscosities, it showed noticeable reduction of the shear viscosity as the increase of shear rate, i.e. the shear thinning behavior. Also, this behavior becomes significant as the strength of the electric field increases. In addition, from Fig. 7(b) of a relationship between the shear stress and the shear rate, without an electric field, the shear stress was increased linearly according to the shear rate like a Newtonian fluid. On the other hand, because the particles build up the chain-like structure by applying an electric field, the yield stress was developed and the ER fluid showed a solid-like state, corresponding to the high viscosity at low shear rates. When the strength of the electric field gradually increased, the value of the yield stress also increased, in a way that the interaction between PS/PANI particles becomes stronger.
 | ||
| Fig. 7 (a) Shear stress and (b) shear viscosity versus shear rate of urchin-like PS/PANI particle based ER fluid (10 vol%). The dashed and solid lines in (b) indicate the fitting with Bingham and CCJ model, respectively. | ||
Generally in order to analyze flow curves of the ER fluids, the Bingham model has been widely used as the simplest rheological equation of the state for many ER suspensions as given in eqn (1);
 | (1) |
Nonetheless, for various ER fluids the shear stress has been observed to show a minimum value at a certain shear rate. There might be insufficient time for the particles to realign along the electric field direction. In other words, as the shear rate increases, the destruction rate of the fibrils becomes faster than the reformation rate. And then while the rate of forming the chain structures is faster than the rate of destruction, the particles of broken chain cannot be recombined due to the predominant hydrodynamic force at the higher shear rate. Thereby the shear stress is increased again. Cho–Choi–Jhon (CCJ) model is reported to fit the complicated flow curve well. It can represent the phenomenon of shear stress is reduced at low shear rate region, shown by the following equation.
 | (2) |
The above equation is composed of the six physical parameters with their meaning as follows: τ0 is the dynamic yield stress that can be obtained from the extrapolation process, α represents the phenomenon that shear stress is reduced in a low shear rate region, t2 and t3 are the time constants. The shear viscosity at high shear rate, η∞, is construed as the viscosity in an absence of electric field. As a result, the CCJ model is more appropriate than Bingham model for the urchin-like PS/PANI ER fluid in this study (Table 1).
| Model | Parameters | Electric field strength (kV mm−1) | ||||
|---|---|---|---|---|---|---|
| 0.5 | 1 | 1.5 | 2 | 2.5 | ||
| Bingham | τ0 | 10 | 20 | 37 | 64 | 90 |
| η0 | 0.025 | 0.019 | 0.025 | 0.022 | 0.022 | |
| CCJ | τ0 | 10 | 20 | 42 | 73 | 102 |
| t2 | 0.0004 | 0.003 | 0.01 | 0.05 | 0.4 | |
| α | 0.5 | 0.75 | 0.35 | 0.4 | 0.4 | |
| η∞ | 0.03 | 0.04 | 0.048 | 0.05 | 0.058 | |
| t3 | 0.2 | 0.1 | 0.1 | 0.008 | 0.002 | |
| β | 0.9 | 0.9 | 0.9 | 0.99 | 0.98 | |
On the other as for dynamic analysis, initially, strain amplitude sweep test was executed at fixed frequency (6.283 rad s−1) in order to determine the linear viscoelastic (LVE) region before the frequency sweep test. Deformation of the sample does not occur in the LVE region.
Fig. 8 shows a storage modulus (G′) and loss modulus (G′′) as a function of strain respectively. Initially, the storage modulus (G′) has higher value than the loss modulus (G′′) and maintains a plateau called LVE region. As the strain increases, the G′′ becomes higher than G′ and both of two modulus decrease steeply, meaning that the elasticity is no longer dominant and destruction of the structure occurs. As the intensity of the electric field becomes stronger, the plateau region is widened because the solid-like property of the ER fluid is enhanced. In this test, 5 × 10⁻⁵ was selected to representative value of γLVE for frequency sweep.
 | ||
| Fig. 8 Strain amplitude sweep of urchin-like PS/PANI particle based ER fluid (10 vol%) with open symbol for storage modulus and closed symbol for loss modulus. | ||
Using the data obtained in the amplitude sweep test, the elastic stress by the plot according to the strain for elucidating the structure breakdown46 is shown in Fig. 9. The y-axis is a value acquired by multiplying the storage modulus and strain, τ′ = G′γ, and maximum value was estimated as the elastic yield stress.47 From this graphical analysis, it was able to calculate the value of the elastic yield stress corresponding to each of the electric field intensity. As the electric field strength increases, the values of the elastic yield stress grow gradually.
 | ||
| Fig. 9 Elastic stress of urchin-like PS/PANI particles plotted as a function of strain amplitude. | ||
In addition, it is possible to analyze both the dynamic yield stress obtained from the flow curve and the elastic yield stress on the applied electric field, in which the dynamic yield stress is the extrapolated value of the shear stress at shear rate approaches zero from the flow curve data. Fig. 10 shows each of yield stress values according to the electric field strength respectively. In general, the relationship between the yield stress and the electric field can be represented by the following equation.
| τy ∝ Em | (3) |
 | ||
| Fig. 10 Dynamic yield stress and elastic yield stress as a function of electric field strength for the urchin-like PS/PANI based ER fluid. | ||
The exponent, m, can be related to the two well established models of conduction and polarization models with its value of 1.5 and 2.0, respectively.48,49 The polarization model considers the ER effect coming from the polarization of particles in non conducting fluid, while the ER effect of conduction model is influenced by discordance between the conductivity of the particles and medium.50
The exponent value m, slope of both lines of urchin-like PS/PANI particle based ER fluid is observed to be 1.5, indicating its mechanism of the conduction model. Note that it has been reported that granular PANI or nano-fibrous PANI based ER fluids have m values varying from 1.2 to 1.9, depending on the shape and concentration of the particles.14
Fig. 11 expresses the G′ and G′′ as a function of angular frequency at the fixed strain (5 × 10⁻⁵) in the LVE region. Angular range for measurement is 1–100 rad s−1. All over the region G′ exhibit a plateau behavior substantially and the sample behave like a solid in LVE region due to the formation of particle chain structure and G′′ is always lower than G′, therefore the solid-like character can also be confirmed. Moreover both of them show a tendency to increase gradually in accordance with an electric field owing to the interparticle force.
| G(t) ≅ G′(ω) − 0.560G′′(ω/2) + 0.200G′′(ω) | (4) |
 | ||
| Fig. 11 Frequency sweep of urchin-like PS/PANI particle based ER fluid (10 vol%) with open symbol for storage modulus and closed symbol for loss modulus. | ||
On the other hand, the solid-like properties of the suspension can be confirmed through the stress relaxation behavior. Both storage modulus and loss modulus derived from the frequency sweep test could be substituted into the Schwarzl equation51 as given in eqn (4). It allows to determine the relaxation modulus as function of the time, G(t), shown in Fig. 12.
 | ||
| Fig. 12 Relaxation modulus G(t) of urchin-like PS/PANI particle-based ER fluid as calculated from storage modulus and loss modulus. | ||
By using the above equation, it is possible to predict the behavior which is difficult to measure experimentally for the intrinsic property of the materials and mechanical limitations.52 Furthermore we can study the phase change through this graph. The G(t) is depending on the time under an electric field and the value of the modulus increases as the higher electric field is applied, indicating that the strong interaction exists between the particles and the ER fluid represents a solid-state property.
The dielectric spectra were measured so as to better analyze the ER characteristics, because the ER effect comes from the interaction between flow field and the polarization that has been derived from the electric field. Therefore, we measured the dielectric spectra of ER fluid using a LCR meter in a frequency ranging from 20 Hz to 1 MHz. Fig. 13 represents the dielectric spectra as a function of frequency, with the lines obtained by fitting using a Cole–Cole plot (or complex plane plot). This formula of eqn (5) describes the relationship between the permittivity of materials and the ER effect.
 | (5) |
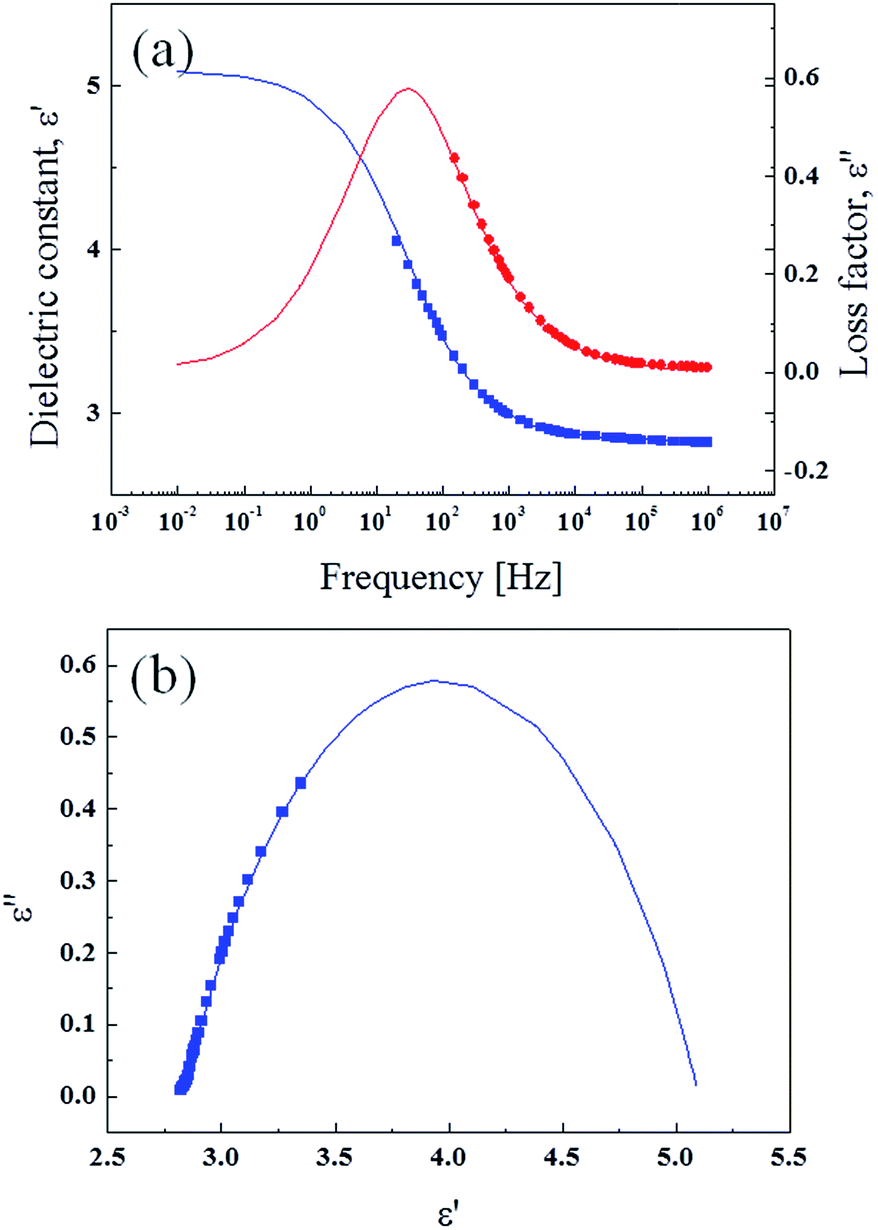 | ||
| Fig. 13 (a) Dielectric spectra (dielectric constant, ε′: blue square; loss factor, ε′′: red circle) and (b) Cole–Cole fitting curve of the urchin-like PS/PANI based ER fluid (10 vol%). | ||
The values of each parameter of the urchin-like PS/PANI based ER fluid through the fitting are shown in Table 2.
| ε0 | ε∞ | Δε | α | λ |
|---|---|---|---|---|
| 5.1 | 2.83 | 2.27 | 0.4 | 0.0057 |
Dispersion stability is one of the important factors in rheological activity of the ER suspensions. Thus, the sedimentation ratio as a function of time indicating the dispersion stability was investigated using Turbiscan. Both PS/PANI particles having a smooth surface and sea urchin-like were dispersed in 10 cSt silicone oil, separately, and their transmission was measured as a function of time. As shown in Fig. 14, sea urchin-like PS/PANI suspension represented a slower sedimentation rate than the particles having a smooth surface. In other words, it has a better dispersion stability. Note that the densities of the smooth surface particles and the urchin-like particles were measured to be 1.31 g cm−3 and 1.29 g cm−3, respectively. Considering that the size and density of the two substances are similar, this result was due to the larger drag force and interparticle fiction from larger surface area of sea urchin-like morphology.55,56
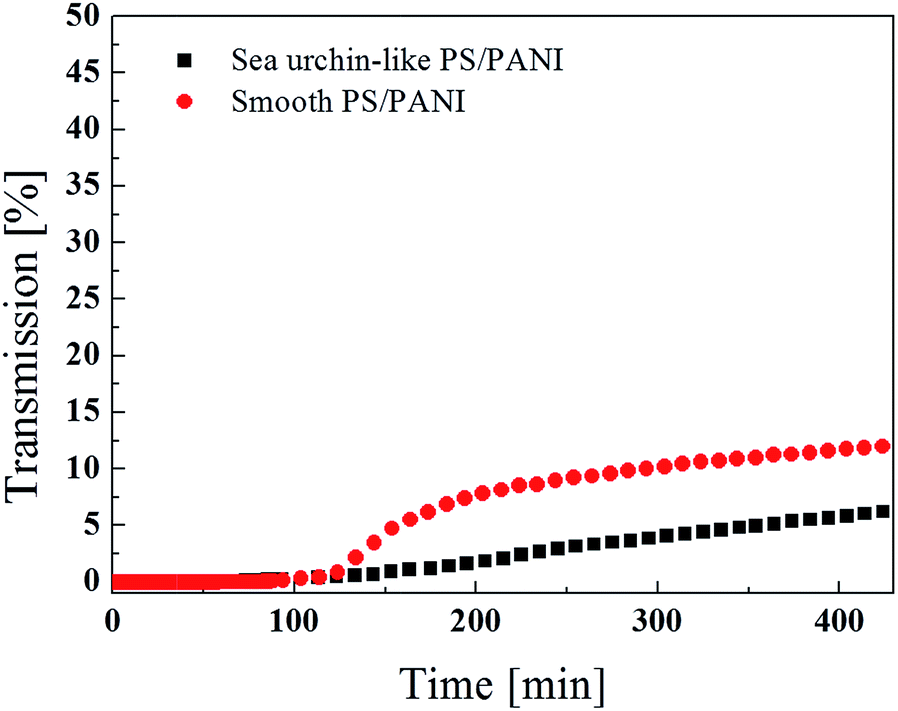 | ||
| Fig. 14 Transmission versus time for PS/PANI suspensions having both smooth surface and sea urchin-like morphology. | ||
4. Conclusion
Urchin-like PS/PANI particles were synthesized by seeded swelling polymerization with PS seeds and Fe(NO3)3 as an oxidant. Low oxygen potential of oxidant and the low concentration of aniline monomer make the surface of the nanofiber form. Moreover, this synthesis method is facile because it does not require the surface treatment as well as the polymerization is being carried out under the mild condition of no usage of an acid, room temperature reaction, and simple experiment tool. Morphology as well as the size of the sea urchin-like particles were observed with TEM and SEM, while FT-IR spectra and TGA confirmed the synthetic results. The ER properties measured by a rotational rheometer were fitted well with the CCJ model, following the conduction model with the slope of 1.5. The dielectric data was further analyzed by LCR, being fitted well using the Cole–Cole plot. In addition it was confirmed that the sea urchin-like PS/PANI has better dispersion stability than the smooth particles.Acknowledgements
This work was supported by a research grant from National Research Foundation, Korea (NRF-2013R1A1A2057955).Notes and references
- T. Plachy, M. Sedlacik, V. Pavlinek, Z. Moravkova, M. Hajna and J. Stejskal, Carbon, 2013, 63, 187 CrossRef CAS PubMed.
- J. Jiang, Y. Tian and Y. Meng, Langmuir, 2011, 27, 5814 CrossRef CAS PubMed.
- B. Wang, M. Zhou, Z. Rozynek and J. O. Fossum, J. Mater. Chem., 2009, 19, 1816 RSC.
- B. Wang, X. Tian, X. Song, L. Ma, S. Yu, C. Hao, K. Chen and Q. Lei, Colloids Surf., A, 2014, 461, 184 CrossRef CAS PubMed.
- H. Yilmaz, H. Zengin and H. I. Unal, J. Mater. Sci., 2012, 47, 5276 CrossRef CAS.
- X. H. Liu, J. J. Guo, Y. C. Cheng, G. J. Xu, Y. Li and P. Cui, Rheol. Acta, 2010, 49, 837 CrossRef CAS.
- K. Makihara, J. Onoda and K. Minesugi, Trans. Jpn. Soc. Aeronaut. Space Sci., 2007, 49, 203 CrossRef.
- H. Bose, M. Baumann, G. J. Monkman, S. Egersdorfer, A. Tunayar, H. Freimuth, H. Ermert and W. Khaled, Int. J. Mod. Phys. B, 2005, 19, 1628 CrossRef.
- L. Y. Liu, X. X. Huang, C. Shen, Z. Y. Liu, J. Shi, W. J. Wen and P. Sheng, Appl. Phys. Lett., 2005, 87, 104106 CrossRef PubMed.
- K. Prekas, T. Shah, N. Soin, M. Rangoussi, S. Vassiliadis and E. Siores, J. Colloid Interface Sci., 2013, 401, 58 CrossRef CAS PubMed.
- M. Mrlik, V. Pavlinek, P. Saha and O. Quadrat, Appl. Rheol., 2011, 21, 52365 Search PubMed.
- Y. Tian, M. Zhang, X. Zhu, J. Jiang, Y. Meng and S. Wen, Smart Mater. Struct., 2009, 18, 125021 CrossRef.
- Q. L. Cheng, Y. He, V. Pavlinek, A. Lengalova, C. Z. Li and P. Saha, J. Mater. Sci., 2006, 41, 5047 CrossRef CAS.
- J. B. Yin, X. P. Zhao, X. Xia, L. Q. Xiang and Y. P. Qiao, Polymer, 2008, 49, 4413 CrossRef CAS PubMed.
- S. Bhadra and D. Khastgir, J. Appl. Polym. Sci., 2009, 114, 238 CrossRef CAS PubMed.
- M. S. Cho, Y. H. Cho, H. J. Choi and M. S. Jhon, Langmuir, 2003, 19, 5875 CrossRef CAS.
- W. L. Zhang, Y. D. Liu and H. J. Choi, Carbon, 2012, 50, 290 CrossRef PubMed.
- M. X. Wan and J. H. Fan, J. Polym. Sci., Part A: Polym. Chem., 1998, 36, 2749 CrossRef CAS.
- H. D. Tran, J. M. D'Arcy, Y. Wang, P. J. Beltramo, V. A. Strong and R. B. Kaner, J. Mater. Chem., 2011, 21, 3534 RSC.
- G. C. Li, L. Jiang and H. R. Peng, Macromolecules, 2007, 40, 7890 CrossRef CAS.
- J. Stejskal, I. Sapurina, M. Trchova, E. N. Konyushenko and P. Holler, Polymer, 2006, 47, 8253 CrossRef CAS PubMed.
- Z. X. Wei, Z. M. Zhang and M. X. Wan, Langmuir, 2002, 18, 917 CrossRef CAS.
- L. Tan, L. J. Cao, M. Yang, G. Wang and D. B. Sun, Polymer, 2011, 52, 4770 CrossRef CAS PubMed.
- S. Goswami, T. Brehm, S. Filonovich and M. T. Cidade, Smart Mater. Struct., 2014, 23, 105012 CrossRef.
- J. B. Yin, X. P. Zhao, L. Q. Xiang, X. Xia and Z. S. Zhang, Soft Matter, 2009, 5, 4687 RSC.
- Q. L. Cheng, V. Pavlinek, Y. He, Y. F. Yan, C. Z. Li and P. Saha, Colloid Polym. Sci., 2011, 289, 799 CAS.
- M. J. Kim, Y. D. Liu and H. J. Choi, Chem. Eng. J., 2014, 235, 186 CrossRef CAS PubMed.
- M. Machovsky, M. Mrlik, I. Kuritka, V. Pavlinek and V. Babayan, RSC Adv., 2014, 4, 996 RSC.
- S. H. Kwon, Y. D. Liu and H. J. Choi, J. Colloid Interface Sci., 2015, 440, 9 CrossRef CAS PubMed.
- Y. X. Li, Z. Q. Wang, C. J. Wang, Z. Zhao and G. Xue, Polymer, 2011, 52, 409 CrossRef CAS PubMed.
- Y. D. Liu, B. J. Park, Y. H. Kim and H. J. Choi, J. Mater. Chem., 2011, 21, 17396 RSC.
- Q. Wu, Z. Q. Wang and G. Xue, Adv. Funct. Mater., 2007, 17, 1784 CrossRef CAS PubMed.
- Y. X. Li, Z. Q. Wang, Q. Wang, C. J. Wang and G. Xue, Macromolecules, 2010, 43, 4468 CrossRef CAS.
- X. C. Wang, J. Liu, X. F. Feng, M. J. Guo and D. L. Sun, Mater. Chem. Phys., 2008, 112, 319 CrossRef CAS PubMed.
- X. Y. Dai, X. Zhang, Y. F. Meng and P. K. Shen, New Carbon Mater., 2011, 26, 389 CrossRef CAS.
- X. C. Wang, S. Tang, J. Liu, Z. Q. He, L. J. An, C. X. Zhang, J. M. Hao and W. Feng, J. Nanopart. Res., 2009, 11, 923 CrossRef CAS.
- L. Y. Wang, Y. J. Lin and W. Y. Chiu, Synth. Met., 2001, 119, 155 CrossRef CAS.
- K. L. Ding, Z. J. Miao, Z. M. Liu, G. M. An, Y. Xie, R. T. Tao and B. X. Han, J. Mater. Chem., 2008, 18, 5406 RSC.
- Y. X. Li, Z. Huang, Y. Wu, C. Yang, Y. Gao and Z. Q. Wang, Colloids Surf., A, 2012, 407, 71 CrossRef CAS PubMed.
- H. Yan, M. Kajita and N. Toshima, Macromol. Mater. Eng., 2002, 287, 503 CrossRef CAS.
- J. X. Huang and R. B. Kaner, Angew. Chem., Int. Ed., 2004, 43, 5817 CrossRef CAS PubMed.
- G. D. Nestorovic, K. B. Jeremic and S. M. Jovanovic, J. Serb. Chem. Soc., 2006, 71, 895 CrossRef CAS.
- N. R. Chiou and A. J. Epstein, Adv. Mater., 2005, 17, 1679 CrossRef CAS PubMed.
- M. Yang, L. J. Cao and L. Tan, Colloids Surf., A, 2014, 441, 678 CrossRef CAS PubMed.
- L. Li, R. Z. Ma, N. Iyi, Y. Ebina, K. Takada and T. Sasaki, Chem. Commun., 2006, 3125 RSC.
- M. C. Yang, L. E. Scriven and C. W. Macosko, J. Rheol., 1986, 30, 1015 CrossRef CAS.
- X. D. Pan and G. H. McKinley, Appl. Phys. Lett., 1997, 71, 333 CrossRef CAS PubMed.
- P. Atten, J. N. Foulc and N. Felici, Int. J. Mod. Phys. B, 1994, 8, 2731 CrossRef CAS.
- C. H. Hong, H. J. Choi and Y. Seo, Synth. Met., 2008, 158, 72 CrossRef CAS PubMed.
- C. W. Wu and H. Conrad, J. Phys. D: Appl. Phys., 1996, 29, 3147 CrossRef CAS.
- F. R. Schwarzl, Rheol. Acta, 1975, 14, 581 CrossRef.
- M. J. Hato, K. Zhang, S. S. Ray and H. J. Choi, Colloid Polym. Sci., 2011, 289, 1119 CAS.
- W. Kuang and S. O. Nelson, J. Microwave Power, 1997, 32, 114 Search PubMed.
- S. H. Kim, J. H. Kim, H. J. Choi and J. Park, RSC Adv., 2015, 5, 72387 RSC.
- M. Machovsky, M. Mrlik, I. Kuritka, V. Pavlinek and V. Babayan, RSC Adv., 2014, 4, 996 RSC.
- Z. B. Wang, X. F. Song, B. X. Wang, X. L. Tian, C. C. Hao and K. Z. Chen, Chem. Eng. J., 2014, 256, 268 CrossRef CAS PubMed.
| This journal is © The Royal Society of Chemistry 2015 |