Investigation of fate and behavior of tetracycline in nitrifying sludge system

Chao Song, Xue-Fei Sun, Peng-Fei Xia, Yun-Kun Wang and Shu-Guang Wang*
Shandong Key Laboratory of Water Pollution Control and Resource Reuse, School of Environmental Science and Engineering, Shandong University, Jinan 250100, China. E-mail: wsg@sdu.edu.cn; Fax: +86 531 88364513; Tel: +86 531 88365919

Received 7th August 2015 , Accepted 7th October 2015

First published on 8th October 2015


Abstract

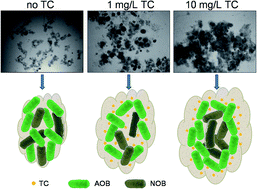
This study aims to investigate the fate and behavior of tetracycline (TC) in nitrifying sludge system, as well as the effects of TC dosage on sludge performance. For this purpose, two TC spiked and two control laboratory reactors were operated for two months, while the spiked reactors (designated as RI and RII) were intermittently fed with TC at the concentrations of 10 and 1 mg L−1, respectively. TC could be effectively removed via initial adsorption and subsequent biodegradation, while biodegradation was the primary mechanism in this study. Compared to RII, no significant negative effects were found on dehydrogenase activity under higher TC stress in RI. It is interesting that RI showed better nitrification performance than RII, especially higher nitrite oxidation capacity. Moreover, exposure to TC also promoted the formation of aggregation and affected the composition of nitrifying bacteria. The relative contents of nitrite-oxidizing bacteria (NOB) in RII decreased by almost 50%, from 11.4 ± 3.2% to 6.5 ± 2.5% while there was a slight change in RI, from 11.9 ± 5.8% to 11.2 ± 3.8%. Furthermore, the mean sludge diameter increased from 218.3 ± 7.8 μm to 512.4 ± 7.8 μm and 353.8 ± 11.1 μm in RI and RII, respectively. This indicated that larger aggregations were discovered in reactors with high TC stress. The aggregation might lead to a multilayer structure of sludge to protect the microorganism inside, which would explain the higher relative abundance of NOB in reactors with high TC stress. This work expands our vision about the fate and behavior of antibiotics in activated sludge system, which has far-reaching implications in activated sludge processes.

1. Introduction

Tetracycline (TC), a type of broad-spectrum antimicrobial active compound, is widely used in modern agriculture and livestock industries as a growth promoter and to improve feed efficiency.1,2 However, most tetracycline, about 50–80%, is excreted through urine and feces without metabolism and released into the environment.3,4 According to recent research, residues of TC have been detected in sewage effluents, surface water and drinking water.5,6 The presence of tetracycline antibiotics in the environment could promote the transfer and spread of antibiotic resistance genes among microorganisms, which have a potential risk to public health.7–9 Therefore, the elimination of tetracycline antibiotics from water resources is an important research subject.

The activated sludge technology is the most common process for the secondary treatment of wastewater. It has been reported that tetracycline antibiotics could be removed by activated sludge with the efficiencies of 11.6% to 85.4%.10,11 Nevertheless, most of TC removed via conventional activated sludge is through adsorption with little biodegradation. Li and Zhang systematically examined the elimination of TC by two types of activated sludge treating freshwater sewage and saline sewage, respectively, and found that adsorption was the primary mechanism for TC removal in activated sludge systems while biodegradation can be completely ignored.12 Besides, it has been reported that only 61.0 ± 2% of tetracycline was removed in anaerobic–anoxic–oxic process, while the biodegradation contributed only about 21.4% to the total removal of tetracycline.13 Compared with conventional activated sludge, activated sludge with excellent nitrification performance could enhance the biodegradation of pharmaceutically active trace organic contaminants like antibiotics for the long sludge retention time.14 Khunjar et al. discovered that 17α-ethinylestradiol, a potent endocrine disruptor, could be degraded by nitrifying activated sludge.15 Moreover, Fernandez-Fontaina et al. obtained high biodegradation efficiencies of 11 target antibiotics with nitrifying sludge.16 In addition, nitrifying bacteria have been reported to exhibit a high tolerance to TC.17 Hence, nitrifying sludge process might be a potentially promising technology for TC wastewater treatment for the long sludge retention time and high tolerance. However, little information existing in the literature covers systematical evaluation of the fate and behavior of TC in nitrifying sludge process.

The main objectives of this work are to evaluate the biodegradation treatability of TC by nitrifying sludge and to investigate the fate and behavior of TC in nitrifying sludge system at lab-scale. Long-term operated reactors with different TC concentration were designed to study the elimination and fate of TC. Moreover, the morphology and nitrification properties of nitrifying sludge were evaluated to explore the macroscopic effect of TC on sludge. And, fluorescent in situ hybridization (FISH) were executed to assess the evolution of nitrifying populations.

2. Materials and methods

2.1 Nitrifying sludge and reactor operation

Nitrifying sludge was collected from a sequencing batch reactor (SBR) fed with synthetic wastewater. The operational schedule of SBR was described in previous work.18 In the experiments, two 1.5 L reactors (designated as RI and RII) with 1 L of mixed liquor were covered with tin foil paper to prevent photolytic degradation of TC, and run simultaneously at room temperature around 25 °C. The initial mixed liquid suspended solids concentrations (MLSS) were 606.7 and 626.7 mg L−1 for RI and RII, respectively. The reactors were operated sequentially in successive cycles of 72 h for the slow growth of nitrifying bacteria.19 Each cycle consisted of 20 min influent feeding, 71 h with stirring (90 rpm), 30 min settling and 10 min effluent withdrawal. The volumetric exchange ratio was 50% and a small amount of sludge was discharged in each cycle to maintain MLSS stability. The dissolved oxygen concentration was measured with a dissolved oxygen meter (YSI Model 85, USA) and remained above 5.0 mg L−1 during the operation.

The reactors were fed with synthetic solution (NH4+–N, 50 mg L−1; NaHCO3, 2000 mg L−1 and other trace elements solution described by Fernandez-Fontaina et al.;16 pH = 7.2–7.6). At the beginning of each cycle, TC was added at initial concentrations of 10 mg L−1 in RI and 1 mg L−1 in RII, which was a range of concentrations within the higher level of this antibiotic in wastewater.20

2.2 Blank experiment and abiotic control experiment

In the blank experiment, two other reactors with only 10 mg L−1 and 1 mg L−1 TC added were run with stirring at 90 rpm for 72 h in dark at room temperature. The elimination of TC was only accounted by hydrolysis and volatilization.

In abiotic control experiment, nitrifying sludge samples were put into two 1.5 L reactors with a total volume of 1 L. The MLSS were adjusted about 600 mg L−1. Sodium azide was added (3 g L−1) in both reactors to inhibit microbial activity of the sludge.21 The reactors were run for three cycles under the same operating conditions of RI and RII, with the addition of 10 mg L−1 and 1 mg L−1 TC at the beginning of each cycle, respectively. The aqueous samples were taken over 220 h for TC analysis by HPLC.

2.3 Analytical methods

The content of TC was determined by high performance liquid chromatography (HPLC, Shimadzu, LC-20AT) with a UV detector using a 5 μm × 4 mm × 250 mm ODS-C18 column. The mobile phase was a mixture of 0.01 M oxalic acid solution/acetonitrile/methanol 80[thin space (1/6-em)]:[thin space (1/6-em)]16[thin space (1/6-em)]:[thin space (1/6-em)]4 (v/v/v). Isocratic elution was performed with a wavelength of 360 nm at a flow rate of 1 mL min−1. Standard calibration showed good linearity (R2 > 0.999) between the concentrations of TC and the peak area response. NH4+–N, NO2–N, NO3–N and MLSS were analyzed according to the standard methods.22 The morphology of nitrifying sludge was observed by an Olympus DP72 microscope with a digital camera. The particle size was measured using a laser particle size analysis system (Mastersizer 2000, Malvern Instruments, UK).

2.4 Analysis of TC in the liquid and solid phases

For aqueous content analysis, about 0.5 mL samples were taken from the two reactors and filtered through a 0.22 μm nylon membrane and stored at −20 °C until analysis by HPLC. The concentration of TC in the solid phase was analyzed by a modified method.23 A slurry sample of 10 mL was centrifuged at 3000 rpm for 10 min, and the solid residual was washed twice with 10 mL normal saline solution (0.9% NaCl solution). Then, the sludge was re-suspended with normal saline solution and treated with ultrasonic cell disruption system for 10 min, followed by centrifugation at 8000 rpm for 10 min. Finally, the supernatant was collected into a volumetric flask and diluted to 50 mL. The diluted solution was analyzed by HPLC to detect the TC concentration in solid phase. The TC recovery was 97.3 ± 2.6%.

The removal of TC by adsorption and biodegradation was calculated with a modified mass balance methods described previously.16

 
Residue = Cw,t/(Cw,0 + Cs,0) (1)
 
Sorption = Cs,t/(Cw,0 + Cs,0) (2)
 
Biodegradation = 1 − sorption − residue (3)
where Cw,0 and Cs,0 are the concentrations of TC in liquid and solid phase at 0 h in a cycle, respectively. Cw,t and Cs,t are the concentrations of TC in liquid and solid phase at t h, respectively.

2.5 Assay of dehydrogenase activity in sludge

Dehydrogenase activity (DHA) was determined following the method described by Yang et al. by the reduction of 2,3,5-triphenyl tetrazolium chloride (TTC).24 Samples from two reactors were treated with ultrasonic cell disruption system for 10 min and transferred to 50 mL centrifuge tubes which contained 5 mL Tris–HCl buffer (pH = 8.4), 2.5 mL 0.36% Na2SO3 solution and 5 mL 0.4% TTC aqueous solution. Then, the tubes were incubated in a thermostatic water bath oscillator at 37 ± 1 °C for 1 h. After incubation, 2.5 mL of formaldehyde was added to stop the reaction and the triphenyl formazan (TPF) formed was extracted with 10 mL acetone at 37 ± 1 °C for 30 min in the dark. After that, the mixture was centrifuged at 3500 rpm for 10 min and the absorbance of supernatant was measured at 485 nm. The data was expressed as mg TPF g−1 SS h−1.

2.6 Fluorescent in situ hybridization (FISH) analyses

FISH analysis was conducted to assess the evolution of nitrifying populations in the two reactors. Samples were collected from RI and RII at the 1st and 60th day. The biomass was fixed with 4% paraformaldehyde solution for 3 h at 4 °C. After fixation, samples were centrifuged at 12[thin space (1/6-em)]000 rpm for 5 min, washed twice in 1 × phosphate buffer saline (PBS), and re-suspended in ethanol/PBS solution (1[thin space (1/6-em)]:[thin space (1/6-em)]1) for storage at −20 °C. Hybridization was conducted according to an established method.25 The rRNA-targeted oligonucleotide probes used in this study were Cy3-labeled EUB338 for most bacteria,26 FITC-labeled Nso190 for nitrite-oxidizing bacteria (NOB),27 Cy3-labeled Ntspa662 and Cy3-labeled Nit3 for ammonium-oxidizing bacteria (AOB).28 Samples were hybridized with three probes-pairs individually: EUB338 and Nso190, Ntspa662 and Nso190, as well as Nit3 and Nso190. The image acquisition was performed by a fluorescence microscope (OLYMPUS DP72) and the images were analyzed by Image-Pro Plus 6.0. For each sample, at least 10 different fields were randomly examined in order to ensure data reliability.

3. Results and discussion

3.1 Nitrification performance in reactors

In order to study the nitrifying activity in both reactors, typical cyclic tests were designed to investigate the nitrification performance of nitrifying sludge. The typical patterns of nitrogen composition were shown in Fig. 1. In RI, NH4+–N was removed completely after 25 h, while NO3–N maintained a low level with slight increase. The concentration of NO2–N increased rapidly at the initial 20 h and then decreased quickly to very low level. In RII, the removal of NH4+–N was much slower than that in RI and still remained 3.8 mg L−1 at the end of cycle. NO3–N concentration remained almost unchanged, while NO2–N was gradually produced and accumulated. In abiotic control experiment, nitrification performance was also investigated in presence of sodium azide. In abiotic control experiment, the concentration of NH4+–N, NO2–N, NO3–N remained almost constant during 72 h, implying that nitrifying sludge had no effects on nitrification when sodium azide was added. These results also suggested that the changes of nitrogen composition in RI and RII (shown in Fig. 1a and b) resulted from biological activity in nitrifying sludge.
image file: c5ra15813c-f1.tif
Fig. 1 Changing patterns of nitrogen composition in RI (a), RII (b) and abiotic control reactors ((c) – 10 mg L−1 TC, (d) – 1 mg L−1 TC).

Biological nitrification is a two-step reaction as follows, AOB transform NH4+–N to NO2–N, and NOB further oxidize NO2–N to NO3–N.29 Nitrogen removal efficiency would be reduced if any of these two steps was inhibited.30 In this study, RI and RII displayed high removal ability of ammonia and AOB was more active in RI than RII. Moreover, the activity of NOB in RII was also much lower than that in RI, which led to the nitrite accumulation in RII. Obviously, the presence of TC inhibited the nitrification process in RII. Katipoglu-Yazan et al. evaluated the acute impact of TC on nitrifying mixed microbial culture and came to the conclusion that TC inhibited and retarded nitrification kinetics and nitrite oxidation, resulting in nitrite accumulation.17 Moreover, it is notable that TC had an evident toxic effect on both AOB and NOB, but much stronger on NOB, implying that NOB was more sensitive to hostile environment.31–33 Compared with the two reactors, the differences suggested that nitrifying sludge system with higher TC concentration exhibited better nitrification performance than that with lower TC concentration in this study, which was contrary to other research.6,34 It might be caused by the changes of microbial activity and sludge structure under TC stress.

3.2 Removal of TC in the nitrifying sludge system

According to the blank experiment profiles (Fig. S1), the concentration of TC remained almost constant during 72 h, indicating the elimination due to hydrolysis and volatilization of TC were so slight to be negligible. Thus, the removal of TC was mainly due to biological degradation and adsorption in this study. The removal of TC in the nitrifying sludge system was also investigated. As shown in Fig. 2, high TC removal capacity was obtained in both reactors. Within the first cycle, the TC concentration in RI and RII decreased rapidly to mass fractions (relative to the initial amount in both reactors) of 22.4% and 6.8%, respectively. After that, the removal profiles of TC showed similar trend in the rest cycle (from the second cycle to the tenth cycle). The TC removal efficiency in RI was maintained at 42.6 ± 6.7% at the end of the rest cycles, while that in RII sustained at 75.5 ± 7.3%. Fig. 2c and d showed that adsorption mainly happened in the first cycle, and then the concentration of TC remained almost constant (Fig. 2c) or had a slight changes (Fig. 2d) during the next two cycles. Moreover, the declines of TC in the first cycle of RI and RII were almost the same with those in abiotic control reactors with similar removal efficiency. These results suggested that adsorption might be the primary mechanism for tetracycline removal in RI and RII while degradation can be ignored in the first cycle. Similar conclusions were also obtained in other studies.23,32 However, the TC concentration in control experiment remained almost constant during the next two cycles (Fig 2c and d), implying that the adsorption of TC by nitrifying sludge could reach equilibrium after the first cycle. Thus, we assumed that the removal of TC in the rest test could be mainly attributed to biodegradation. The adsorption and desorption of TC by nitrifying sludge might lead to the fluctuation of removal efficiency.
image file: c5ra15813c-f2.tif
Fig. 2 The removal profile of TC in RI (a), RII (b) and abiotic control reactors ((c) – 10 mg L−1 TC, (d) – 1 mg L−1 TC).

3.3 Fraction of TC removal

To obtain further insights into the adsorption and biodegradation of TC in nitrifying sludge system, experiments during each cycle were carried out when both reactors were stable. As shown in Fig. 3, the contents of TC in the liquid and solid phases were measured on behalf of the TC amount of residue and adsorption.35 The biodegradation proportion was calculated according to mass balance. In RI and RII, about 14.5% and 17.3% TC was removed though adsorption, while 35.5% and 56.6% was achieved via biodegradation at the end of the cycle. The proportion of adsorption in RI and RII had a slight increase in the first 8 h and then decreased slightly. Compared with the part of the biodegradation, the removal by adsorption remained unchanged, 14.9 ± 1.0% and 28.3 ± 7.3%, respectively, clearly indicating that the adsorption equilibrium had been reached. These results verified the previous assumption that biodegradation was the main approach to removal TC in subsequent operation. The biodegradation of TC showed a lag period in the first 8 h, after which it speeded up until the end of the cycle, implying that there was microbial acclimation of nitrifying sludge to TC of higher concentration at the beginning of the cycle.36 Therefore, the initial removal of TC mainly depended on adsorption, and the subsequent decreases were attributed to biodegradation. At the later stage of cycle, the decrease of TC adsorbed by microbes would be attributed to the biodegradation.35
image file: c5ra15813c-f3.tif
Fig. 3 Removal and migration of TC in RI (a) and RII (b).

3.4 The enzyme activity of nitrifying sludge

The dehydrogenase is an enzyme oxidizing a substrate by a reduction reaction via transferring one or more hydrides (H) to an electron acceptor.37 The endogenous activity of sludge is measured in the absence of organic substrate, while the substrate metabolism activity is evaluated when the substrate is added.38 In this study, TC was the only organic substrate added in both reactors, indicating that the trends of DHA might be positively correlated with the biodegradation efficiency of TC. The DHA at different time in a cycle was monitored and illustrated in Fig. 4. In RI and RII, the DHA decreased from 0.62 ± 0.15 and 0.49 ± 0.02 mg TPF g−1 SS h−1 to 0.47 ± 0.06 and 0.46 ± 0.02 mg TPF g−1 SS h−1 in the first 6 h, and then increased to 0.79 ± 0.08 and 0.69 ± 0.17 mg TPF g−1 SS h−1, respectively.
image file: c5ra15813c-f4.tif
Fig. 4 Dehydrogenase activity of nitrifying sludge in both reactors.

The DHA should be minimum at 0 h because of the highest TC concentration in reactors. However, the results showed that sludge had relatively high metabolism activity at 0 h in this study. It would be explained by the incomplete diffusion of TC to nitrifying sludge when TC was just added. DHA in the two reactors was not significantly different (P > 0.05) via two-way ANOVA analysis, suggesting that nitrifying sludge under higher TC stress had similar metabolism activity with that under lower TC stress. It seems that higher TC concentration did not result in lower DHA which was consisted with the results about TC biodegradation and nitrogen removal. Besides, it was found that the amount of TC biodegradation and DHA in both reactors were linearly dependent (Fig. 4), indicating that dehydrogenase might play an important role in TC biodegradation.

3.5 FISH analysis

FISH analysis was further conducted to assess the evolution of microbial community in the nitrifying sludge system, while the distributions and quantities of AOB and NOB in both reactors were assessed using specific probes. It was easy to find in FISH images (Fig. S2) that NOB formed dense aggregations in close proximity to AOB in both reactors. The formation of micro-clusters consisting of AOB and NOB had been reported in other study,39 and Okabe et al. observed a close association between AOB and NOB in the autotrophic nitrifying biofilms.40 Quantitative FISH image analyses (Table 1) showed that, at the initial stage of operation, the fraction of NOB in total bacteria were about 11.9 ± 5.8% and 11.4 ± 3.2% in RI and RII, respectively. At the end of the experiment, the NOB fraction represented 11.4 ± 3.2% in RI whereas it took up only 6.5 ± 2.5% in RII. Statistical analysis of the data at the beginning and the end of the operation showed that there was no significant difference (P > 0.05) in RI while the results in RII were significant (P < 0.05). This phenomenon indicated that low TC stress (1 mg L−1) exhibited more effect on the composition and structure of microorganism in nitrifying sludge than high TC stress (10 mg L−1), and NOB were more sensitive to the TC stimulation. The fraction of NOB decreased by almost 50%, resulting in weak nitrite oxidation capacity of nitrifying sludge, which was in accordance with the accumulation of NO2−N in RII.
Table 1 The relative abundance of AOB and NOB in both reactors
  RI RII
Initiala Endb Initial End
a The samples taken at the beginning of the operation.b The samples taken at the end of the operation.
NOB/total bacteria 11.9 ± 5.8% 11.2 ± 3.8% 11.4 ± 3.2% 6.5 ± 2.5%
AOB/total bacteria 49.1 ± 7.3% 54.5 ± 3.2% 46.3 ± 5.1% 50.9 ± 5.7%


3.6 Sludge morphology and particle size

The sludge morphology and particle size were analyzed to explore the macroscopical variation of nitrifying sludge under different TC stress. Seed sludge showed a fluffy, irregular and loose-structural morphology, and average diameter of the bioparticles was about 218.3 ± 7.8 μm. After the addition of TC, the mean sludge diameter kept increasing, and at the end of operation, it reached 512.4 ± 7.8 μm and 353.8 ± 11.1 μm in RI and RII, respectively. As shown in Fig. 5, it was obvious to observe that large aggregation with a dense and compact structure appeared in RI, while the sludge particle was smaller and dispersive in RII.
image file: c5ra15813c-f5.tif
Fig. 5 The morphology and particle size of nitrifying sludge in RI (a) and RII (b).

The results of sludge morphology and particle size revealed that TC might accelerate the formation of nitrifying sludge aggregation and the effect was more prominent at TC concentration of 10 mg L−1 than 1 mg L−1. Hoffman et al. have reported the inductive effects of aminoglycoside antibiotics on bacterial biofilm formation and found that in a certain concentration range, the higher concentration of antibiotics induced more biofilm formation,41 which is in good agreement with our results. The formation of aggregation resulted in multilayer structure of sludge, which is important for bacteria to resist the hazardous environment.42 In this study, microorganism, especially NOB, might be protected from TC by the multilayer structure (Fig. S3) and maintained metabolic activity. The compact sludge structure in RI would provide stronger protection than the dispersive sludge structure in RII.43,44 Hence, at the end of the operation, the proportion of NOB in RI (11.4 ± 3.2%) was much higher than that in RII (6.5 ± 2.5%), which would lead to better nitrification performance in RI. The aggregation phenomena of nitrifying sludge induced by TC would be further studied in the future work.

4. Conclusions

The fate and behavior of tetracycline in nitrifying sludge system were investigated in this study. The results demonstrated that TC could be effectively removed by nitrifying sludge via a two-step procedure, including initial adsorption and subsequent biodegradation. TC exhibited inhibitory effect on both AOB and NOB, whereas NOB was more sensitive to TC. The nitrifying sludge aggregation was more observably induced at higher TC concentration, leading to multilayer structure of sludge to protect microorganism. These results explained why reactor under high TC stress showed better nitrification performance and contained more NOB amount than those in reactor under low TC stress. This work would not only expand our vision about the fate and behavior of antibiotics in activated sludge system, but also have far-reaching implications in both activated sludge and biofilm processes.

Acknowledgements

This research was supported by the National Natural Science Foundation of China (51178254, 51208283 and 51508309). The authors wish to thank China Postdoctoral Science Foundation (2015M570596) for the support of this work.

References

  1. M. Erşan, E. Bağda and E. Bağda, Colloids Surf., B, 2013, 104, 75–82 CrossRef PubMed.
  2. A. K. Sarmah, M. T. Meyer and A. B. A. Boxall, Chemosphere, 2006, 65, 725–759 CrossRef CAS PubMed.
  3. R. A. Palominos, M. A. Mondaca, A. Giraldo, G. Peñuela, M. Pérez-Moya and H. D. Mansilla, Catal. Today, 2009, 144, 100–105 CrossRef CAS PubMed.
  4. H. Liu, Y. Yang, J. Kang, M. Fan and J. Qu, J. Environ. Sci., 2012, 24, 242–247 CrossRef CAS.
  5. K. M. Onesios and E. J. Bouwer, Water Res., 2012, 46, 2365–2375 CrossRef CAS PubMed.
  6. D. T. Sponza and H. Çelebi, Bioresour. Technol., 2012, 104, 100–110 CrossRef CAS PubMed.
  7. Y. Yang, B. Li, F. Ju and T. Zhang, Environ. Sci. Technol., 2013, 47, 10197–10205 CAS.
  8. D. I. Andersson and D. Hughes, Nat. Rev. Microbiol., 2010, 8, 260–271 CAS.
  9. J. M. Brausch and G. M. Rand, Chemosphere, 2011, 82, 1518–1532 CrossRef CAS PubMed.
  10. A. L. Batt, S. Kim and D. S. Aga, Chemosphere, 2007, 68, 428–435 CrossRef CAS PubMed.
  11. A. L. Spongberg and J. D. Witter, Sci. Total Environ., 2008, 397, 148–157 CrossRef CAS PubMed.
  12. B. Li and T. Zhang, Environ. Sci. Pollut. Res., 2013, 20, 3024–3033 CrossRef CAS PubMed.
  13. M. H. Huang, W. Zhang, C. Liu and H. Y. Hu, Process Saf. Environ. Prot., 2015, 93, 68–74 CrossRef CAS PubMed.
  14. M. Clara, N. Kreuzinger, B. Strenn, O. Gans and H. Kroiss, Water Res., 2005, 39, 97–106 CrossRef CAS PubMed.
  15. W. O. Khunjar, S. A. Mackintosh, J. Skotnicka Pitak, S. Baik, D. S. Aga and N. G. Love, Environ. Sci. Technol., 2011, 45, 3605–3612 CrossRef CAS PubMed.
  16. E. Fernandez-Fontaina, F. Omil, J. M. Lema and M. Carballa, Water Res., 2012, 46, 5434–5444 CrossRef CAS PubMed.
  17. T. Katipoglu-Yazan, I. Pala-Ozkok, E. Ubay-Cokgor and D. Orhon, Bioresour. Technol., 2013, 144, 410–419 CrossRef CAS PubMed.
  18. Y. J. Shi, X. H. Wang, H. B. Yu, H. J. Xie, S. X. Teng, X. F. Sun, B. H. Tian and S. G. Wang, Bioresour. Technol., 2011, 102, 2536–2541 CrossRef CAS PubMed.
  19. G. J. Xu, Y. Zhou, Q. Yang, Z. M.-P. Lee, J. Gu, W. Lay, Y. S. Cao and Y. Liu, Appl. Microbiol. Biotechnol., 2015, 99, 2485–2490 CrossRef CAS PubMed.
  20. D. Larsson, C. de Pedro and N. Paxeus, J. Hazard. Mater., 2007, 148, 751–755 CrossRef CAS PubMed.
  21. N. H. Tran, T. Urase and O. Kusakabe, J. Hazard. Mater., 2009, 171, 1051–1057 CrossRef CAS PubMed.
  22. APHA, Standard Methods for the Examination of Water and Wastewater, American Public Health Association, Washington, DC, 20th edn, 1998 Search PubMed.
  23. S. F. Yang, C. F. Lin, C. J. Wu, K. Ng, Y. C. Lin Angela and P. K. Andy Hong, Water Res., 2012, 46, 1301–1308 CrossRef CAS PubMed.
  24. H. W. Yang, Z. P. Jiang, S. Q. Shi and W. Z. Tang, Ecotoxicol. Environ. Saf., 2002, 53, 416–421 CrossRef CAS.
  25. M. K. H. Winkler, J. P. Bassin, R. Kleerebezem, L. M. M. de Bruin, T. P. H. van den Brand and M. C. M. van Loosdrecht, Water Res., 2011, 45, 3291–3299 CrossRef CAS PubMed.
  26. H. Daims, A. Brühl, R. Amann, K.-H. Schleifer and M. Wagner, Syst. Appl. Microbiol., 1999, 22, 434–444 CrossRef CAS.
  27. B. K. Mobarry, M. Wagner, V. Urbain, B. E. Rittmann and D. A. Stahl, Appl. Environ. Microbiol., 1997, 63, 815 CAS.
  28. H. Daims, J. L. Nielsen, P. H. Nielsen, K.-H. Schleifer and M. Wagner, Appl. Environ. Microbiol., 2001, 67, 5273–5284 CrossRef CAS PubMed.
  29. J. R. Banu, K.-U. Do and I.-T. Yeom, World J. Microbiol. Biotechnol., 2008, 24, 2981–2986 CrossRef CAS.
  30. J. Rajesh Banu, K.-U. Do, S. Kaliappan and I.-T. Yeom, Biotechnol. Bioprocess Eng., 2009, 14, 543–548 CrossRef.
  31. J. Zhang, Y. Tian, W. Zuo, L. Chen and L. L. Yin, Chem. Eng. J., 2013, 233, 132–137 CrossRef CAS PubMed.
  32. Y. J. Shi, X. H. Wang, Z. Qi, M. H. Diao, M. M. Gao, S. F. Xing, S. G. Wang and X. C. Zhao, J. Hazard. Mater., 2011, 191, 103–109 CrossRef CAS PubMed.
  33. K.-U. Do, J. Rajesh Banu, S. Kaliappan and I.-T. Yeom, Biotechnol. Bioprocess Eng., 2013, 18, 313–320 CrossRef CAS.
  34. S. M. Bowman, K. E. Drzewiecki, E.-R. E. Mojica, A. M. Zielinski, A. Siegel, D. S. Aga and J. O. Berry, Environ. Sci. Technol., 2011, 45, 8958–8964 CrossRef CAS PubMed.
  35. J. Xu, G. P. Sheng, Y. Ma, L. F. Wang and H. Q. Yu, Water Res., 2013, 47, 5298–5306 CrossRef CAS PubMed.
  36. B. G. Plósz, H. Leknes and K. V. Thomas, Environ. Sci. Technol., 2010, 44, 734–742 CrossRef PubMed.
  37. Z. S. Han, J. Y. Tian, H. Liang, J. Ma, H. R. Yu, K. Li, A. Ding and G. B. Li, Bioresour. Technol., 2013, 130, 136–143 CrossRef CAS PubMed.
  38. A. Flitsch, E. N. Prasetyo, C. Sygmund, R. Ludwig, G. S. Nyanhongo and G. M. Guebitz, Enzyme Microb. Technol., 2013, 52, 60–67 CrossRef CAS PubMed.
  39. B. Mahendran, L. Lishman and S. N. Liss, Water Res., 2012, 46, 5085–5101 CrossRef CAS PubMed.
  40. S. Okabe, H. Satoh and Y. Watanabe, Appl. Environ. Microbiol., 1999, 65, 3182–3191 CAS.
  41. L. R. Hoffman, D. A. D'Argenio, M. J. MacCoss, Z. Y. Zhang, R. A. Jones and S. I. Miller, Nature, 2005, 436, 1171–1175 CrossRef CAS PubMed.
  42. C. L. Amorim, A. S. Maia, R. B. R. Mesquita, A. O. S. S. Rangel, M. C. M. van Loosdrecht, M. E. Tiritan and P. M. L. Castro, Water Res., 2014, 50, 101–113 CrossRef CAS PubMed.
  43. S. Yi, W. Q. Zhuang, B. Wu, S. T.-L. Tay and J.-H. Tay, Environ. Sci. Technol., 2006, 40, 2396–2401 CrossRef CAS.
  44. A. F. Duque, V. S. Bessa, M. F. Carvalho, M. K. de Kreuk, M. C. M. van Loosdrecht and P. M. L. Castro, Water Res., 2011, 45, 6745–6752 CrossRef CAS PubMed.

Footnote

Electronic supplementary information (ESI) available. See DOI: 10.1039/c5ra15813c

This journal is © The Royal Society of Chemistry 2015
Click here to see how this site uses Cookies. View our privacy policy here.