Extraction of preformed graphene oxide from coal: its clenched fist form entrapping large molecules†
Bholanath Pakhiraa,
Subrata Ghosha,
Sheli Maitya,
D. N. Sangeethaa,
Ankita Lahaa,
Afreen Allamb and
Sabyasachi Sarkar*a
aNano Science and Synthetic Leaf Laboratory, Downing Hall, Department of Chemistry, Indian Institute of Engineering Science and Technology, Shibpur, Botanic Garden, Howrah 711103, West Bengal, India. E-mail: abya@iitk.ac.in
bCromoz Inc., Davis Drive, Research Triangle Park, NC-27709, USA
First published on 6th October 2015
Abstract
Graphene oxide, (GO), present in low grade coal, formed under the natural coalification of plants is extracted by leaching with cold nitric acid. A similar easy extraction of GO is followed for wood charcoal. Such GO sheets are thermally not very stable and on aging are fragmented into small spherical shapes. These can be solubilized in 10% NaOH and reprecipitated by adjusting the pH to around 7. Further purification could be achieved by extracting with ethanol as these shapes are highly soluble. This GO is larger than a graphene quantum dot and can be folded into a closed fist form and it is shown to entrap tetraphenylporphyrin (TPP). The TPP in the composite is not soluble in dichloromethane whereas free TPP is highly soluble. Such a GO–TPP composite retains the properties of pure GO as it is soluble in ethanol in which free TPP is insoluble. It is shown that in phosphate buffered saline (PBS, pH, 6.8) this composite is soluble and remained intact. At a higher pH of PBS buffer it releases all entrapped TPP by opening the clenched fist form. Similarly the drug donepezil, used in Alzheimer’s treatment gets entrapped by GO which is also released at a higher pH, 7.4. The clenched fist form of corrugated GO is related to the pH dependent epoxide dominated structure as proposed by Hofmann and Holst’s model and the open structure may be dominated by hydroxyl groups (enol) following Ruess’s model. Such pH dependent inter-conversion uniquely enables GO to act as a Trojan horse in carrying and releasing a drug molecule under a physio-compatible environment.
Introduction
Synthesis of graphene oxide from graphite is dominated by the classic method introduced by Hummers1 with its modifications related to the use of varied oxidizing agents in corrosive oxidizing acid mixtures.2,3 Substituting the carbon source from graphite to anthracite coal and using concentrated sulphuric and nitric acid without the addition of other oxidizing salt mixtures led to the isolation of quantum graphene oxide.4–7 These methods generate graphene oxide (GO) by the drastic oxidative treatment of carbon and the size of GO lies in two extremes, either micrometers in size when using graphite or under 20 nm when using anthracite coal. However, the simple carbonization of natural organic wastes or even roasted food from a barbecue led to the formation of GO.8,9 This suggests that during the bio-geochemical coalification of plant materials the increase in carbon content from the starting peat stage to the end anthracite version of the coal leads to the metamorphic transformation of the carbonaceous mass. As we work today to synthesize graphene oxide we proceed in the reverse direction. Plant materials are composed mainly of carbon, oxygen, hydrogen, nitrogen and sulphur. During their coalification the heat of metamorphism destroys the organic molecules removing all these elements but leaving carbon. The carbonization process increases the carbon content in stages such as peat, lignite, bituminous and anthracite where the anthracite form of coal is almost pure carbon which under high pressure and temperature is converted to mineral graphite.10–12Therefore it will be prudent to investigate the formation of graphene oxide (GO) during the early stages of coalification. GO, the oxidised form of graphene could exist during the initial coalification process as an intermediate which finally under anaerobic conditions and under heat and pressure may slowly transform to pure carbon to form the best grade of anthracite coal. Thus it will be interesting to investigate the pre-formed graphene oxide form of carbon from the earlier stages of the coalification of plants. Herein we describe a simple route to isolate graphene oxide from low grade coal and also from wood charcoal. The process requires a simple treatment of leaching these materials using only cold nitric acid. The minerals and moisture present in low grade coal prevent much stacking of the honeycomb structured carbon sheet embedded with oxo groups during the initial coalification process. Detailed chemical analysis of such low grade non-coking coals showed the presence of a low percentage of coal thus having a low calorific value, in addition other elements including oxygen and inorganic minerals were detected.13,14 Such low grade coals are normally found in open peat and not deeply buried as is required to get better grade coal like anthracite which needs to be under completely anaerobic and high temperature conditions.15,16
Results and discussion
A graphene quantum dot was obtained from anthracite coal by using strong oxidizing mixtures of hot sulfuric and nitric acid4 albeit not adding more oxidising salts as used in the Hummers method.1,2 The compactness of the carbon sheets in anthracite coal was not as robust as that present in graphite so less stringent corrosive oxidizing mixtures were needed to separate the graphene sheets in order to incorporate oxidation.In contrast, if the lower grade coal with oxygen content is used then the presence of oxo groups in the coal would create mis-aligned sheets which will be readily exfoliated under a milder treatment compared to that which was applied to anthracite coal. Thus simply purified powdered low grade coal once placed in cold concentrated nitric acid leads to the separation of graphene oxide layers. The initial period of the addition of nitric acid was exothermic with the production of brown nitric dioxide fumes, so in this process it is possible that some further oxidation took place to completely ease out the layers of the GO sheets. The red brown mass thus obtained on the evaporation of nitric acid when vacuum dried (over solid NaOH) to remove free nitric acid is found to be freely soluble in water. This product when subjected to SEM (Fig. 1a) shows the presence of large GO sheets. Interestingly on ageing this GO for a few days at ambient temperature a change in its morphology is observed with a portion transformed into a spherical form (Fig. 1b). On ageing most of this version of GO became insoluble in water. However the insoluble version is soluble in 10% NaOH and on acidification with dilute hydrochloric acid to neutral pH led to the precipitation of fresh GO which became once more soluble in water. This form shows fragmented graphene of smaller sizes along with a spherical form (Fig. 1c). This transformation from the soluble to insoluble form in water is thermally accelerated and most of the insoluble part is precipitated even at a temperature of 50 degrees centigrade. It was observed that the isolated GO by nitric acid treatment on extraction by alkaline solution led to the fragmentation of these sheets to smaller dimensions (see Fig. 3) which are definitely larger than the sizes of a graphene quantum dot.4
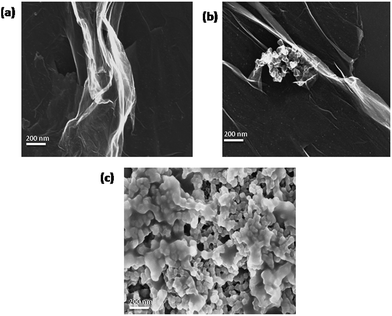 | ||
| Fig. 1 SEM images of GO prepared from coal, (a) freshly prepared, (b) aged sample in the solid state and (c) water insoluble form on resolubilization by alkali and isolation at neutral pH. | ||
DLS and electronic spectra
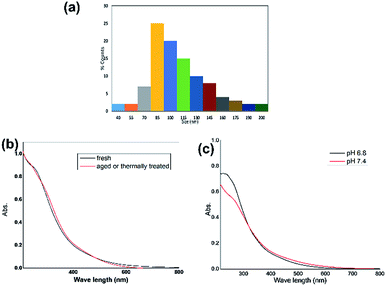
The product, GO, as isolated by leaching with NaOH solution falls in the size range 40–200 nm as measured using a DLS study (Fig. 2a). This size range is unique as it is much smaller than the larger sizes of GOs produced from the first isolation in acidic medium (Fig. 1) or by the Hummers method1 but larger than the size of a graphene quantum dot (below 20 nm) produced from anthracite coal.4 The isolated GO is freely soluble in alcohol and in water above neutral pH and less so in the aqueous-acidic pH range.Its electronic spectra in acidic and basic pH showed a distinct change which could be used as the marker for its identity in different structural forms under changed pH. An alcoholic solution of the GO shows the electronic absorption spectrum (Fig. 2b) which on ageing at room temperature or by exposure to ammonia vapor or under thermal conditions changes the absorption features (Fig. 2a). Similar changes appear when the GO is dissolved in aqueous phosphate buffered saline (PBS) albeit with pH variation. At pH 6.8 the absorption at 260 nm shows a distinctive peak but at pH 7.4 the contour of this peak appears as a shoulder (Fig. 2b and c) as observed with the aged sample in alcohol.
Spectral cross points in alcohol and in the PBS buffer (Fig. 2b and c) differ showing the influence of the solvent on the electronic absorption.
AFM, SEM, TEM and HRTEM of “open and closed GO”
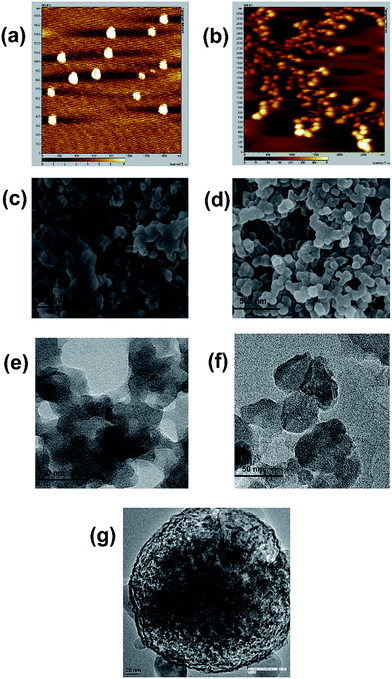
Microscopic images such as AFM, SEM, TEM and HRTEM of the pH dependent or fresh and aged forms (Fig. 3) demonstrate the existence of two structural forms of the present GO. AFM images clearly show the transformation of a flat GO sheet to a spherical shape on overnight ageing. The SEM microscopy images elaborate such a transformation when the spherical shape of the GO deposited under alcoholic solution is sprayed with ammonia vapor to show the opening of the spheres to form sheets in several places. The HRTEM images clearly show the structural differences between these two forms (Fig. 3e and f).Reports are known to describe the influence of pH on larger sheet graphene oxide which inflicts changes in the electronic and fluorescence spectra due to the possible pH dependent ionization–deionization of the attached oxygenated functional groups.17–19 In the present case we observe similar pH dependent electronic spectral changes but here the initial large sheets of GO get fragmented under alkali treatment and the larger sheets can not be recovered under acidic conditions (also fluorescence, shown in Fig. S4†). The pH dependent structural changes were monitored using scanning electronic microscopy (SEM). The result has been spectacular as it revealed the flattening of GO (Fig. 3a, c and e) on ammonia exposure and later the structure resumes its spherical shape (not shown) on standing, similar to what we observed with the freshly isolated acid treated sample (Fig. 1). This observation strongly suggests the behaviour of GO in a “close and open sesame” manner. Our observation is reminiscent of the earlier predicted structure of the oxidized carbon sheet where the epoxide dominated structure was proposed by Hofmann and Holst20 and the open structure may be dominated by hydroxyl groups (enol) where the closed fist form is opened following Ruess’s model.21
FTIR and isotope labelling
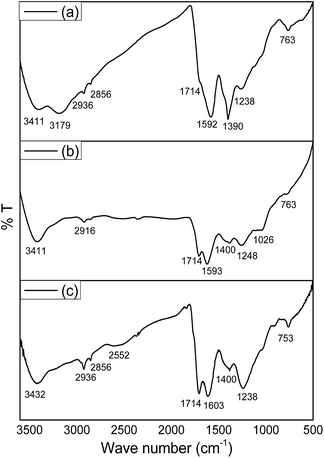
The closed GO is roughly spherical and we refer to this as the ‘clenched fist’ form which is thermodynamically more stable. Several adjacent phenolic hydroxyl groups on the surface of the GO surface participate in epoxide formation in acidic pH resulting in the creation of oblique arches like the palm of a hand which can close into a clenched fist. The possibility of the interaction of a couple of sheets to make a closed structure may also be a possibility that may result in the formation of a larger closed structure. If the rough length and breadth of an open GO sheet as measured by AFM or SEM is used to make a sphere then one gets a definite size of the closed structure or sphere. If two such sheets are collectively used to create a closed structure by stitching the ends of two spherical hubs assisted by condensation at the edges of the two halves then one achieves a defined spherical surface. The variation in the size of the flat GO and the size distribution as observed in the clenched fist form shows that all such possibilities like a one sheet closure and two or multiple sheet closures are possible with the available size distribution histogram (Fig. S7†).The confirmation of such an epoxide–enol inter-conversion is readily made by using deuterolysis of GO in the epoxide (‘closed fist’) form. Once opened under ND4OD–D2O, the FTIR spectra clearly shows the appearance of ν(OD) around 2600 cm−1 with the disappearance of a peak around 1000 cm−1 which is ascribed to epoxide vibration (C–O–C).22 The open fisted GO that forms in NH4OH–H2O produces a similar FTIR spectra with the absence of epoxide vibration and with the appearance of a common ν(OH) vibration for enol merged with the ν(OH) vibration from a carboxylic acid group (Fig. 4).
GO–TPP composite
The π–π stacking in the honeycomb hexagon structure of carbon in graphene is counteracted with the introduction of several oxo-functional groups on the surface of graphene oxide (GO). In the limiting case like graphene quantum dots the size is within 20 nm and such a small unit with a non-planar structure may not have enough surface area to opt for the energy stabilized spherical shape. If such a closed structure is formed it may not have the stability and may be readily opened up. A larger surface area may help the energy saving process to opt for a more stable clenched fisted (spherical) form. A size range from 40 nm to 200 nm with an optimum distribution of 60–140 nm of GO has been found to be ideal for such open to clenched fist structural changes under ambient conditions (Fig. S7†).The use of such a structure of GO as a Trojan horse to carry drugs was achieved with a spectrally identifiable large molecule like tetraphenylporphyrin (TPP) which may also be considered as a model of porphyrin based molecules used in photodynamic therapy.23 TPP-entrapped GO (GO–TPP composite) (see method) is soluble in ethanol displaying the properties of pure GO albeit carrying TPP inside. Interestingly TPP as such is not soluble in ethanol but under entrapped conditions inside the clench fisted GO remains in solution as the electronic spectrum of the composite shows the clenched fisted GO along with the presence of TPP. The comparative XRD of the GO–TPP composite and of GO shows that TPP is present in the composite (Fig. S2†). The graphitic (002) plane (2θ = 25.92°) in the GO–TPP composite is shifted to 26.67° due to the stacking of large TPP molecules inside the GO. Similarly (100) and (004) planes are shifted from 42.38 to 42.03° and from 62.91 to 63.68° respectively. Interestingly when the ethanol solution of the GO–TPP composite was acidified with HCl gas (or acetic acid), the fisted GO signature remained unaltered but the TPP showed protonation in its Q band structure with the shift in the Soret band showing the readily available movement of a proton across the GO surface to protonate the trapped TPP (Fig. S3†).
The GO–TPP composite readily dissolves in aqueous phosphate buffered saline (PBS) at pH 6.8 to show a similar effect resulting in the protonation of TPP. Systematic fluorescence measurements of free GO in both open and clenched fist forms and the GO–TPP composite in phosphate buffer (Fig. S4–S6†) clearly show the distinction between the individual fluorescence of this GO in two forms and also of the incorporated TPP inside its clenched fist form. Interestingly when the pH of the PBS buffer is raised to pH 7.4, the GO–TPP composite opens its fist releasing insoluble TPP into the aqueous buffer.
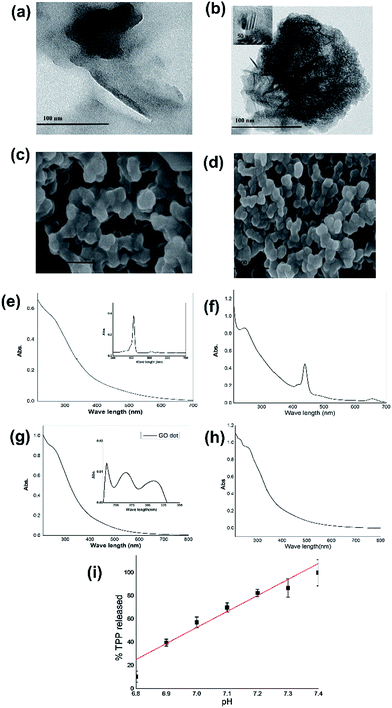
The electronic spectrum of GO now shows an open fisted form showing the absence of TPP absorption. As TPP is highly soluble in dichloromethane, a leaching of the released free TPP from the PBS buffer solution at pH 7.4 developed a visibly distinctive pink colour that was confirmed by its electronic spectral signature. This confirmed that GO under pH 7.4 released the engulfed TPP by changing its structure to the open fisted form (Fig. 5). The SEM and TEM images of the GO–TPP composite clearly show the presence of a stack of TPP inside the GO.24
Alzheimer’s drug encapsulation
The low toxicity of GO has made this material a promising candidate in drug delivery research.25 This report provides the isolation of a uniquely sized pre-formed GO in the coalification of plants or even from wood charcoal and can be extruded using green chemistry. The interesting aspect here is its strongly pH dependent open and clenched fist forms which can be readily exploited to encapsulate a molecule like TPP or a drug molecule (Fig. 5) within its clenched fist and such an entrapped species cannot be released even under sonication to demonstrate the status of the engulfed species inside the clenched fist GO. However, a slight change in pH will readily allow the opening of the clenched fist to release the molecule from inside. The intracellular pH around 6.8 and extracellular pH around 7.4 of human cells just coincide with the window of the present GO in transforming its clenched fist to the open fist form. This GO is capable of carrying a real drug molecule of interest like donepezil (DZ)26 an acetylcholinesterase inhibitor used in Alzheimer’s treatment. This drug was encapsulated following a similar recipe as described to entrap TPP (see Experimental section). This DZ drug is shown to be effectively carried by clenched fist GO with its pH dependent release (Fig. 5). Thus the use of GO as a Trojan horse in drug delivery could be made for any molecule of interest for its transport and release. The density of the surface functionalities of GO may be tailor made to tune the pH range for the closed and open fist shape necessary for a specific drug to be delivered under suitable pH conditions.Experimental section
Isolation of GO
Wood charcoal or low grade coal in powdered form was first freed from aromatic hydrocarbons and other soluble organic compounds by repeatedly washing with toluene and acetone, and using a Soxhlet extractor followed by washing with dilute hydrochloric acid to free these from inorganic oxides and finally by water and dried in air. The dried charcoal (coal) powder (1.0 g) was treated with concentrated nitric acid (25 ml) in portions to avoid excessive heat generation wherein the release of brown fumes started and finally died down. The mixture was allowed to stand overnight at room temperature. Then the mass was dried under vacuum using enough desiccating agent, solid NaOH to trap all the excess nitric acid to yield a yellow-brown solid. This solid was dissolved in ethanol and the alcoholic solution was evaporated to dryness under vacuum at a low temperature to yield a brownish yellow mass of 0.7 g. This material contains large GO sheets (Fig. 1a). However with time this sample lost water solubility. The sample can be made soluble in 10% sodium hydroxide solution to get a yellow-brown coloured solution. This solution after filtration was then slowly neutralized with dilute hydrochloric acid to pH 7 and on standing a brown coloured flaky precipitate appeared. This precipitate was separated out by centrifugation, washed with cold water to free it from sodium chloride formed in the neutralization process and finally dried in air yielding a red brown solid with almost quantitative yield based on the weight of the source material used. This solid was subjected to several spectroscopic and microscopic analyses and also to XRD to show that this is a new form of GO. It is in the size range from 40 nm to 220 nm as observed by the DLS, AFM and SEM studies.TPP–GO composite
A toluene solution of TPP (50 mg in 25 ml) was mixed with an alcoholic solution of freshly prepared GO (20 mg in 25 ml) and the final mixture was evaporated under vacuum at −37 °C to yield a brown mass. This brown compound was washed three times with toluene under sonication to remove any unwrapped TPP leaving the pure GO–TPP composite.Donepezil–GO composite
As described above a 5 ml alcoholic solution of 2 mg GO was mixed with a DCM solution 5 ml of 5 mg donepezil and the mixture was evaporated at −37 °C under vacuum. The resultant residue formed was washed thrice with water containing very dilute hydrochloric acid (pH ∼ 4) to remove any unwrapped DZ and finally with water and dried in vacuo to get the pure GO–DZ composite.These composites were then subjected to various spectroscopic and microscopic investigations as described in the Results section.
Physical measurements
Electronic spectral measurements were carried out with a JASCO, V-630 spectrophotometer and fluorescence spectra were recorded using a Photon Technology International (PTI) Quanta Master™ 300. The pH of the solution was monitored using a Systronics Digital pH meter 335 and for Scanning Electron Microscopy (SEM), a SUPRA 40VP field-emission SEM (Carl Zeiss NTS GmbH, Oberkochen, Germany) equipped with an energy-dispersive X-ray (EDX) unit, in high-vacuum mode operated at 10 kV was used for the visualization of the size and morphology of GO and GO–TPP. The powder X-ray diffraction data were collected on a Bruker D8 Advance X-ray diffractometer using Cu Kα radiation (λ = 1.5418 Å) generated at 40 kV and 40 mA. 5.0 mg of GO sample was dissolved in 100 ml of ethanol to determine the particle size using dynamic light scattering (DLS), nanotrac wave model W3222. TEM images were taken using a FEI, TECHNAI-T-20 machine operated at the voltage of 200 kV.Conclusions
Low grade coal which is formed during the early stages of the coalification of plants does contain GO formed under initial metamorphic conditions and remains buried under the Earth’s crust. The present work utilized a simple process to extract this GO by leaching with cold nitric acid. The process is extended to wood charcoal to show that the similar formation of GO took place under wood pyrolysis. However such GOs in sheet forms remain unstable and rapidly change to closed forms. The fragmentation to smaller dimensions was achieved by leaching with alkali to fragment the larger GOs to smaller sizes. Such GO in the size range of 40–200 nm, changed from almost flat to oblique arches like the palm of a hand which can close into a clenched fist (a closed sphere) in the acidic pH (≤6.8) buffer medium. The clenched fist reverts back to the open fist form at the physiological pH of 7.4. This GO engulfs molecules of interest inside by its clenched fist structure. It has been shown that tetraphenylporphyrin (TPP) as a model of a photodynamic porphyrin drug, got entrapped inside GO in its clenched fist form. GO–TPP (GO composite) retains the properties of pure GO with respect to its free solubility in ethanol in which pure TPP is by large insoluble. Further, in phosphate buffered saline (PBS) the GO composite is soluble and retains the TPP inside; displaying the combined spectral signatures of GO and TPP at pH 6.8. The water insoluble TPP inside the composite cannot be extracted by dichloromethane whereas free TPP is highly soluble. On raising the pH of the PBS buffer to 7.4, it releases all entrapped TPP by opening the clenched fist form. Finally donepezil taken as a model drug molecule, an acetylcholinesterase inhibitor, used in Alzheimer’s treatment gets entrapped by GO and remains inside in acidic PBS but is released at pH 7.4. The clenched and open fist forms of GO are related to the pH dependent epoxide–enol inter-conversion that uniquely facilitates GO to act as a Trojan horse in carrying and delivering a drug molecule under a physio-compatible environment.Acknowledgements
B. P. acknowledges CSIR, New Delhi for a SRF. S. M. thanks the UGC for a JRF. D. N. S. and A. L. acknowledge the support of all the three Indian Academy of Sciences for the summer research fellowship. S. S. thanks SERB-DST, (SR/S1/RFIC-01/2011), New Delhi, India for a Ramanna Fellowship and S. S. and A. A. thank Cromoz Inc. USA for funding.Notes and references
- W. S. Hummers and R. E. Offeman, J. Am. Chem. Soc., 1958, 80, 1339 CrossRef CAS.
- H. P. Boehm and W. Scholz, Z. Anorg. Allg. Chem., 1965, 335, 74–79 CrossRef CAS PubMed.
- D. C. Marcano, D. V. Kosynkin, J. M. Berlin, A. Sinitskii, Z. Sun, A. Slesarev, L. B. Alemany, W. Lu and J. M. Tour, ACS Nano, 2010, 4, 4806–4814 CrossRef CAS PubMed.
- R. Ye, C. Xiang, J. Lin, Z. Peng, K. Huang, Z. Yan, N. P. Cook, E. L. G. Samuel, C.-C. Hwang, G. Ruan, G. Ceriotti, A.-R. O. Raji, A. A. Martí and J. M. Tour, Nat. Commun., 2013, 4, 3943 Search PubMed.
- Y. Dong, J. Shao, C. Chen, H. Li, R. Wang, Y. Chi, X. Lin and G. Chen, Carbon, 2012, 50, 4738–4743 CrossRef CAS PubMed.
- Y. Dong, J. Lin, Y. Chen, F. Fu, Y. Chi and G. Chen, Nanoscale, 2014, 6, 7410–7415 RSC.
- Y. Dong, L. Wan, J. Cai, Q. Fang, Y. Chi and G. Chen, Sci. Rep., 2015, 5, 10037 CrossRef CAS PubMed.
- M. Saxena and S. Sarkar, RSC Adv., 2014, 4, 30162–30167 RSC.
- M. Roy, T. Kusurkar, S. Maurya, S. Meena, S. Singh, N. Sethy, K. Bhargava, R. Sharma, D. Goswami, S. Sarkar and M. Das, 3 Biotech, 2014, 4, 67–75 CrossRef.
- M. Bonijoly, M. Oberlin and A. Oberlin, Int. J. Coal Geol., 1982, 1, 283–312 CrossRef CAS.
- P. R. Buseck and B.-J. Huang, Geochim. Cosmochim. Acta, 1985, 49, 2003–2016 CrossRef CAS.
- C. F. K. Diessel, R. N. Brothers and P. M. Black, Contrib. Mineral. Petrol., 1978, 68, 63–78 CrossRef CAS.
- P. Boral, A. K. Varma and S. Maity, Curr. Sci., 2015, 108, 384–394 CAS.
- S. Maity and P. Mukherjee, Curr. Sci., 2006, 91, 337–340 CAS.
- G. o. I. Ministry of Coal, Coal Grades, http://www.coal.nic.in/content/coal-grades, accessed 23/04/2015, 2015.
- B. Manoj and A. Kunjomana, Trends Appl. Sci. Res., 2012, 7, 434–444 CrossRef CAS.
- G. Eda, Y.-Y. Lin, C. Mattevi, H. Yamaguchi, H.-A. Chen, I. S. Chen, C.-W. Chen and M. Chhowalla, Adv. Mater., 2010, 22, 505–509 CrossRef CAS PubMed.
- D. Pan, J. Zhang, Z. Li and M. Wu, Adv. Mater., 2010, 22, 734–738 CrossRef CAS PubMed.
- K. P. Loh, Q. Bao, G. Eda and M. Chhowalla, Nat. Chem., 2010, 2, 1015–1024 CrossRef CAS PubMed.
- U. Hofmann and R. Holst, Ber. Dtsch. Chem. Ges. A/B, 1939, 72, 754–771 CrossRef PubMed.
- G. Ruess, Monatsh. Chem., 1947, 76, 381–417 CrossRef CAS.
- J. Guerrero-Contreras and F. Caballero-Briones, Mater. Chem. Phys., 2015, 153, 209–220 CrossRef CAS PubMed.
- M. Ethirajan, Y. Chen, P. Joshi and R. K. Pandey, Chem. Soc. Rev., 2011, 40, 340–362 RSC.
- A. Tsuda, Y. Nagamine, R. Watanabe, Y. Nagatani, N. Ishii and T. Aida, Nat. Chem., 2010, 2, 977–983 CrossRef CAS PubMed.
- H. Shen, L. Zhang, M. Liu and Z. Zhang, Theranostics, 2012, 2, 283–294 CrossRef CAS PubMed.
- W. E. Heydorn, Expert Opin. Invest. Drugs, 1997, 6, 1527–1535 CrossRef CAS PubMed.
Footnote |
| † Electronic supplementary information (ESI) available: FTIR spectra, powder X-ray diffraction (XRD) studies, electronic spectra, fluorescence spectra, size distribution from AFM pictures. See DOI: 10.1039/c5ra15699h |
| This journal is © The Royal Society of Chemistry 2015 |

