Amorphous carbon modified nano-sized tungsten carbide as a gas diffusion electrode catalyst for the oxygen reduction reaction

Zhiwei Liua, Ping Li*a, Fuqiang Zhaib, Qi Wanc, Alex A. Volinskyd and Xuanhui Qua
aInstitute for Advanced Materials and Technology, University of Science and Technology Beijing, Beijing 100083, China. E-mail: ustbliping@126.com; Fax: +86-10-62334311; Tel: +86-10-82377286
bDepartament Física Aplicada, EETAC, Universitat Politècnica de Catalunya – BarcelonaTech, 08860 Castelldefels, Spain
cEnergy Material & Technology Research Institute, General Research Institute for Nonferrous Metal, Beijing 100088, China
dDepartment of Mechanical Engineering, University of South Florida, Tampa, FL 33620, USA

Received 2nd August 2015 , Accepted 7th August 2015

First published on 7th August 2015


Abstract

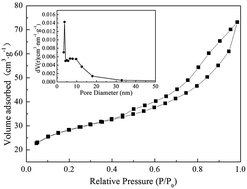
Nanostructured tungsten carbide with high surface area and containing amorphous carbon is prepared by a low temperature combustion synthesis method. The nanostructured tungsten carbide is used as the catalyst in a gas diffusion electrode. The obtained WC with different carbon content was investigated by XRD, FESEM, TG-DTA, BET and XPS. When the molar ratio of C/W is 19/3, the WC particles with different carbon content are obtained after a carbonizing process between 900 and 1400 °C, and the content of free carbon in WC also increases gradually with temperature. The carbon content is tested by the high frequency combustion-infrared absorption method in a carbon sulfur analyzer. The electrochemical properties of the tungsten carbide for the oxygen reduction reaction are characterized by its polarization curves and electrochemical impedance. The results show that the presence of the appropriate amorphous carbon is beneficial for improving the conductivity and dispersibility of the tungsten carbide catalyst, and more active centers can be provided by the catalyst.


1. Introduction

Metal–air batteries have aroused great interest due to their simple structure, non-polluting and high power properties, and energy density. The cathodic oxygen reduction reaction (ORR) is one of the most important factors affecting the performance of a metal–air battery system. Among the cathode catalysts for metal–air batteries, platinum is currently the most used electro-catalyst for the ORR,1–3 owing to its high chemical stability and electro–catalytic activity. Meanwhile, the disadvantages of high cost and easy poisoning by carbon monoxide4 or methanol have greatly hindered the practical applications of metal–air batteries. At present, searching for other novel substitutes which could further improve the catalytic properties of oxygen electrodes has become a focal point of study in metal–air cells and fuel cells.

Nano-sized tungsten carbide (WC) is a new promising platinum-like catalyst for gas diffusion electrodes, not only due to its catalytic behavior, which is close to that of platinum, but also its electrochemical stability, oxidation resistance and anti-poisoning are much higher than those of platinum catalysts.5–8 Chen et al.9 reported that WC is active to methanol oxidation and is a promising alternative electrocatalyst at voltages up to ∼0.8 V, WC also shows a high potential for the ORR due to its unique electronic structure. Due to a good electronic conductivity, WC will become an excellent material for diffusion barrier layers in the field of semiconductors. Besides, WC can be used as a support material for platinum catalysts,10 and the catalytic activity is also increased.

The presence of carbon on the WC surface has become a critical issue for the use of WC catalysts in electrochemical applications. The surface carbon will be present, unless properly controlled during the WC synthesis process, since the carbon source is derived from the decomposition of hydrocarbons.11,12 The influence of the gas phase composition and synthesis temperature on the phases of W, W carbides and W oxides with and without surface carbon have been reported.13,14 Hara et al.15 reported that the catalyst showed poor catalytic activity for hydrogen oxidation reactions (HORs) due to surface carbon. In the study of ordered macroporous tungsten carbide, Bosco et al.16 showed that surface carbon can stabilize the surface structure of WC, so the activity of methanol oxidation will be improved. In addition, Pt supported on mesoporous WC showed a better catalytic performance for hydrogen evolution reactions (HERs)17 and methanol electro-oxidation18 than Pt supported on carbon, which is due to the free carbon present on the surface of WC.

In this work, a WC precursor with a C/W molar ratio of 19/3 possessing higher catalytic properties was prepared by the low temperature combustion synthesis (LCS) method. The WC nanoparticles were obtained after carbonization of the precursor. The influence of different carbonization temperatures on the carbon content of the WC was studied. The electrochemical properties of the nano-sized WC with different surface amorphous carbon content were characterized by polarization curves and electrochemical impedance measurements.

2. Experimental details

2.1 Preparation of the WC catalyst

Mesoporous WC was synthesized by the LCS method, which is reported in a previous work.19 Ammonium tungstate ((NH4)10W12O41), nitric acid (HNO3, 65 wt%), urea (CO(NH2)2) and glucose (C6H12O6·H2O) were used as raw materials in the synthesis of the WC particles. First, 22.82 g of (NH4)10W12O41, 3 g of CO(NH2)2 and 18.81 g of C6H12O6·H2O were dissolved together in 50 ml of deionized water under stirring to obtain a redox mixture. Then, 9.69 g of HNO3 was added to the solution which was concentrated in a 500 ml beaker. The mixed solution was placed into a closed electric furnace in order to initiate a highly exothermic self-contained combustion process, resulting in the production of a loose black WC precursor. Finally, the precursor was transferred into a tube furnace after grinding, where it was further carburized under an argon flow in the 800 °C to 1400 °C temperature range for 6 h to obtain the samples. In order to conveniently describe the products of pure, reduced and carburized WCs at different temperatures, hereafter, these products are named as catalyst A, B, C, D or E, corresponding to the reduction and carburization at 900 °C, 1000 °C, 1100 °C, 1200 °C or 1400 °C, respectively.

2.2 Sample characterization

The X-ray diffraction (XRD) measurements were carried out on a Rigaku (D/MAX-RB) diffractometer using Cu Kα radiation (λ = 1.5406 Å) at a scanning rate of 10° min−1. The morphology and nanostructure of the samples were observed using a field-emission scanning electron microscope (FESEM, Zeiss Ultra 55). The thermal stability of the samples was studied by TG-DTA (Seiko 6300) and the data were recorded from room temperature to 1000 °C at a heating rate of 10 °C min−1 under air atmosphere. The BET (QuadraSorb SI) surface area measurement was calculated from the nitrogen adsorption isotherms at −196 °C. The content of the carbon element was measured using an infrared absorption carbon–sulfur analyzer (CS-2008). The energy dispersive X-ray spectra (EDS) attached to the FESEM and X-ray photoelectron spectroscopy (XPS, ESCALAB 250 Xi) were also used to investigate the near surface chemical composition of the samples.

2.3 Gas diffusion electrode preparation

The gas diffusion electrodes were prepared according to earlier reports,20,21 and consist of three layers: a catalyst layer, a gas diffusion layer and a current collecting layer. The preparation process of the catalyst layer can be described as follows: tungsten carbide, acetylene black and polytetrafluoroethylene (PTFE, 60 wt% suspension), according to a weight ratio of 3[thin space (1/6-em)]:[thin space (1/6-em)]5[thin space (1/6-em)]:[thin space (1/6-em)]2, were mixed in 20 ml of deionized water, and the appropriate amount of anhydrous ethanol was added. The mixture became a tough and sticky paste under magnetic stirring at 80 °C for 2 h. Under a pressure of 16 MPa, the paste was pressed into a size-specific catalyst layer by using a pellet press. A similar method was used to prepare the gas diffusion layer. The weight ratio of polytetrafluoroethylene to anhydrous sodium sulfate to acetylene black was 1[thin space (1/6-em)]:[thin space (1/6-em)]1[thin space (1/6-em)]:[thin space (1/6-em)]1. In the process, PTFE, anhydrous sodium sulfate and acetylene black were used as the binder, the pore former and the support material, respectively. Nickel foam was chosen as the current collector in the moisture barrier. The gas diffusion electrodes were obtained by pressing the three layers together. Finally, the electrodes were finished by sintering at 200 °C in a nitrogen flow for 30 min. The loading amount of the active materials was 5 mg cm−2. The Pt (10 wt% Pt, Aladdin) gas diffusion electrode and activated carbon (AC) gas diffusion electrode were also prepared by following the same procedure as above.

2.4 Electrochemical characterization

Electrochemical measurements were carried out in a conventional three-electrode system using a Parstat 2273 electrochemical workstation at 30 °C. Nickel foil was used as the counter electrode and the prepared gas diffusion electrode was used as the working electrode. The area of the working electrode is 0.785 cm2. Under alkaline conditions, the Hg/HgO electrode was used as the reference electrode and the electrolyte was a 6 M KOH solution. Under neutral pH conditions, a saturated calomel electrode (SCE) was used as the reference electrode and the electrolyte was a 1 M NaCl solution. The steady state polarization curve measurements were conducted with a scan rate of 0.5 mV s−1. The electrochemical impedance spectra (EIS) were recorded in the 0.01 Hz to 10 kHz ac signal range with a 5 mV amplitude.

3. Results and discussion

3.1 Characterization of the as-synthesized WC catalyst

The precursor with the 19/3 C/W molar ratio was reduced and carburized at the different temperatures under argon atmosphere for 6 h. The X-ray diffraction patterns of the different samples are shown in Fig. 1. Obvious WC peaks and W2C peaks appear when the temperature increases to 800 °C, suggesting that the carbonization reaction of the precursors had occurred. When the reduction carbonization temperature is higher than 900 °C, strong WC peaks can be observed in Fig. 1, indicating that WO3 completely transformed into pure WC through the carbonization process. According to the results calculated by the Scherrer formula, the average particle sizes of the catalysts are 50.0 nm, 46.8 nm, 39.1 nm, 57.3 nm and 59.0 nm, which correspond to catalysts A, B, C, D and E, respectively. Therefore, the carburization temperature affects the final WC phase generation.
image file: c5ra15394h-f1.tif
Fig. 1 X-ray diffraction patterns of the tungsten carbide synthesized at different carbonization temperatures.

Fig. 2 displays the FESEM micrographs of the products prepared at different carbonization temperatures. The small amount of porosity appearing in the tungsten carbide samples results from a large amount of released heat during the low temperature combustion process. As shown in Fig. 2a–c, the particle size of the samples decreases with the rise in temperature. The particle size of the catalyst lies within a wide range, and agglomeration will happen during carbonization. When the carbonization temperature reaches 1100 °C, a small sized catalyst (C) can be obtained with homogeneous nano-sized particles of 40–50 nm. At this temperature, the morphology of the WC particles has been transformed from irregular to spherical, and catalyst C has the highest specific surface area. With further increase in the carbonization temperature, the tendency of the powder to agglomerate becomes more obvious and the particle size also tends to increase. The particle sizes of catalyst D and catalyst E are both larger than that of catalyst C, which is consistent with the XRD results.


image file: c5ra15394h-f2.tif
Fig. 2 FESEM micrographs of the products of WC: (a) catalyst A; (b) catalyst B; (c) catalyst C; (d) catalyst D and (e) catalyst E.

The N2 adsorption/desorption isothermal curves of catalyst C are shown in Fig. 3. The sample exhibited the representative type IV isotherms with a distinct hysteresis loop over the P/P0 ranging from 0.42 to 0.98, clearly showing the mesoporous properties of the prepared WC. In addition, the pore size distribution is shown in the inset of Fig. 3, demonstrating that catalyst C is mesoporous with a maximum diameter of 3.84 nm. Based on the above analysis, it is reasonable to believe that the mesoporous structure of WC is suitable to allow its use as an electrochemical catalyst material.


image file: c5ra15394h-f3.tif
Fig. 3 N2 adsorption–desorption isotherms of the catalyst C sample (inset: BJH pore size distribution).

The specific surface area and the carbon content of the tested samples have been obtained, as shown in Table 1. The carbon content of all the samples is higher than the theoretical carbon content (C/WC = 6.12 wt%), suggesting the inevitable existence of free carbon in the final product; the free carbon content increases with the increase of the carbonization temperature. The specific surface area of catalyst B is slightly higher than that of catalyst A due to the smaller particle size of catalyst B. The surface profile changes when the carbonization temperature is higher than 1000 °C. The specific surface area of WC shows a tendency to increase with increasing carbonization temperature. When the carbonization temperature increases to 1100 °C, the specific surface area of the WC reaches 41.297 m2 g−1. However, with further increase in temperature, the specific surface area of the WC decreases, due to particle agglomeration.

Table 1 The BET and carbon content of the products
The products C wt% in the product Free carbon wt% in the product BET (m2 g−1)
Catalyst A 6.66 0.54 19.754
Catalyst B 6.70 0.58 24.342
Catalyst C 7.10 0.98 41.297
Catalyst D 8.62 2.50 36.612
Catalyst E 8.66 2.54 31.295


Fig. 4 shows the thermogravimetry-differential thermal analysis (TG-DTA) of catalyst C measured under air atmosphere. The TG curve of catalyst C shows a significant increase at 425 °C, which indicates that the weight of the sample has increased. The weight of catalyst C remains stable above 670 °C. The DTA curve shows that the exothermic reaction occurs between 425 °C and 670 °C for catalyst C. The results show that the WC sample prepared by the low-temperature combustion synthesis method is stable under temperatures below 425 °C. When the temperature is higher than 425 °C, the WC sample reacts with oxygen to produce tungsten oxide, and apparent heat is given off. It is consistent with the results in the literature.22


image file: c5ra15394h-f4.tif
Fig. 4 DG-DTA curves of catalyst C.

Fig. 5 shows the XPS spectra for the surface composition of catalyst A. As shown in Fig. 5a, the spectrum of C 1s for catalyst A consists of a doublet with 284.68 eV and 282.7 eV binding energies, corresponding to amorphous carbon and WC. Fig. 5b shows the XPS spectrum of W 4f with peaks at 32.1 eV, 34.2 eV, and 38.1 eV, which are ascribed to WC, W2C, and WxOy, respectively. The existence of WxOy shows that the exposed sample was oxidized in air. The elemental content of the different surface products was characterized by XPS, as shown in Table 2. All tungsten carbide surfaces prepared at different carbonization temperatures have a high oxygen content. The surface elemental content obviously changes with the carbonization temperature. With the rise in carbonization temperature, the surface carbon content increases, but the oxygen content decreases. After a carbon atom is replaced by an oxygen atom, tungsten oxide can stabilize the surface of tungsten carbide. The passive oxide films are formed on the surface of the pure WC, so the corrosion resistance of the WC is significantly increased.23


image file: c5ra15394h-f5.tif
Fig. 5 XPS spectra of catalyst A: (a) C 1s peaks and (b) W 4f peaks.
Table 2 The surface element content of the different products
The products Atomic content (mole percentage, %)
C W O
Catalyst A 38 34 28
Catalyst B 40 34 26
Catalyst C 48 35 17
Catalyst D 53 35 12
Catalyst E 55 35 10


3.2 Electrocatalytic activity of the different catalysts

3.2.1 Polarization curves. Fig. 6 shows the linear polarization curves of the gas diffusion electrodes with the different catalysts. The polarization curves of the different electrodes are almost the same in the low potential area, indicating that the electrochemical performance of all catalysts is quite close, as seen in Fig. 6a and b. However, the electrode polarization current density of catalyst C is higher than those of the other electrodes in the high potential area. Thus, it can be concluded that catalyst C has a higher catalytic performance. These results indicate that catalyst C is an active catalyst for the ORR in alkaline solutions. Due to the high specific surface area of all the samples and the presence of moderate free carbon, catalyst C has a more catalytic active center, which facilitates mass transportation and ensures the accessibility of the reactant molecules.24 The catalytic activity of catalyst C is the highest amongst all samples. Therefore, more amorphous carbon in the WC will lower the activity of the catalysts,25 as shown for catalyst D and catalyst E.
image file: c5ra15394h-f6.tif
Fig. 6 Linear polarization curves of the gas diffusion electrodes with different catalysts (A–E): (a) neutral solution and (b) alkaline solution.

To further investigate these electrochemical properties, activated carbon and Pt gas diffusion electrodes were used to compare their electrocatalytic activity with that of the prepared catalyst C. As shown in Fig. 7, the polarization measurements of all the gas diffusion electrodes show no obvious distinction between −0.2 V and 0 V. In the high potential area, the polarization current density with catalyst C is higher than those for the activated carbon and Pt gas diffusion electrodes. The current density of the catalyst C gas diffusion electrode at −0.45 V is 220 mA cm−2, which is a little higher than that of the Pt gas diffusion electrode with a current density of 209 mA cm−2. Considering the high price of Pt catalysts, it is reasonable to believe that the WC catalyst is a good alternative to the Pt catalyst.


image file: c5ra15394h-f7.tif
Fig. 7 Linear polarization curves of the gas diffusion electrodes with catalyst C, Pt and activated carbon in the neutral solution.
3.2.2 Electrochemical impedance spectroscopy. Fig. 8 exhibits the EIS curves at 0.05 V (vs. SCE) with a test frequency range between 0.01 Hz and 10 kHz. The semicircle impedances show that the ORR charge transfer resistance (Rct) corresponds to the charge transfer step in neutral solution. It is clearly seen from Fig. 8a that the semicircle impedance of the catalyst C electrode is the smallest among all electrodes at the tested potential. Thus, it is reasonable to believe that catalyst C has a better catalytic activity than the other catalysts. Fig. 8b shows the corresponding Nyquist plots of the different electrodes in alkaline solution. All impedances of the electrodes present semicircles in the impedance test, which are similar to Fig. 8a. According to the size of the semicircle diameter, it can be concluded that ORR on the catalyst C electrode is more favorable. Catalyst C shows a better catalytic activity resulting from enhanced reaction kinetics.26 The results of the electrochemical impedance test show that the amorphous carbon content has an important effect on the catalytic activity of WC, which is consistent with the experimental polarization curves.
image file: c5ra15394h-f8.tif
Fig. 8 Impedance spectra of the gas diffusion electrodes with different catalysts (A–E); (a) neutral solution and (b) alkaline solution.

4. Conclusions

In summary, this work successfully prepared a mesoporous WC with a high catalytic activity and specific surface area by the low temperature combustion synthesis method. With increasing carbonization temperatures, the amorphous carbon content of the prepared WC increases. The presence of a moderate amount of oxygen is beneficial to improve the stability of the tungsten carbide. The as-prepared mesoporous WC nanoparticles exhibit excellent performances for the ORR, mainly due to the free carbon content and morphological characteristics of the mesoporous materials. This study clearly indicates that the amorphous carbon has an important effect on the catalytic activity of the WC catalysts.

Acknowledgements

Ping Li and Fuqiang Zhai thank the China Scholarship Council (CSC) for providing the scholarship.

References

  1. H. Meng and P. K. Shen, Electrochem. Commun., 2006, 8, 588–594 CrossRef CAS PubMed.
  2. H. Meng and P. K. Shen, Chem. Commun., 2005, 1, 4408–4410 RSC.
  3. M. Nie, H. L. Tang, Z. D. Wei, S. P. Jiang and P. K. Shen, Electrochem. Commun., 2007, 9, 2375–2379 CrossRef CAS PubMed.
  4. G. J. K. Acres, J. C. Frost, G. A. Hards, R. J. Poter, T. R. Ralph, D. Thompsett, G. T. Burstein and G. J. Hutchings, Catal. Today, 1997, 38, 393–400 CrossRef CAS.
  5. R. B. Levy and M. Boudart, Science, 1973, 181, 547–549 CAS.
  6. Z. J. Mellinger, T. G. Kelly and J. G. Chen, ACS Catal., 2012, 2, 751–758 CrossRef CAS.
  7. M. B. Zellner and J. G. Chen, J. Catal., 2005, 235, 393–402 CrossRef CAS PubMed.
  8. H. Chhina, S. Campbell and O. Kesler, J. Power Sources, 2007, 164, 431–440 CrossRef CAS PubMed.
  9. E. C. Weigert, A. L. Stottlemyer, M. B. Zellner and G. C. Jingguang, J. Phys. Chem. C, 2007, 111, 14617–14620 CAS.
  10. Z. Zhao, X. Fang, Y. Li, Y. Wang, P. K. Shen, F. Xie and X. Zhang, Electrochem. Commun., 2009, 11, 290–293 CrossRef CAS PubMed.
  11. J. Lemaitre, B. Vidick and B. Delmon, J. Catal., 1986, 99, 415–427 CrossRef CAS.
  12. B. Vidick, J. Lemaitre and B. Delmon, J. Catal., 1986, 99, 428–438 CrossRef CAS.
  13. G. Leclercq, M. Kamal, J. F. Lamonier, L. Feigenbaum, P. Malfoy and L. Leclercq, Appl. Catal., A, 1995, 121, 169–190 CrossRef CAS.
  14. G. Leclercq, M. Kamal, J. M. Giraudon, P. Devassine, L. Feigenbaum, L. Leclercq, A. Frennetb, J. M. Bastinb, A. Löfbergb, S. Deckerb and M. Dufourb, J. Catal., 1996, 158, 142–169 CrossRef CAS.
  15. Y. Hara, N. Minami and H. Itagaki, Appl. Catal., A, 2007, 323, 86–93 CrossRef CAS PubMed.
  16. J. P. Bosco, K. Sasaki, M. Sadakane, W. Ueda and J. G. Chen, Chem. Mater., 2010, 22, 966–973 CrossRef CAS.
  17. D. J. Ham, R. Ganesan and J. S. Lee, Int. J. Hydrogen Energy, 2008, 33, 6865–6872 CrossRef CAS PubMed.
  18. Z. Fu, Q. M. Huang, X. D. Xiang, Y. L. Lin, W. Wu, S. J. Hu and W. S. Li, Int. J. Hydrogen Energy, 2012, 37, 4704–4709 CrossRef CAS PubMed.
  19. P. Li, Z. W. Liu, L. Q. Cui, F. Q. Zhai, Q. Wan, Z. L. Li, Z. Z. Fang, A. A. Volinsky and X. H. Qu, Int. J. Hydrogen Energy, 2014, 39, 10911–10920 CrossRef CAS PubMed.
  20. J. F. Drillet, H. Bueb, U. Dettlaff-Weglikowska, R. Dittmeyer and S. Roth, J. Power Sources, 2010, 195, 8084–8088 CrossRef CAS PubMed.
  21. C. Tran, X. Q. Yang and D. Qu, J. Power Sources, 2010, 195, 2057–2063 CrossRef CAS PubMed.
  22. C. A. Ma, W. M. Zhang, G. H. Li, Y. F. Zheng, B. X. Zhou and D. H. Cheng, Acta Chim. Sin., 2005, 63, 1151–1154 CAS.
  23. K. C. Lee, A. Ishihara, S. Mitsushima, N. Kamiyaa and K. Ota, Electrochim. Acta, 2004, 49, 3479–3485 CrossRef CAS PubMed.
  24. H. Zheng, Z. Chen and Y. Li, Electrochim. Acta, 2013, 108, 486–490 CrossRef CAS PubMed.
  25. X. Yang, Y. C. Kimmel, J. Fu, B. E. Koel and J. G. Chen, ACS Catal., 2012, 2, 765–769 CrossRef CAS.
  26. E. H. Yu, K. Scott and R. W. Reeve, J. Electroanal. Chem., 2003, 547, 17–24 CrossRef.

This journal is © The Royal Society of Chemistry 2015
Click here to see how this site uses Cookies. View our privacy policy here.