New insights into self-modification of mesoporous titania nanoparticles for enhanced photoactivity: effect of microwave power density on formation of oxygen vacancies and Ti3+ defects

N. F. Jaafara, A. A. Jalil*bc, S. Triwahyonoa and N. Shamsuddinc
aDepartment of Chemistry, Faculty of Science, Universiti Teknologi Malaysia, 81310 UTM Johor Bahru, Johor, Malaysia
bCentre of Hydrogen Energy, Institute of Future Energy, Universiti Teknologi Malaysia, 81310 UTM Johor Bahru, Johor, Malaysia. E-mail: aishah@cheme.utm.my
cDepartment of Chemical Engineering, Faculty of Chemical Engineering, Universiti Teknologi Malaysia, 81310 UTM Johor Bahru, Johor, Malaysia

Received 29th July 2015 , Accepted 19th October 2015

First published on 19th October 2015


Abstract

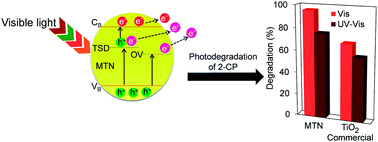
Mesoporous titania nanoparticles (MTN) were successfully prepared by a microwave (MW)-assisted method under various power densities. The catalysts were characterized by XRD, FT-IR, surface area analysis, TEM, and ESR. The characterization data indicated that higher power density increased the crystallinity and surface area of the MTN while decreasing the particle size and band-gap energy of the TiO2. Significantly, MW heating played an important role in formation of oxygen vacancies (OV) and Ti3+ site defects (TSD). The MTN (T1–T3) with 0.12, 0.37, and 0.56 W g−1 power density were found to degrade 84%, 88%, and 96% of 2-chlorophenol (2-CP) under visible light, respectively, compared to 69% by commercial TiO2. Besides narrowing the band gap, the OV and TSD also acted as electron acceptors that hindered the electron–hole recombination, as well as facilitated the charge carrier migration. The kinetics study over T3 showed that adsorption was the controlling step in the 2-CP degradation, which followed a pseudo-first-order Langmuir–Hinshelwood model. The photocatalytic reaction was still stable, even after five cycle runs without severe catalyst deactivation. This study demonstrates that the uniform heat distribution provided by MW is able to produce MTN that are rich with OV and TSD that are effective under visible light irradiation.

1. Introduction

The release of chemical contaminants produced by the industrial and agricultural sectors puts a large burden on the environment due to their toxicity and harmful effects, particularly to human health and aquatic life. Most of the aromatic compounds, such as benzene, xylene, chlorophenol, methyl orange, and malachite green, are hard to degrade and can cause fatal chronic diseases.1–3 Accordingly, many treatment methods have been used, including adsorption, coagulation, ion exchange, and electrochemical degradation, in order to avoid the environmental impact caused by the harmful and recalcitrant pollutants.4–7 However, these methods have several weaknesses, such as the large generation of secondary products and sludge production, as well as being costly and time consuming.8,9 Consequently, research activities focusing on developing methods for green and eco-friendly treatments are vital. The Advanced Oxidation Process (AOP) is a promising method, which usually uses heterogeneous photocatalytic inorganic semiconductors.10 The aim of AOP is to reduce the chemical contaminant and toxicity in wastewater that is to be reintroduced into streams, or at least into conventional and simple sewage treatment.

Recently, mesoporous materials, such as TiO2, SnO2, Al2O3, SiO2, and Fe2O3,4,11–16 have attracted much attention due to their high surface area and tunable pore diameter.17,18 Their numerous morphologies and compositions, including nanoparticles, powders, thin films, fibers, and monoliths, make them favorable for various applications, such as environmental energy, biotechnology, and medicine.19 Much effort has been made in development of transition metal oxides, especially TiO2, due to its potential for solving many serious environmental problems despite its drawbacks, including a high electron–hole recombination rate and a wide band gap that has restricted its efficiency.20

Nowadays, self-modified mesoporous titania nanoparticles (MTN) containing oxygen vacancies (OV) and Ti3+ site defects (TSD) are one of the strategies in light-absorption modification for TiO2 to increase its photocatalytic performance.21 In fact, various methods have been studied to synthesize the MTN, including high-temperature hydrogenation, sol–gel, plasma treatment, vacuum activation, and e-beam irradiation.22–25 However, these methods involve reduction conditions, uneven temperature distribution, and/or long reaction time.

Microwave (MW)-assisted methods have been demonstrated as being effective in the preparation of mesoporous materials. This method provides a uniform and fast reaction environment to produce materials with homogenous and dispersed morphology.26 Recently, we reported a simple MW-assisted method for the preparation of mesoporous silica nanoparticles (MSN), and its efficient use in ibuprofen adsorption and release.27 Besides lessening the conventional synthesis time, MW could enhance the crystal growth to improve the hexagonal order and range of silica that led to large surface areas, pore volume, and pore width.28 Anticipating that remarkable results could also be obtained from such materials, herein we report a preparation of MTN using a similar MW-assisted method, and studied its photoactivity toward degradation of 2-chlorophenol (2-CP). We found that different power densities gave different concentrations of TSD and OV in the MTN that affected the photoactivity. The MTN were characterized by XRD, FT-IR, surface area analysis, TEM, and ESR, and its structure is proposed. The photocatalytic performance, kinetics studies, and proposed mechanism, as well as regeneration of the catalysts, are also discussed. It is expected that by exploring this new simple synthesis method for formation of OV and TSD in TiO2, an understanding of the defect chemistry of metal oxides could be expanded.

2. Experimental

2.1. Reagents, material and apparatus

Titanium(IV) isopropoxide (TTIP) was bought from Sigma-Aldrich and commercial TiO2 powder catalyst JRC-TiO2-2 (TC) was supplied by the Catalysis Society of Japan. Cetyltrimethyl-ammonium bromide (CTAB), perchloric acid (HClO4), propanol and hydrochloric acid (HCl) were purchased from MERCK, Malaysia. Acetone was purchased from HmbG Chemical and methanol was purchased from RPE Reagent pure Erba. Sodium hydroxide (NaOH) and ammonium hydroxide (NH4OH) were purchased from QREC™ and 2-CP from Alfa Aesar, Germany with 99% purity.

2.2. Preparation of catalyst

The mesoporous TiO2 (MTN) was synthesized by the microwave-assisted process. 4.68 g of CTAB surfactant was dissolved in 720 mL distilled water, 120 mL propanol and 29 mL of 28% ammonia solution. The mixture was stirred continuously for 30 min at 323 K in water bath. After 30 min, the temperature of water bath was increased to 353 K followed by addition of 5.7 mL TTIP and this process was continued for 2 h in water bath in order to dissolve the mixture. The white solution was transfer into a beaker after 2 h of stirring and placed in the microwave. The microwave heating was conducted in a domestic microwave oven (Samsung ME711K), which can be operated with power ranging from 100–800 W and a frequency of 2.45 GHz. The heating was intermittently continued for 2 h in order to form a sol–gel of the TiO2. The power density of microwave were varied with 0.12, 0.37 and 0.56 W g−1 which then denoted as T1, T2 and T3, respectively. The obtained product was collected and dried overnight in oven before calcined at 873 K for 3 h.

2.3. Characterization

The crystalline structures of the catalysts were carried out using a Bruker Advance D8 X-ray powder diffractometer (XRD) with Cu Kα radiation (λ = 1.5418 Å) at 2θ angle ranging from 15° to 85°. The phases were identified with the aid of the Joint Committee on Power Diffraction Standard (JCPDS) files. The morphological properties of the catalysts were examined by transmission electron microscopy (TEM, JEOL JEM-2100F). The band gap of the catalysts were measured using UV-Vis diffuse reflectance spectra (UV-Vis DRS) which recorded over a range of wavelengths from 250 to 500 nm using a Perkin-Elmer Lambda 900 UV/VIS/NIR spectrometer with an integrating sphere. The chemical functional groups present in the catalysts were identified by FTIR spectroscopy (Perkin-Elmer Spectrum GX FTIR Spectrometer). IR absorbance data were obtained over a range of wavenumbers from 395 to 4000 cm−1. Nitrogen adsorption–desorption isotherms were used to determine the textural properties at liquid nitrogen temperatures using a SA 3100 Surface Analyzer (Beckman Coulter). The Brunnauer–Emmett–Teller (BET) and non-local density functional theory (NLDFT) methods were used to calculate surface area and pore distribution, respectively. Prior to measurement, all of the samples were degassed at 573 K and 0.1 Pa. The chemical oxidation state of the catalyst was determined using X-ray photoelectron spectroscopy (XPS) conducted on a Kratos Ultra spectrometer equipped with an Mg Kα radiation source (10 mA, 15 kV) over a range of binding energies from 0 to 800 eV. The surface defect Ti3+ and oxygen vacancy were also confirmed using JEOL JES-FA100 ESR spectrometer. The sample was placed about 2 cm height inside the glass vessel before carried out the ESR measurement to identify the g-value at room temperature. The photoluminescence (PL) (JASCO Spectrofluorometer) (FP-8500) with 150 W Xe lamp as excitation source was used to identify the photochemical properties, optical and electronic structure of the catalysts.

2.4. Photodegradation of 2-chlorophenol

The photoactivity of the catalysts was tested for the degradation of 2-CP. The photocatalytic experiments were performed in a batch reactor fixed with cooling system. A 36 W UV lamp (254 nm) and 39 W metal halide lamp (400 nm) were used for UV and visible light source, respectively. For photoactivity evaluation, 0.375 g L−1 of catalyst was added to the 2-CP solution with a desired concentration (200 mL) and stirred for 1 h in the dark to achieve adsorption–desorption equilibrium. The initial pH of the solution was pH 5 and the reaction was carried out at 303 K. Then, the reaction was carried out for another 6 h under light irradiation under continuous stirring. The concentration of 2-CP in the solution prior to irradiation was used as the initial value for the 2-CP degradation measurements.

During the reaction, aliquots of 2 mL were taken out at intervals of 30 min and centrifuged in a Hettich Zentrifugen Micro 120 at 55[thin space (1/6-em)]000 rpm for 15 minutes before being analyzed by UV-Vis spectrophotometry (Agilent Technologies, Cary 60 UV-Vis) for the residual concentration of 2-CP. Each set of experiments was performed triplicates. The adsorption band of 2-CP was taken at 274.5 nm and the degradation percentage was calculated using the following equation:

 
image file: c5ra15120a-t1.tif(1)
where Co and Ct are the initial concentration of 2-CP and the concentration at time t, respectively.

An Agilent Technologies 7820A Gas Chromatograph couple with an Agilent Technologies 5977E Mass Spectrometer Detector was used for detection of intermediates formed during photodegradation of 2-CP for mechanism proposed.

3. Results and discussion

3.1. Physicochemical properties of the prepared catalyst

Fig. 1 shows the XRD pattern of TiO2 prepared under various microwave power densities. A series of XRD peaks for the distinctive TiO2 anatase phase was observed (JCPDS file no. 01-086-1157) at 25.32°, 36.98°, 37.86°, 38.6°, 48.06°, 53.97°, 55.09°, 62.76°, 68.87°, 70.33°, 75.14°, and 82.76°, which corresponded to (101), (103), (004), (112), (200), (105), (211), (204), (116), (220), (215), and (224) planes, respectively. The peak intensity of TiO2 seemed to increase with increasing power density from 0.12 to 0.56 W g−1, signifying the improvement in their ordering without changing the structure. In fact, the TiO2 anatase phase was already formed during the microwave heating as confirmed by the XRD data obtained before the calcination (Fig. S1). The T3 exhibited the highest crystallinity may be due to the adequate heat distribution that enhanced the structural arrangement of the TiO2 during synthesis.29 The good adequate heat distribution at 0.56 W g−1 during the synthesis probably caused by the higher instantaneous microwave power density delivery, thus create higher microwave field which rapidly increase the temperature once microwaves coupled directly with the molecules of the entire reaction solution.30
image file: c5ra15120a-f1.tif
Fig. 1 XRD diffractrograms of TiO2 prepared under various microwave power densities.

The particles sizes of TiO2 were estimated using the Debye–Scherrer equation based on the major peak at 2θ = 25.32° as follows,

 
image file: c5ra15120a-t2.tif(2)
where τ is the particle size, λ is the wavelength of the X-ray radiation (Cu Kα = 0.1542 nm), k is the shape factor (k = 0.94), β is the line width at half-maximum height, and θ is the angular position of the peak maximum. As shown in Table 1, the increase in power density seemed to decrease the particle sizes of TiO2, as well as their band-gap energy, which was estimated using the following equation: E = 1240/λ (Fig. S2).31 Similar growth behavior was reported when nanosized ceria was prepared by a co-precipitation route.32 This may be due to the high hydration rate of the CTAB chains upon increasing the power density that enhanced the interaction with titanium species in the solution, along with increasing the rate of hydrolysis and polymerization of the TTIP source.27 The discrepancy of the band gap shift with the size quantization effect may be due to the large particle size of the MTN (>10 nm).33 While, the decrease in the band gap of MTN with the increasing power density most probably because of the bulk defects induced delocalization of the molecular orbitals in the conduction band edge (e.g. LUMO) and create shallow/deep traps in electronic energy, in turn causing the red-shift of the absorption spectra.

Table 1 Textural properties of catalysts
Catalyst Particle sizea (nm) Band gapb (eV) Microporous volumec (×10−3 cm3 g−1) Mesoporous volumed (cm3 g−1) Total pore volume (cm3 g−1) Surface area (m2 g−1)
a Particle size calculated using Debye–Scherrer equation at 2θ = 25.32°.b Band gap calculated using 1240/λ (see Fig. S2).c Microporous volume by using t-plot method.d Mesoporous volume determined by a formula: total pore volume − microporous volume.
T1 13.25 3.18 0.47 0.43 0.44 152
T2 12.24 3.12 1.15 0.41 0.42 161
T3 11.36 3.10 3.88 0.35 0.36 187
TC 3.22 0.00 0.10 0.10 10.5


Fig. 2 shows the TEM images of TiO2 prepared under microwave power densities of 0.12 W g−1 and 0.56 W g−1 for T1 and T3, respectively. The TEM images confirmed that the particles size of T1 (Fig. 2A) were larger than those of T3 (Fig. 2B), demonstrated that the higher power density produced smaller particle sizes of MTN. This result is in agreement with the calculated particle sizes listed in Table 1. According to Cai et al. (2014),34 heat treatment may inhibit the sintering effect, which probably decreases the particle size and improves the crystallinity of the catalyst.


image file: c5ra15120a-f2.tif
Fig. 2 TEM images of (A) T1 and (B) T3.

Fig. 3 shows the nitrogen adsorption–desorption isotherm of the MTN, and their pore size distribution. All the samples demonstrated isotherm type IV with an H3 hysteresis loop (Fig. 3A), confirming a typical adsorption profile for mesostructured material with slit-shaped pores that were non-uniform in size and/or shape.35,36 The hysteresis loop at P/Po = 0.6–0.99 is attributed to nitrogen condensation within interparticle voids that formed due to textural porosity between particles.37 Fig. 3B shows that the pore size distribution for all catalysts was in the range between 1.5 to 30 nm. T1 seemed to consist of the highest numbers of large pore sizes in the range 20–30 nm, followed by T2 and T3. This result shows that the rudimentary pore formation favorably occurred in the former compared to the latter TiO2.38


image file: c5ra15120a-f3.tif
Fig. 3 (A) Nitrogen adsorption–desorption isotherm and (B) pore distribution of TiO2 prepared under various microwave power densities.

All the pore structural parameters are shown in Table 1. The total pore volume slightly decreased and the surface area increased upon the increase in microwave power density. The enhancement in heat distribution might balance the hydrolysis and condensation, which increases the framework cross-linking for better growth of the smaller pores.39 The decrease in the number of mesopores may explain the decrease in particle sizes of MTN that led to its higher crystallinity.40

Next, the chemical properties of the catalysts were confirmed by FT-IR, and the spectra in the range 3780–395 cm−1 are shown in Fig. 4. All catalysts showed a band at 1630 cm−1, which is attributed to the OH vibration of the surface-adsorbed water (Fig. 4A).41 The bands observed at 1090 and 450 cm−1 were assigned to Ti–O–Ti asymmetric stretching and bending vibration modes, respectively, while the band at 960 cm−1 corresponded to the characteristic band of the titanium tetrahedral framework.42 The TC showed the absence of both Ti–O–Ti asymmetric stretching and a tetrahedral framework, verifying the noteworthy consequence of using microwave heating in the preparation of MTN. It could also be observed that the intense wide band of TC at 550 cm−1, which was attributed to the Ti–O–Ti vibration, was slightly shifted to a lower frequency at 450 cm−1 when the microwave was applied, signifying the different strength of Ti–O bonds due to the presence of oxygen adsorption, which gave different Ti–O bond saturation on the TiO2 surface.43 For clarity, the band intensities are summarized in Fig. 4B, based on the height intensity of the related bands in Fig. 4A. The band at 1090 cm−1 was increased considerably with the increasing power density, indicating the favorable growth of the Ti–O–Ti asymmetric stretching with the increasing heat distribution. The band at 450 cm−1 was slightly decreased when the power density was increased to 0.56 W g−1, which may be due to the high-temperature treatment weakening the Ti–O–Ti network and facilitating the Ti–O bond breakage.44


image file: c5ra15120a-f4.tif
Fig. 4 (A) FTIR spectra in range 395–2000 cm−1, (B) intensity of Ti–O–Ti and Ti-OH groups at 450 cm−1 and 1090 cm−1, (C) FTIR spectra in range 3700–3780 cm−1, and (D) intensity of hydroxyl groups at peak 3740 cm−1 of TiO2 commercial and TiO2 prepared under various microwave power densities.

In order to study the details of the hydroxyl groups involved in the framework, the MTN were evacuated at 673 K for 1 h prior to IR measurement, and the results are shown in Fig. 4C, and Fig. 4D summarizes the band intensities. The sharp band at 3740 cm−1, which is attributed to the hydroxyl groups that chemisorbed on the surface of the TiO2 framework,45 also increased with the increasing power density. The increasing numbers of Ti–O bond breaks by the increasing temperature may explain this enhancement. The absence of this band in the TC sample confirmed the significant property of MTN, which is expected to give an advantage in the photocatalytic reaction.

XPS analysis is performed to determine the chemical states of the TiO2. Fig. 5 shows the XPS spectra of Ti 2p3/2 and O1s with Gaussian fits for the T3 catalyst. The Ti 2p3/2 spectrum (Fig. 5A) can be fixed into four peaks which the peaks at 457.7 and 458.9 eV were assigned to Ti3+, while peaks at 458.35 and 459.3 eV were attributed to Ti4+.46 The O1s spectrum (Fig. 5B) showed the existence of Ti3+–O peaks at 530.8 and 532.5 eV, whereas peaks at 529.5 and 534.5 eV is attributed to Ti4+–O and hydroxide or hydroxyl group (OH), respectively.47 These results confirmed the existence of Ti3+ surface defect (TSD) in the MTN. The catalysts were also further confirmed by ESR and the results are shown in Fig. 5C. Two signals were observed at g = 1.99 and g = 1.96, which corresponded to oxygen vacancy (OV) and TSD sites, respectively.48 From the summary of both signal intensities for each catalyst shown in Fig. 5D, it could be observed that the TC showed the lowest numbers of both OV and TSD compared to MTN. The values of both properties for T1 and T2 increased proportionally with the increasing microwave power density with an almost equal degree for each property. Significantly, the OV for T3 seemed to increase considerably when the power density increased to 0.56 W g−1. These results signify a good prospective of the MTN because the photocatalyst depends mainly on the OV and TSD.49,50


image file: c5ra15120a-f5.tif
Fig. 5 (A) XPS spectra of Ti 2p3/2, (B) O1s region for T3, (C) ESR of TiO2 prepared under various microwave power densities and (D) intensity of signals at g = 1.99 and g = 1.97.

A mechanism for the formation of MTN is proposed as for the formation of mesoporous silica (Fig. S3). The CTAB will create a micellar system, which then being micellar rods and hexagonal array by the increasing concentration. The subsequent addition of a titanium source of TTIP into the prepared template formed a collection of nanosized spheres that are filled with a regular arrangement of pores after undergoing hydrolysis and condensation during the MW heating. The template was then removed by calcination to give a white powder of the MTN.

Based on the above characterization results, a reaction mechanism during the MW heating is proposed, as in Fig. 6. The increasing MW power density provided adequate aging to enhance the formation of Ti–O–Ti bonds for a tetrahedral framework, as well as terminal hydroxyl groups, as confirmed by the FT-IR results. The ESR data also demonstrated that the higher power density increased the formation of OV and TDS, which might be due to well condensation removed more surface oxygen to form OV, while generated electrons were readily trapped on the Ti4+ sites to form Ti3+.33,51,52 Higher the power density, the higher the uniformity of the heat distribution, which enhanced the number of oxygen vacancies.53 The TEM, XRD, and surface area analysis data verified that the increase in power density decreased the larger pore size and particle sizes that led to the higher surface area of the MTN. In addition, increasing power density also lowered the band gap. All these properties show the great potential of MTN to be used as a photocatalyst.


image file: c5ra15120a-f6.tif
Fig. 6 Proposed mechanism for formation of oxygen vacancy (OV) and Ti3+ defect sites (TDS).

3.2. Catalytic testing on photodegradation of 2-chlorophenol

3.2.1 Performance of the catalysts. The photocatalytic activity of MTN was tested on the degradation of 2-CP under both UV and visible light irradiation, and the results are shown in Fig. 7A. It was clearly observed that all the catalysts showed better performance under visible light than UV light. T3 demonstrated the highest degradation of 2-CP (96%), followed by T2, T1, and TC, with 88%, 84%, and 69%, respectively. This result confirmed the effectiveness of MTN compared to TC under visible light conditions in this degradation, which is likely due to their numbers of OV and TSD. The larger values of both properties, the higher the photoactivity. Both properties may have acted as electron acceptors, which lessen the electron–hole recombination and enhances the photoactivity.45,54,55 The TSD and OV could also adsorb O2, which acts as a promoter in the oxidation of 2-CP for efficient photodegradation.56,57 Under visible light irradiation, the formation of electron–hole pairs increased due to the excitation of electrons from both valance band (VB) and TSD. However, this phenomenon did not to occur under UV irradiation since the energy of the UV irradiation is much higher and capable to excite directly the electron from the VB to the conduction band (CB). Similar phenomenon was reported in the degradation of dibenzothiophene over C/TiO2@MCM-41.58 In addition, the descending band gap listed in Table 1 for T1–T3, as compared to TC, also led to a synergistic effect in this photodegradation. Their crystallinity, structure, topology, and surface area also supported these results.
image file: c5ra15120a-f7.tif
Fig. 7 (A) Photocatalytic performance of TiO2 commercial and TiO2 prepared under various microwave power densities and (B) photodegradation kinetics of 2-CP using T3 at different initial concentrations (a) 10 mg L−1, (b) 30 mg L−1, (c) 50 mg L−1, (d) 70 mg L−1 and (e) 100 mg L−1. [C2-CP = 50 mg L−1, pH = 5, W = 0.375 g L−1, t = 6 h, 30 °C].
3.2.2 Kinetic studies. The photocatalytic degradation of 2-CP under different initial concentrations in the range of 10–100 mg L−1 was investigated over T3, and the results are shown in Table 2. The 2-CP was completely degraded when the initial concentrations were 10 and 30 mg L−1 within 90 and 270 min, respectively. However, increasing the initial concentration seemed to decrease the degradation, which was most probably due to the increasing 2-CP molecules inhibiting the light penetration and reducing the production of active hydroxyl radical species. The kinetics of degradation of 2-CP over T3 was then analyzed by the Langmuir–Hinshelwood model,59 and the linear plot of ln(C0/Ct) vs. irradiation time is shown in Fig. 7B. The straight line demonstrates that the photodegradation follows first-order kinetics.15 The decrease of kapp values with increasing initial concentration indicates that the system was favorable at low concentrations.60
Table 2 Percentage degradation at different initial concentration of 2-CP and pseudo-first-order apparent constant values for 2-CP degradation using T3 [pH = 5, W = 0.375 g L−1, t = 6 h, 30 °C]
Initial 2-CP concentration, Co Degradation, (%) Reaction rate, kapp (×10−2 min−1) Initial reaction rate, ro (mg L−1 min−1)
10 100 (90 min) 4.44 0.44
30 100 (270 min) 1.67 0.50
50 96 0.72 0.36
70 88 0.56 0.39
100 81 0.43 0.43


The calculated values of kr (reaction rate constant) and KLH (adsorption coefficient of reactant) for T3 were found to be 2.7541 mg L−1 min−1 and 0.1497 L mg−1, respectively. The value of kr was greater than KLH, signifying that adsorption of 2-CP was the controlling step of the process.61,62 A comparison study on photodegradation of various pollutants over mesoporous TiO2 photocatalysts prepared by different methods was tabulated in Table 3. It clearly shows that the MTN prepared by microwave-assisted method is comparable with other mesoporous TiO2 catalysts.

Table 3 Comparison of photocatalytic activity of various pollutants over mesoporous TiO2 photocatalysts prepared by different methods
Catalyst Method preparation Pollutant Initial conc. (mg L−1) Dosage (g L−1) Contact time (h) Degradation (%) Ref.
3D mesoporous TiO2 microsphere Solvothermal Bisphenol A 20 0.5 1 99.7 63
Macro-mesoporous TiO2–graphene Evaporation-induced self-assembly Methylene blue 3 1.5 86.8 64
Mesoporous TiO2 Evaporation-induced self-assembly 4-Chlorophenol 30 2.8 3 100 65
Mesoporous TiO2 nanosphere Sol–gel 4-Chlorophenol 20 0.5 4 96 66
Porous TiO2 Precipitation polymerization Rhodamine B 10 1 0.5 100 67
Mesoporous TiO2 Hydrothermal-assisted sol–gel Dimethyl phthalate 2 3 2 90 68
Mesoporous TiO2 Hydrothermal sol–gel Methylene blue 50 1 1 100 69
MTN Microwave-assisted 2-Chlorophenol 50 0.375 6 96 This study


3.2.3 Regeneration of the catalyst. The regeneration of the catalyst toward 2-CP degradation was carried out by a repeated experiment over T3 (Fig. 8). The catalyst was still active with only a slight decrease from 91% to 82% even after five repetitions, which may be due to the decrease in the surface area as a consequence of heat treatment.70 This result shows that the T3 has great potential to be used as a catalyst for various applications, especially for photocatalytic degradation of organic pollutions.
image file: c5ra15120a-f8.tif
Fig. 8 Reusability performance of T3 [C2-CP = 50 mg L−1, pH = 5, W = 0.375 g L−1, t = 6 h, 30 °C].
3.2.4 Proposed 2-CP degradation mechanism by MTN. In order to investigate the mechanism of 2-CP degradation using MTN, the effect of scavenging agents was studied using three important active species: sodium oxalate (SO), potassium peroxodisulfate (PP), and potassium iodide (PI), as a scavenger for photogenerated holes (h+), photogenerated electrons, and hydroxyl radicals adsorbed on the catalyst surface (OH˙ads), respectively.71 Fig. S4 shows that the degradation efficiency of 2-CP decreased to 53%, 95%, and 61% by the addition of SO, PP, and PI, respectively. However, PP did not appear to affect the degradation at all, demonstrating the minor role of electrons as compared to the others.

Based on the above results, the possible mechanism for degradation of 2-CP over MTN is proposed in Fig. 9. Generally, the visible light irradiation led to the photogenerated electrons being transferred from the VB to the CB (eqn (3)).

 
TiO2 + → TiO2 + hVB+ + eCB (3)


image file: c5ra15120a-f9.tif
Fig. 9 Proposed mechanism for degradation of 2-CP using MTN.

However, in this study, the migration of electrons was inhibited by the presence of TSD and OV. This was confirmed by the insignificant scavenger effect of electrons in the photodegradation. Instead, the generated holes in the VB play a key role in oxidizing the H2O or absorbed OH groups on the surface of TiO2 to generate OH˙ (eqn (4) and (5)), support by TSD which also act as charge-carrier migration.

 
hVB + H2O → OH˙ + H+ (4)
 
hVB + OH → OH˙ (5)

The excited electrons on TSD, OV, and CB also participated in the reduction of O2 to produce superoxide anion radicals, O2˙ (eqn (6)), which finally generated OH˙ (eqn (7)) to mineralize 2-CP partially or completely (eqn (8)). The details of the total mineralization of 2-CP to CO2 and H2O is proposed in Fig. S5.

 
O2 + eCB → O2˙ (6)
 
O2˙ + H+ → OOH˙ → OH˙ (7)
 
OH˙ + 2-CP → degraded 2-CP (8)

This study shows the significant roles of TSD and OV in the TiO2, which contributed synergistic effects to narrowing the band gap and facilitating the charge carrier migration, while also being electron acceptors to hinder the electron–hole recombination.

4. Conclusions

In conclusion, MTN were prepared by a MW-assisted method under various microwave power densities, and were successfully used in the photodegradation of 2-CP. The physicochemical properties of the MTN were studied via XRD, FT-IR, surface area analysis, TEM, and ESR. It was clearly observed that higher power density increased the uniformity of heat distribution and provided a good aging to enhance the formation of Ti–O–Ti bonds. The particle sizes of the MTN were reduced, and the pore structure became smoother. Significantly, the formation of TSD and OV also increased because the condensation occurred during MW heating plays an important role in removing the oxygen surface to form OV, as well as reducing the Ti4+ to Ti3+ sites. All the prepared catalysts showed better performance under visible light rather than UV light, with T1, T2, and T3 leading to 84%, 88%, and 96% degradation of 2-CP, respectively, as compared to commercial TiO2 (69%). Besides lowering the band-gap energy of the catalysts under visible light, the OV and TSD also eased the charge carrier migration and inhibited the electron–hole recombination rate to increase the photocatalytic efficiency.72,73 The kinetic study indicated that degradation of 2-CP using T3 followed a pseudo-first-order Langmuir–Hinshelwood model with the value of kr (2.7541 mg L−1 min−1) being greater than KLH (0.1497 L mg−1), suggesting that adsorption was the controlling step in the process. The regeneration study demonstrated that the photocatalytic activity was still stable after five cycles with only a slightly decrease in the degradation of 2-CP. Therefore, the MW-assisted method is may contribute to the synthesis of various mesoporous materials with distinctive properties for various applications.

Acknowledgements

The authors are grateful for the financial support by the Fundamental Research Grant Scheme (4F161), awards of MyPhD Scholarship (Nur Farhana Jaafar) from the Ministry of Higher Education Malaysia and to the Hitachi Scholarship Foundation for their support.

References

  1. N. F. Jaafar, A. A. Jalil, S. Triwahyono, J. Efendi, R. R. Mukti, R. Jusoh, N. W. C. Jusoh, A. H. Karim, N. F. M. Salleh and V. Suendo, Appl. Surf. Sci., 2015, 338, 75 CrossRef CAS PubMed.
  2. A. A. Jalil, M. A. H. Satar, S. Triwahyono, H. D. Setiabudi, N. H. N. Kamarudin, N. F. Jaafar, N. Sapawe and R. Ahamad, J. Electroanal. Chem., 2013, 701, 50 CrossRef CAS PubMed.
  3. A. A. Jalil, S. Triwahyono, S. H. Adam, N. D. Rahim, M. A. A. Aziz, N. H. H. Hairom, N. A. M. Razali, M. A. Z. Abidin and M. K. A. Mohamadiah, J. Hazard. Mater., 2010, 181, 755 CrossRef CAS PubMed.
  4. A. H. Karim, A. A. Jalil, S. Triwahyono, N. H. N. Kamarudin and A. Ripin, J. Colloid Interface Sci., 2014, 421, 93 CrossRef CAS PubMed.
  5. H. Eskandarloo, A. Badiei, M. A. Behnajady and G. M. Ziarani, RSC Adv., 2014, 4, 28587 RSC.
  6. J. S. Wu, L. H. Liu, K. H. Chu and S. Y. Suen, J. Membr. Sci., 2008, 309, 239 CrossRef CAS PubMed.
  7. V. K. Gupta, M. A. Khayat, A. K. Singh and M. K. Pal, Anal. Chim. Acta, 2009, 634, 36 CrossRef CAS PubMed.
  8. Z. Zhang, Y. Xu, X. Ma, F. Li, D. Liu, Z. Chen, F. Zhang and D. D. Dionysiou, J. Hazard. Mater., 2012, 209–210, 271 CrossRef CAS PubMed.
  9. N. W. C. Jusoh, A. A. Jalil, S. Triwahyono, A. H. Karim, N. F. Salleh, N. H. R. Annuar, N. F. Jaafar, M. L. Firmansyah, R. R. Mukti and M. W. Ali, Appl. Surf. Sci., 2015a, 330, 10 Search PubMed.
  10. R. Jusoh, A. A. Jalil, S. Triwahyono, A. Idris, S. Haron, N. Sapawe, N. F. Jaafar and N. W. C. Jusoh, Appl. Catal., A, 2014, 469, 33 CrossRef CAS PubMed.
  11. X. Yang, J. Qin, Y. Jiang, R. Li, Y. Li and H. Tang, RSC Adv., 2014, 4, 18627 RSC.
  12. M. B. Zakaria, N. Suzuki, K. Shimasaki, N. Miyamoto, Y. T. Huang and Y. Yamauchi, J. Nanosci. Nanotechnol., 2012, 12, 4502 CrossRef CAS PubMed.
  13. T. Kamegawa, Y. Ishiguro, H. Seto and H. Yamashita, J. Mater. Chem. A., 2015, 3, 2323 CAS.
  14. D. P. Wang and H. C. Zeng, Chem. Mater., 2011, 23, 4886 CrossRef CAS.
  15. N. W. C. Jusoh, A. A. Jalil, S. Triwahyono and C. R. Mamat, Appl. Catal., A, 2015b, 492, 169 Search PubMed.
  16. T. Togashi, T. Naka, S. Asahina, K. Sato, S. Takami and T. Adschiri, Dalton Trans., 2011, 40, 1073 RSC.
  17. A. Mitra, A. Bhaumik and B. K. Paul, Microporous Mesoporous Mater., 2008, 109, 66 CrossRef CAS PubMed.
  18. B. Sun, G. Zhou, C. Shao, B. Jiang, J. Pang and Y. Zhang, Powder Technol., 2014, 256, 118 CrossRef CAS PubMed.
  19. J. L. V. Escoto, Y. D. Chiang, K. C. W. Wu and Y. Yamauchi, Sci. Technol. Adv. Mater., 2012, 13(013003), 1 Search PubMed.
  20. Y. Liu, G. Ji, M. A. Dastageer, L. Zhu, J. Wang, B. Zhang, X. Chang and M. A. Gondal, RSC Adv., 2014, 4, 56961 RSC.
  21. Y. Xie, Y. Li and X. Zhao, J. Mol. Catal. A: Chem., 2007, 277, 119 CrossRef CAS PubMed.
  22. S. Hoang, S. P. Berglund, N. T. Hahn, A. J. Bard and C. B. Mullins, J. Am. Chem. Soc., 2012, 134, 3659 CrossRef CAS PubMed.
  23. Z. K. Zhang, M. L. Bai, D. Z. Guo, S. M. Hou and G. M. Zhang, Chem. Commun., 2011, 47, 8439 RSC.
  24. Y. Zheng, X. X. Wu, L. He and W. C. Zheng, J. Phys. Chem. Solids, 2007, 68(9), 1652 CrossRef CAS PubMed.
  25. G. D. Bromiley and A. A. Shiryaev, Phys. Chem. Miner., 2006, 33(6), 426 CrossRef CAS.
  26. M. Shi, L. Kang, Y. Jiang and C. Ma, Catal. Lett., 2014, 144, 278 CrossRef CAS.
  27. N. H. N. Kamarudin, A. A. Jalil, S. Triwahyono, V. Artika, N. F. M. Salleh, A. H. Karim, N. F. Jaafar, M. R. Sazegarb, R. R. Mukti, B. H. Hameed and A. Johari, J. Colloid Interface Sci., 2014, 421, 6 CrossRef CAS PubMed.
  28. N. H. N. Kamarudin, A. A. Jalil, S. Triwahyono, M. R. Sazegar, S. Hamdan, S. Baba and A. Ahmad, RSC Adv., 2015, 5, 30023 RSC.
  29. S. Yuan, Q. Sheng, J. Zhang, H. Yamashita and D. He, Microporous Mesoporous Mater., 2008, 110, 501 CrossRef CAS PubMed.
  30. S. Acharya and K. Singh, Microwave-assisted chemical reduction routes for direct synthesis of (fct) L 10 phase of Fe–Pt, J. Microw. Power Electromagn. Energy, 2011, 45, 63 Search PubMed.
  31. T. S. Natarajan, H. C. Bajaj and R. J. Tayade, CrystEngComm, 2015, 17, 1037 RSC.
  32. G. Yang, H. H. Ko, Y. W. Hsu, K. H. Yang, M. C. Wang, J. Han and X. Jhao, Ceram. Int., 2013, 39, 6805 CrossRef CAS PubMed.
  33. H. Lin, C. P. Huang, W. Li, C. Ni, S. I. Shah and Y. H. Tseng, Appl. Catal., B, 2006, 68, 1 CrossRef CAS PubMed.
  34. W. Cai, P. R. de la Piscina, J. Toyir and N. Homs, Catal. Today, 2015, 242, 193 CrossRef CAS PubMed.
  35. W. Gac, Appl. Catal., B, 2007, 75, 107 CrossRef CAS PubMed.
  36. Y. Wang, H. Sun, H. M. Ang, M. O. Tadé and S. Wang, Appl. Catal., B, 2015, 164, 159 CrossRef CAS PubMed.
  37. A. H. Karim, A. A. Jalil, S. Triwahyono, N. H. N. Kamarudin and A. Ripin, J. Colloid Interface Sci., 2014, 421, 93 CrossRef CAS PubMed.
  38. A. B. Bogeat, M. A. Franco, C. F. González and V. G. Serrano, Fuel Process. Technol., 2014, 126, 95 CrossRef PubMed.
  39. Y. Mori and T. J. Pinnavaia, Chem. Mater., 2001, 13, 2173 CrossRef CAS.
  40. Y. Sakatani, D. Grosso, L. Nicole, C. Boissière, G. J. de A. A. Soler-Illia and C. Sanchez, J. Mater. Chem., 2006, 16, 77 RSC.
  41. B. Mazinani, A. K. Masrom, A. Beitollahi and R. Luque, Ceram. Int., 2014, 40, 11525 CrossRef CAS PubMed.
  42. L. Todan, T. Dascalescu, S. Preda, C. Andronescu, C. Munteanu, D. C. Culita, A. Rusu, R. State and M. Zaharescu, Ceram. Int., 2014, 40, 15693 CrossRef CAS PubMed.
  43. T. Bezrodna, G. Puchkovska, V. Shymanovska, J. Baran and H. Ratajczak, J. Mol. Struct., 2004, 700, 175 CrossRef CAS PubMed.
  44. V. Etacheri, S. C. Pillai, M. K. Seery and S. J. Hinder, Adv. Funct. Mater., 2011, 21, 3744 CrossRef CAS PubMed.
  45. B. Neppolian, Q. Wang, H. Yamashita and H. Choi, Appl. Catal., A, 2007, 333, 264 CrossRef CAS PubMed.
  46. M. M. Khan, S. A. Ansari, D. Pradhan, M. O. Ansari, D. H. Han, J. Lee and M. H. Cho, J. Mater. Chem. A, 2014, 2, 637 CAS.
  47. C. N. Huang, J. S. Bow, Y. Zheng, S. Y. Chen, N. J. Ho and P. Shen, Nanoscale Res. Lett., 2010, 5, 972 CrossRef CAS PubMed.
  48. L. B. Xiong, J. L. Li, B. Yang and Y. Yu, J. Nanomater., 2012, 2012, 1 CrossRef PubMed.
  49. T. W. Kim, D. U. Lee and Y. S. Yoon, J. Appl. Phys., 2000, 88, 3759 CrossRef CAS PubMed.
  50. H. Liu, H. T. Ma, X. Z. Li, W. Z. Li, M. Wu and X. H. Bao, Chemosphere, 2003, 50(1), 39 CrossRef CAS.
  51. H. C. Genuino, D. B. Hamal, Y. J. Fu and S. L. Suib, J. Phys. Chem. C, 2012, 116, 14040 CAS.
  52. S. Sato, Chem. Phys. Lett., 1986, 123, 126 CrossRef CAS.
  53. D. A. Panayotov and J. R. Morris, J. Phys. Chem. C, 2009, 113, 15684 CAS.
  54. J. Yu, X. Zhao and Q. Zhao, Mater. Chem. Phys., 2001, 69, 25 CrossRef CAS.
  55. X. Pan, M. Q. Yang, X. Fu, N. Zhang and Y. J. Xu, Nanoscale., 2013, 5, 3601 RSC.
  56. N. W. C. Jusoh, A. A. Jalil, S. Triwahyono, H. D. Setiabudi, N. Sapawe, M. A. H. Satar, A. H. Karim, N. H. N. Kamarudin, R. Jusoh, N. F. Jaafar, N. Salamun and J. Efendi, Appl. Catal., A, 2013, 468, 276 CrossRef CAS PubMed.
  57. K. Suriye, P. Praserthdam and B. Jongsomjit, Appl. Surf. Sci., 2007, 253, 3849 CrossRef CAS PubMed.
  58. M. Zarrabi, M. H. Entezari and E. K. Goharshadi, RSC Adv., 2015, 5, 34652 RSC.
  59. N. Sapawe, A. A. Jalil and S. Triwahyono, Chem. Eng. J., 2013a, 225, 254 Search PubMed.
  60. N. Sapawe, A. A. Jalil, S. Triwahyono, R. N. R. A. Sah, N. W. C. Jusoh, N. H. H. Hairom and J. Efendi, Appl. Catal., A, 2013b, 456, 144 Search PubMed.
  61. N. Sapawe, A. A. Jalil, S. Triwahyono, S. H. Adam, N. F. Jaafar and M. A. H. Satar, Appl. Catal., B, 2012, 125, 311 CrossRef CAS PubMed.
  62. J. Cunningham and G. Al-Sayyed, J. Chem. Soc., Faraday Trans., 1990, 86, 3935 RSC.
  63. C. Guo, M. Ge, L. Liu, G. Gao, Y. Feng and Y. Wang, Environ. Sci. Technol., 2010, 44, 419 CrossRef CAS PubMed.
  64. J. Du, X. Lai, N. Yang, J. Zhai, D. Kisailus, F. Su, D. Wang and L. Jiang, ACS Nano, 2011, 5, 590 CrossRef CAS PubMed.
  65. O. A. García, J. E. Valencia, R. Romero, J. L. R. Cerda and R. Natividad, Int. J. Photoenergy, 2014, 2014, 1 CrossRef PubMed.
  66. J. A. R. Herrera, R. A. Frenzel, M. N. Blanco and L. R. Pizzio, J. Photochem. Photobiol., A, 2014, 289, 22 CrossRef PubMed.
  67. X. Li, G. Sun, Y. Li, J. C. Yu, J. Wu, G. H. Ma and T. Ngai, Langmuir, 2014, 30, 2676 CrossRef CAS PubMed.
  68. J. Liu, T. An, G. Li, N. Bao, G. Sheng and J. Fu, Microporous Mesoporous Mater., 2009, 124, 197 CrossRef CAS PubMed.
  69. D. S. Kim and S. Y. Kwak, Appl. Catal., A, 2007, 323, 110 CrossRef CAS PubMed.
  70. N. F. Jaafar, A. A. Jalil, S. Triwahyono, M. N. M. Muhid, N. Sapawe, M. A. H. Satar and H. Asaari, Chem. Eng. J., 2012, 191, 112 CrossRef CAS PubMed.
  71. R. Jusoh, A. A. Jalil, S. Triwahyono and N. H. N. Kamarudin, RSC Adv., 2015, 5, 9727 RSC.
  72. W. Wang, C. Lu, Y. Ni, M. Su and Z. Xu, Appl. Catal., B, 2012, 127, 28 CrossRef CAS PubMed.
  73. F. Zuo, L. Wang, T. Wu, Z. Zhang, D. Borchardt and P. Feng, J. Am. Chem. Soc., 2010, 132, 11856 CrossRef CAS PubMed.

Footnote

Electronic supplementary information (ESI) available. See DOI: 10.1039/c5ra15120a

This journal is © The Royal Society of Chemistry 2015