DOI:
10.1039/C5RA15074D
(Paper)
RSC Adv., 2015,
5, 75857-75862
(−) and (+)-Merrilliaquinone, a pair of new quinone enantiomers from Illicium merrillianum and their distinctive effect on human hepatoma and hepatic cells
Received
29th July 2015
, Accepted 24th August 2015
First published on 2nd September 2015
Abstract
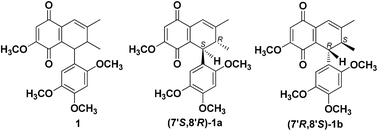
Merrilliaquinone (1), a new racemic quinone was isolated from the branches and leaves of Illicium merrillianum. Chiral separation of 1 gave two enantiomers (−)-merrilliaquinone (1a) and (+)-merrilliaquinone (1b). The structure of 1 was established by comprehensive spectroscopic analysis, and the absolute configurations of 1a and 1b were determined by quantum mechanical calculation of ECD spectra. It is very interesting that 1b had a selective cytotoxicity against human hepatoma cell lines SMMC7721 and HuH7 with IC50 values of 0.91 μM and 1.29 μM, while its IC50 values on normal human hepatic cells QSG7701 and LO2 were 47.79 μM and 36.71 μM, respectively. Moreover, 1a and racemate 1 only exhibited very weak cytotoxicity against SMMC7721 and HuH7 cells with IC50 values of 27.01–37.82 μM. These results implied that the absolute configurations of 1a and 1b possess remarkable influences on their cytotoxicities. Further mechanism studies indicated that 1b dose-dependently induced SMMC7721 cell apoptosis and reduction of mitochondrial membrane potential (MMP) at 1–10 μM. Flow cytometry analysis showed that the 1b-induced SMMC7721 cell apoptosis was associated with cell cycle arrest during the G0/G1 phase.
Introduction
Natural products are rich sources of lead compounds for drug discovery due to their unique structure and bioactivities,1 and more than 50% of the drugs used clinically are from natural products and their derivatives.2,3 For example, podophyllotoxin is an approved drug in China to treat epidermal and throat dendritic cancer, and paclitaxel is clinically used for ovarian and breast cancer. Hepatocellular carcinoma (HCC) is one of the most lethal cancers worldwide and the third leading cause of cancer-related death.4 The most common treatment of HCC is surgical resection, liver transplantation,5 chemotherapy and radiotherapy.6 Despite the great progress in diagnostic and therapeutic methods during the past decades, the prognosis of HCC remains poor. Therefore exploring novel chemotherapeutic agents with better efficacy and less toxicity from natural products is very necessary for improving HCC outcomes.
Illicium merrillianum is a shrub or small tree indigenous to southwest of China and Burma, and locally used as an antirheumatic agent.7 We have previously reported four cytotoxic diterpenoids from I. merrillianum.8 In our continuing effort to find new bioactive compounds, a new racemic quinone merrilliaquinone (1) was isolated from the branches and leaves of I. merrillianum, subsequent chiral separation of 1 gave two enantiomers (−)-merrilliaquinone (1a) and (+)-merrilliaquinone (1b) (Fig. 1). Interestingly, the MTT assay demonstrated that 1b had remarkable cytotoxicity against human hepatoma cell lines SMMC7721 and HuH7 with IC50 values of 0.91 μM and 1.29 μM, respectively, but showed no apparent cytotoxicity on normal human hepatic cells QSG7701 and LO2. While its enantiomer 1a and the racemate 1 had very weak cytotoxicity on SMMC7721 and HuH7 cells. Further investigation showed that 1b dose-dependently induced SMMC7721 cells apoptosis and arrested the cell cycle of SMMC7721s cell at G0/G1 phase.
 |
| Fig. 1 Chemical structures of 1, 1a, 1b isolated from I. merrillicium and (7′R,8R,8′S)-7′-(2′,4′,5′-trimethoxyphenyl)-4,7α,8-trimethoxy-8,8′-dimethyl-2,5-quinone (2). | |
Herein, we describe the isolation, structural elucidation, absolute configuration determination by quantum chemical computation of ECD spectra, cytotoxicity evaluation of compounds 1, 1a and 1b on SMMC7721, HuH7, QSG7701 and LO2 cells, as well as 1b-induced cell apoptosis assay and cell cycle progression in 1b-treated SMMC7721 cells.
Results and discussion
The petroleum ether soluble part of the EtOH extract from the branches and leaves of I. merrillianum was fractionated by silica gel column chromatography followed by repeated reversed phase medium pressure liquid chromatography to afford compound 1.
Compound 1 obtained as red powder. The IR spectrum of 1 indicated the presence of characteristic absorption bands for C
C and C
O at 1505, 1574, and 1648 cm−1. The HRESIMS spectrum gave a pseudo-molecular-ion peak [M + Na]+ at m/z = 407.1518 (calcd 407.1471), corresponding to a molecular formula C22H24O6Na with eleven degrees of unsaturation.
The 1H NMR of 1 displayed two olefinic protons at δH = 5.83, 6.40 ppm, two aromatic protons at δH = 6.40, 6.50 ppm, and one methyl and four methoxyl signals at δH = 1.81, 3.59, 3.73, 3.79, 3.85 ppm. An interpretation of the 13C, DEPT and HSQC NMR spectra of 1 revealed 22 carbon atoms, including two carbonyl groups at δC = 181.3 and 186.3 ppm, eight quaternary carbon atoms at δC = 121.0, 132.2, 137.1, 142.7, 148.7, 150.8, 153.1, 159.4 ppm, six methine groups at δC = 34.8, 41.2, 98.7, 106.0, 111.9, 113.1 ppm, six methyl groups at δC = 19.3, 23.2, 56.0, 56.1, 56.9, 56.9 ppm. The above spectroscopic data was very similar to those of (7′R,8R,8′S)-7′-(2′,4′,5′-trimethoxyphenyl)-4,7α,8-trimethoxy-8,8′-dimethyl-2,5-quinone (2) isolated from Acorus gramineus (Fig. 1).9 The differences between them was the absence of an oxygenated methine for C-7 at δC = 70.7 ppm, an oxygenated quaternary carbon for C-8 at δC = 76.9 ppm, and two methoxyls at δC = 49.6, 58.6 ppm in 2, those signals were replaced by one olefinic methine at δC = 113.1 ppm and one olefinic quaternary carbon at δC = 153.1 ppm in 1, implying that one tri-substituted double bond was assigned to be at C-7 and C-8 positions in 1. The above speculation was further confirmed by the HMBC correlations of 7-H (δH = 6.40 ppm) with C-1 (δC = 132.2 ppm), C-2 (δC = 186.3 ppm), C-6 (δC = 137.1 ppm), C-8 (δC = 153.1 ppm), and 9-H3 (δH = 1.81 ppm) with C-7 (δC = 113.1 ppm). Additionally, the HMBC correlations of 7-H, 3-H (δH = 5.83 ppm) to C-2, and 7′-H (δH = 4.39 ppm), 3-H to C-5 (δC = 181.3 ppm) also attributed the positions of the two carbonyl groups to be at C-2 and C-5 (Fig. 2). Thus, the structure of 1 was identified as 7′-(2′,4′,5′-trimethoxyphenyl)-4-methoxy-8,8′-dimethyl-2,5-quinone, and named merrilliaquinone.
 |
| Fig. 2 Key HMBC and NOESY correlations of 1. | |
In the NOESY spectrum of 1, the correlation of 7′-H (δH = 4.39 ppm) with 9′-H3 (δH = 1.07 ppm) established the relative configuration of 1 (Fig. 2). However, the lack of optical activity of 1 ([α]D25 of 1 (c 0.30, MeOH) was 0.015) indicated that it might be racemic. In order to clearly understand the absolute configuration and bioactivity of each enantiomer, we separated 1 on a chiral column,10 and obtained two enantiomers (−)-merrilliaquinone (1a) and (+)-merrilliaquinone (1b) with opposite optical rotations ([α]D25 −11.7 for 1a; [α]D25 +12.0 for 1b (c 0.30, MeOH)) and Cotton effects (Fig. 4).
 |
| Fig. 3 Optimized geometries of main conformers of 1a. | |
 |
| Fig. 4 Experimental CD spectra of 1a and 1b in methanol and the calculated ECD spectra of (7′S,8′R)-1a and (7′R,8′S)-1b. | |
The absolute configurations of (−)-merrilliaquinone (1a) and (+)-merrilliaquinone (1b) were determined by comparison of the experimental CD spectra with the calculated ECD spectra generated by time-dependent density functional theory (TDDFT) for (7′S,8′R)-1a and (7′R,8′S)-1b in Gaussian 03 software.11,12 Because of the rigid structure of 1 and the relative configuration established by NOESY experiment, the arbitrarily assigned absolute configuration of 7′S,8′R for 1a was geometrically optimized by using time dependent density functional theory (TDDFT) at B3LYP/6-31G level to afford two preferred conformers 1aC1 and 1aC2 (Fig. 3). The conformer of 1aC1 was more stable and occupied 98.8% of the equilibrium mixture at room temperature. The ECD spectrum of (7′S,8′R)-1a was then calculated at the B3LYP/6-31G level in the methanol solution with the conductor-like polarizable continuum model (CPCM). As depicted in Fig. 4. The calculated ECD spectrum for (7′S,8′R)-1a matched well with the experimentally measured CD spectrum of (−)-1a, which both showed negative Cotton effects at 200–225 nm, and positive Cotton effects at 225–275 nm, and 275–350 nm. Thus the absolute configuration of (−)-1a was assigned as 7′S,8′R. Similarly, the absolute configuration of (+)-1b was determined to be 7′R,8′S.
(−)-Merrilliaquinone (1a) and (+)-merrilliaquinone (1b) and the racemate 1 were evaluated for their cytotoxic activity against the human hepatoma cell lines SMMC7721 and HuH7, and the normal human hepatic cells QSG7701 and LO2 by MTT assay (Table 1).13 It was very interesting that enantiomer 1b remarkably inhibited the growth of SMMC7721 and HuH7 cells with IC50 values of 0.91 μM and 1.29 μM, respectively, which were comparable to doxorubicin. Enantiomer 1a and racemate 1 showed sharp decreased cytotoxicity on SMMC7721 and HuH7 cells with IC50 values at 27.01–37.82 μM. Moreover, all compounds (1, 1a, and 1b) had no apparent cytotoxic effect on normal hepatic cells QSG7701 and LO2 at 33.08–56.72 μM. Overall, compound 1b had selective cytotoxicity on SMMC7721 and HuH7 cells, while its enantiomer 1a had very weak cytotoxicity on the two human hepatoma cell lines. The different absolute configurations of 1a and 1b may be the most important reason for their distinctive cytotoxicities.
Table 1 In vitro cytotoxicity data (IC50 in μM) of compounds 1, 1a, 1b
Compounds |
SMMC7721 |
HuH7 |
QSG7701 |
LO2 |
Positive control. |
1 |
27.10 |
37.82 |
46.87 |
33.08 |
1a |
37.79 |
27.01 |
56.72 |
44.75 |
1b |
0.91 |
1.29 |
47.79 |
36.71 |
Doxorubicina |
0.32 |
0.68 |
2.90 |
4.01 |
Targeting apoptosis is considered as one of the major strategies for developing anticancer drugs and most clinically used anticancer medicines can induce cell apoptosis.14 In the present study, we examined the effects of 1, 1a, and 1b-induced apoptosis on SMMC7721 cells by using annexin V-FITC/PI double staining method.15,16 The X- and Y-axes represented annexin V-FITC and PI staining, respectively. The right upper and lower right quadrant of the figure represented late and early stages of cell apoptosis, respectively. As illustrated in Fig. 5, we observed no significant early or late apoptosis in 1 and 1a treated SMMC7721 cells. However 1b dose-dependently induced apoptosis of SMMC7721 cells at 1–10 μM, and nearly all cells (90.5%) underwent apoptosis when treated with 10 μM of 1b.
 |
| Fig. 5 Compounds 1, 1a, 1b induced apoptosis in SMMC7721 cells. (A) The representative pictures are from SMMC7721 cells incubated with 0.01–10 μM of 1, 1a, and 1b. (B) Compound 1b at 1–10 μM induced apoptosis in SMMC7721 cells in a dose-dependent manner. The data are expressed as the means ± SEM for three independent experiments with the similar results. **P < 0.01 vs. untreated control. | |
Depolarization of mitochondrial membrane potential (MMP) is one of the characteristic event of apoptosis.15,16 To investigate whether 1, 1a, and 1b-induced apoptosis was associated with mitochondrial dysfunction, we analyzed MMP changes of the SMMC7721 cells by staining with mitochondria-sensitive Rhodamine 123 and analyzing the cells by flow cytometry. The results showed that the MMP of the SMMC7721 cells decreased dose-dependently after treatment with 1–10 μM of 1b, while 1 and 1a-treated cells had no significant MMP changes. The experiment indicated that 1b-induced SMMC7721 cells apoptosis was associated with the disruption of MMP (Fig. 6).
 |
| Fig. 6 Influence of compounds 1, 1a, 1b on the MMP of SMMC7721 cells. (A) The MMP of SMMC7721 cells treated with 0.01–10 μM of compounds 1, 1a, and 1b. (B) The loss of the MMP in SMMC7721 cells following treatment of 1, 1a, and 1b. The data are expressed as the means ± SEM for three independent experiments with the similar results. **P < 0.01 vs. untreated control. | |
Since cell cycle dysregulation contributes to the aberrant cell proliferation and development of cancer,17,18 many of the chemotherapeutic agents with cell cycle arresting have been proven to be clinically effective for treating cancer.19 To gain further insight into whether 1b-induced apoptosis was associate with cell cycle arrest, the DNA content of SMMC7721 cells in G0/G1, S and G2/M phases were measured using PI staining and flow cytometry analysis (Fig. 7).15,16 The results showed that 0.01–10 μM of 1b treatment in SMMC7721 cells induced a dose dependent increase in the proportion of cells in the G0/G1 phase and a decrease of cells in the G2/M phase compared to the untreated control. This indicated that the growth inhibition induced by 1b in a dose-dependent manner occurs through the arrest of SMMC7721 cells in G0/G1 phase.
 |
| Fig. 7 Effects of 1b (0.01–10 μM) on the cell cycle progression of SMMC7721 cells. The data are expressed as the means ± SEM for three independent experiments with the similar results. **P < 0.01 vs. untreated control. | |
Conclusion
The current study reported the isolation and structure elucidation of two new quinone enantiomers (−)-merrilliaquinone (1a) and (+)-merrilliaquinone (1b) from the branches and leaves of I. merrillianum. Absolute configuration determination of 1a and 1b by computation of ECD spectra provides a powerful methodology for absolute configuration assignment of this class of compounds. It was very interesting that enantiomer 1b exhibited notable cytotoxicity against human hepatoma cell lines SMMC7721 and HuH7 comparable to doxorubicin, but had no apparent cytotoxicity on normal human hepatic cells QSG7701 and LO2, which indicated a selective cytotoxicity toward cancer cells. While its enantiomer 1a and the racemate 1 had weak cytotoxicity on SMMC7721 and HuH7 cells. Different absolute configuration leads to the remarkable difference between the interaction of compounds 1a and 1b and the human hepatoma cells. Mechanism study on cell apoptosis, MMP, and cell cycle progression showed that compound 1b exerted its inhibitory effect on SMMC7721 cells by inducing apoptosis, and arresting the cell cycle at the G0/G1 phase. The studies provided a promising chemotherapeutic lead candidate for treating HCC.
Experimental section
General experimental procedures
1D and 2D NMR spectra were recorded on a Bruker Ascend 500 NMR spectrometer with TMS as internal standard; HRESIMS was performed on an Agilent 6520 Accurate-MS Q-TOF LC/MS system; optical rotations were obtained with an Autopol VI (Rudolph Research Analytical, Hackettstown, NJ); CD spectra were recorded on a Chirascan spectrometer (Applied Photophysics, UK); IR spectrum was acquired with a Bruker Vector-22 spectrometer with KBr pellets; column chromatography was performed on silica gel (80–100 mesh, Huiyou Silica Gel Development Co., Ltd Yantai, China); reversed phase medium pressure liquid chromatography (RP-MPLC) was performed on a Buchi Sepacore system; TLC analysis was run on HSGF254 silica gel plates (10–40 μm, Huiyou Silica Gel Development Co., Ltd Yantai, China).
Plant material
The branches and leaves of Illicium merrillianum were collected in Gongshan county, Yunnan province, P. R. China, in August 2011, and authenticated by Prof. Han-Ming Zhang of Second Military Medical University. A voucher specimen (no. 20110815) is deposited in the School of Pharmacy, Second Military Medical University.
Extraction and isolation
The air-dried and chopped branches and leaves of I. merrillianum (20 kg) were extracted with 95% EtOH (3 × 80 L) for three times (1 h for each time) to afford a crude extract (1.7 kg) after removal of solvent under vacuum. The extract was suspended in water and partitioned with petroleum ether (488 g), EtOAc (836 g), and n-BuOH (526 g) successively. The petroleum ether extract was subjected to silica gel column chromatography (CC) (3.4 kg, 80–100 mesh), using petroleum ether-EtOAc gradient elution (50
:
1–0
:
1) to afford seven fractions A (51 g), B (86 g), C (95 g), D (16 g), E (21 g), F (129 g), G (17 g). Fraction F was subjected to reversed phase medium pressure liquid chromatography (RP-MPLC, MeOH/H2O, 40–100%) to give five fractions F-1 (30 g), F-2 (21 g), F-3 (15 g), F-4 (31 g), F-5 (13 g). Compound 1 (78 mg) was isolated from fraction F-5 by applying to RP-MPLC (MeOH–H2O, 40–100%).
Chiral seperation of merrilliaquinone (1): HPLC chiral separation of 1 (52.0 mg) was performed on a Chiralpak IA column (USA): 0.46 cm I.D. × 15 cm L; flow rate: 1.0 mL min−1; solvent: methyl tert-butyl ether/EtOAc = 80/20 (v/v); temperature: 25 °C; detection wavelength: 254 nm; injection volume: 10 μL for each sample; the retain time of (−)-merrilliaquinone (1a) (25.0 mg) and (+)-merrilliaquinone (1b) (24.0 mg) was 2.473 min and 2.904 min, respectively.
Merrilliaquinone (1): [α]D25 of (−)-merrilliaquinone (1a): −11.7 (c 0.30, MeOH), [α]D25 of (+)-merrilliaquinone (1b): +12.0 (c 0.30, MeOH); CD of 1a (c 2.00 mmol L−1, CH3OH, 25 °C) nm (Δε) 213.0 (−21.0), 237.5 (11.3), 312.5 (7.5), CD of 1b (c 2.00 mmol L−1, CH3OH, 25 °C) nm (Δε) 213.0 (21.0), 237.5 (−11.3), 312.5 (−7.5); IR (KBr) νmax 2950, 1648, 1615, 1574, 1505, 1201, 1024, 838 cm−1; HRESIMS m/z [M + Na]+ 407.1518 (calcd 407.1471); 1H-NMR (500 MHz, CDCl3) δ: 1.07 (3H, d, J = 7.5 Hz, H-9′), 1.81 (3H, s, H-9), 2.27 (1H, q, J = 7.5 Hz, H-8′), 3.59 (3H, s, OCH3-5′), 3.73 (3H, s, OCH3-4), 3.79 (3H, s, OCH3-4′), 3.85 (3H, s, OCH3-2′), 4.39 (1H, s, H-7′), 5.83 (1H, s, H-3), 6.40 (2H, s, H-6′, 7), 6.50 (1H, s, H-3′); 13C-NMR (125 MHz, CDCl3) δ: 132.2 (C-1), 186.3 (C-2), 106.0 (C-3), 159.4 (C-4), 181.3 (C-5), 137.1 (C-6), 113.1 (C-7), 153.1 (C-8), 23.2 (C-9), 121.0 (C-1′), 150.8 (C-2′), 98.7 (C-3′), 148.7 (C-4′), 142.7 (C-5′), 111.9 (C-6′), 34.8 (C-7′), 41.2 (C-8′), 19.3 (C-9′), 56.0 (OCH3-4), 56.9 (OCH3-2′, 5′), 56.1 (OCH3-4′).
Chemicals and reagents for biological activities
The human hepatoma cell lines SMMC7721, HuH7 and normal hepatic cell lines QSG7701, LO2 were obtained from the Cell Bank of Shanghai Institute of Biochemistry & Cell Biology, Shanghai Institute for Biological Sciences, Chinese Academy of Sciences; dimethylsulfoxide (DMSO), [3-(4,5-dimethylthiazol-2-yl)-2,5-diphenyltetrazolium bromide] (MTT), doxorubicin (DOX), Dulbecco's Modified Eagle's Medium (DMEM), fetal bovine serum (FBS), phosphate buffered saline (PBS), L-glutamine, RNase A, and penicillin/streptomycin mixture were purchased from Sigma Chemical Co. (St. Louis, Mo., USA); Rhodamine 123 was purchased from Eugene Co. (OR, USA); the annexin V-FITC/propidium iodide (PI), apoptosis detection kit was purchased from Beyotime Institute of Biotechnology (Shanghai, China).
MTT assay
The assay was performed in triplicate. The test compounds were dissolved in DMSO, and the final volume for DMSO in each well was no more than 0.1%. To rule out a potential influence of the solvent, we conducted a corresponding control experiments. The SMMC7721, HuH7, QSG7701 and LO2 cell lines were seeded in 96-well plate at a density of 5 × 10⁴ per well, using DMEM medium supplemented with 10% heat-inactivated FBS, 2 mM L-glutamine, 100 units per mL penicillin and 100 μg mL−1 streptomycin, in a humidified atmosphere containing 5% CO2 at 37 °C. After cell attachment overnight, each well was treated with test compounds or 0.1% DMSO for 24 h. Then 10 μL of MTT solution (5 mg mL−1) was added to each well and the cultures were incubated for another 4 h at 37 °C. The supernatant was then removed and 100 μL of DMSO was added to each well and agitated at 60 rpm for 5 min to dissolve the precipitate. The absorbance was read at 570 nm by a SYNERGY microplate reader (BioTek, Winooski, VT). Doxorubicin was used as the positive control, the IC50 values on SMMC7721, HuH7, QSG7701, LO2 cells were 0.32, 0.68, 2.90 and 4.01 μM, respectively.
Cell apoptosis assay
The apoptotic cells were quantified by using the annexin V-FITC and PI double staining kit. Briefly, SMMC7721 cells were incubated with test compounds for 24 h. Then the cells were centrifuged, and washed with ice-cold PBS. The cultures were suspended in 400 μL of binding buffer containing 5 μL annexin V-FITC (10 μg mL−1) for 15 min in the dark, and then incubated with 10 μL of PI (20 μg mL−1) for 5 min. The cells were immediately analyzed by flow cytometry (BD FACSCanto II).
Mitochondrial membrane potential measurement
The mitochondrial membrane potential (MMP) was measured by flow cytometry using Rhodamine 123 (Rh-123) as fluorochrome. SMMC7721 cells were treated with test compounds for 24 h, and then incubated with 5 μg mL−1 of Rh-123 for 30 min at room temperature in the dark. After centrifuged and washed twice with PBS, the cells were resuspended in 1000 μL of PBS and analyzed using flow cytometry with excitation and emission wavelength of 488 and 530 nm, respectively.
Cell cycle analysis
SMMC7721 cells were incubated with test compounds for 24 h, and then trypsinized, washed with PBS, and fixed with 70% of ethanol at 4 °C overnight. After washed twice with PBS, the cells were incubated with 100 μL of RNase A for 30 min and then stained with 1 mL of PI (3.8 mM sodium citrate, 50 μg mL−1 PI in PBS) for 10 min in the dark. The DNA content of cells and cell-cycle distribution were analyzed by flow cytometry.
Statistical analysis
Data were analyzed using GraphPad Prism software (Graph Pad software Inc., San Diego, CA, USA). The comparison between two groups was analyzed by unpaired Student t-test, and multiple comparisons were compared by one-way ANOVA analysis of variance followed by Tukey post hoc test. Statistical significance was determined as P < 0.05.
Computational details
Conformational analysis. All quantum-chemical calculations have been performed on compounds 1a and 1b by the Gaussian 03 package,12 on an IBM cluster machine located at the High Performance Computing Centre of Peking Union Medical College. Conformational analysis was initially carried out using Maestro 7.5 conformational searching, together with the MMFF94 molecular mechanics methods. MMFF94 structures were reoptimized using ab initio DFT at the B3LYP/6-31G (d) level. Energy of stable conformations were calculated and led to the relative energy, which in turn allow the room temperature equilibrium populations to be calculated according to Maxwell–Boltzmann distribution law.
Original ECD data calculations. Excitation energy (in nm) and rotatory strength R (velocity form Rvel and length form Rlen in 10−40 erg esu cm per Gauss) between different states were calculated by time dependant density functional theory (TDDFT) at B3LYP/6-31G (d)//B3LYP/6-31G (d) level in methanol solution. All calculations are performed by the Gaussian 03 program package.
ECD simulation. The ECD spectra were then simulated by overlapping Gaussian functions for each transition according to
where σ is the width of the band at 1/e height and ΔEi and Ri are the excitation energies and rotatory strengths for transition i, respectively, σ = 0.20 eV and Rvel have been used in this work. Conformational analysis has been carried out and theoretically weighted ECD spectra have been simulated at different levels mentioned above.
Acknowledgements
The work was supported by the following programs: NSFC (81373301, 81230090, 1302658), Shanghai Leading Academic Discipline Project (B906), Shanghai Engineering Research Center for the Preparation of Bioactive Natural Products (10DZ2251300), Scientific Foundation of Shanghai, China (12401900801, 13401900101) and the National Key Technology R&D Program of China (2012BAI29B06).
Notes and references
- J. W. Li and J. C. Vederas, Science, 2009, 325, 161–165 CrossRef PubMed.
- D. J. Newman, J. Med. Chem., 2008, 51, 2589–2599 CrossRef CAS PubMed.
- D. J. Newman and G. M. Cragg, J. Nat. Prod., 2012, 75, 311–335 CrossRef CAS PubMed.
- A. Jemal, F. Bray, M. M. Center, J. Ferlay, E. Ward and D. Forman, Ca-Cancer J. Clin., 2011, 61, 69–90 CrossRef PubMed.
- S. Breitenstein, C. Apestegui, H. Petrowsky and P. A. Clavien, World J. Surg., 2009, 33, 797–803 CrossRef PubMed.
- L. Y. Zhou, Z. C. Zeng, J. Fan, B. Chen, S. X. Rao, J. He, P. Yang, J. Z. Hou, Z. F. Wu, J. Y. Zhang and Y. Hu, BMC Cancer, 2014, 14, 878 CrossRef PubMed.
- Y. H. Liu, Flora Republicae Popularis Sinicae, Science Press, Beijing, 1996, 30, p. 227 Search PubMed.
- X. H. Tian, R. C. Yue, S. D. Zhang, Y. H. Shen, J. Ye, L. Shan, H. L. Li, B. Wen, X. K. Xu and W. D. Zhang, Eur. J. Org. Chem., 2014, 22, 4753–4758 CrossRef PubMed.
- S. Y. Lee, E. Moon, S. Y. Kim, S. U. Choi and K. R. Lee, Biosci., Biotechnol., Biochem., 2013, 77, 276–280 CrossRef CAS PubMed.
- Y. P. Gao, Y. H. Shen, S. D. Zhang, J. M. Tian, H. W. Zeng, J. Ye, H. L. Li, L. Shan and W. D. Zhang, Org. Lett., 2012, 14, 1954–1957 CrossRef CAS PubMed.
- N. Berova, L. D. Bari and G. Pescitelli, Chem. Soc. Rev., 2007, 36, 914–931 RSC.
- M. J. Frisch, G. W. Trucks, H. B. Schlegel, O. Farkas, D. K. Malick, A. D. Rabuck, K. Raghavachari, J. B. Foresman, J. V. Ortiz, Q. Cui, A. G. Baboul, S. Clifford, J. Cioslowski, B. B. Stefanov, G. Liu, A. Liashenko, P. Piskorz, I. Komaromi, R. L. Martin, D. J. Fox, T. Keith, M. A. Al-Laham, C. Y. Peng, A. Nanayakkara, M. Challacombe, P. M. W. Gill, B. Johnson, W. Chen, M. W. Wong, C. Gonzalez and J. A. Pople, Gaussian, Inc., Wallingford CT, USA, 2004.
- J. J. Qin, H. Z. Jin, Y. Huang, S. D. Zhang, L. Shan, S. Voruganti, S. Nag, W. Wang, W. D. Zhang and R. W. Zhang, Eur. J. Med. Chem., 2013, 68, 473–481 CrossRef CAS PubMed.
- I. M. Ghobrial, T. E. Witzig and A. A. Adjei, Ca-Cancer J. Clin., 2005, 55, 178–194 CrossRef.
- M. J. Wu, H. Zhang, J. H. Hu, Z. Y. Weng, C. Y. Li, H. Li, Y. Zhao, X. F. Mei, F. Ren and L. H. Li, PLoS One, 2013, 8, 1–8 Search PubMed.
- G. W. Wang, C. Lv, Z. R. Shi, R. T. Zeng, X. Y. Dong, W. D. Zhang, R. H. Liu, L. Shan and Y. H. Shen, PLoS One, 2014, 9, 1–19 Search PubMed.
- Z. A. Stewart, M. D. Westfall and J. A. Pietenpol, Trends Pharmacol. Sci., 2003, 24, 139–145 CrossRef CAS.
- D. F. Amanatullah, A. T. Reutens, B. T. Zafonte, M. Fu, S. Mani and R. G. Pestell, Front. Biosci., 2000, 5, D372–D390 CrossRef CAS PubMed.
- P. L. Toogood, Curr. Opin. Chem. Biol., 2002, 6, 472–478 CrossRef CAS.
|
This journal is © The Royal Society of Chemistry 2015 |
Click here to see how this site uses Cookies. View our privacy policy here.