Localized surface plasmon resonance of Cu nanoparticles by laser ablation in liquid media

Peisheng Liu*ab, Hao Wangabc, Xiaoming Lib, Muchen Ruib and Haibo Zeng*b
aJiangsu Key Laboratory of ASCI Design, College of Electronics and Information Engineering, Nantong University, Nantong 226019, China. E-mail: psliu@issp.ac.cn
bInstitute of Optoelectronics and Nanomaterials, College of Materials Science and Engineering, Nanjing University of Science and Technology, Nanjing 210094, China. E-mail: zeng.haibo@njust.edu.cn
cCollege of Science, Nantong University, Nantong 226019, China

Received 28th July 2015 , Accepted 8th September 2015

First published on 9th September 2015


Abstract

Expanding localized surface plasmon resonance (LSPR) towards long wavelengths has been the focus of plasmonics for several decades. Compared with the most studied Au and Ag nanoparticles, Cu nanoparticles have intrinsic long-wavelength LSPR, but hard to be facially fabricated due to their sensitivity to oxidation. Here, we report on the facile and rapid fabrication of colloidal copper nanoparticles by laser ablation in liquid (LAL) operated in ambient conditions, and their LSPR properties. A formation mechanism was put forward to reveal the optical properties of colloidal copper nanoparticles. The effects of different parameters, such as laser power density, ablation time, surfactant concentration, organic solvents and aging time, on LSPR properties were investigated. Eventually, we can decrease the oxidation of colloidal copper nanoparticles by mediating disparate factors, and then tune the position and intensity of copper LSPR peaks. And our results will be beneficial to the application of copper LSPR in optical catalysis, sensitivity, detection devices, and conductive pattern making based on the printing technologies.

1. Introduction

Surface plasmon resonance (SPR) of noble metal nanoparticles (NPs), such as Au,1,2 Ag,3,4 has been subjected to extensive investigations aiming at applications in sensors,5,6 catalysis,7–10 detectors,11,12 biomedical field,13–15 etc. In recent years, metal copper NPs have attracted great attention due to their wide potential applications in chemistry, catalysis and material science.16–19 The large extinction cross section, photosensitivity, high conductivity and low cost of copper comparing with noble metal gold, silver make it a promising candidate for the development of miniaturized devices which can integrate photoelectric and chemical characteristics for utilities in sensors, catalysis and other aspects.17,20–22

In regard to the research of fabrication methods and SPR features of copper NPs, there are many reported achievements.23,24 Santillán et al.16 fabricated colloidal copper suspension by fs laser ablation copper circular disk in water or acetone, and analyzed the influence of free or bound electrons on the dielectric function and its dependence with size, simultaneously. Rice et al.25 synthesized the monodisperse colloidal copper nanocrystals via hydrothermal process and subsequent solvent dependent oxidation to form Cu2O nanoparticles. The results indicated that the initial intensity of Cu SPR was strongly dependent on the properties of the solvents used to form the nanocrystal dispersion. Solvents with π-bonds significantly reduced (>3-fold) the Cu SPR intensity as opposed to that without π-bonds due to the electrons sharing between the solvents and Cu surface. In brief, delocalized π-bond electrons in the solvent molecules can improve the electron density of the copper surface and reduce the density of free electrons in the conduction band with damping the plasmon oscillations. As a thin shell of cuprous oxide forms at the nanocrystal surface, however, the plasmon resonance still occurs at the surface of the Cu particle that is now the buried interface between the Cu2O shell and the Cu core, and the shared electron density from the π-bonds of the solvent becomes screened. Therefore, higher densities of free electrons in the Cu conduction band become available to oscillate, and the surface plasmon resonance intensity increases. Kawasaki26 obtained Cu NPs through nanosecond laser-induced fragmentative decomposition of fine CuO powder in acetone, as well as investigating the varying factors (such as laser fluence, irradiation time, etc.) on the SPR properties of Cu NPs in detail.

However, for active metal copper nanoparticles except the factors described above, its colloidal solution has inferior stability and is rapid aerobic oxidized readily. As our previous report,27 copper colloidal solution acquired by laser ablation in PVP aqueous solution is easily oxidized to Cu2O NPs and it also becomes a bottleneck for cupreous widely application.

To settle this problem, in this work, we studied the effects of diverse parameters on Cu SPR features systematically and attempted to locate the optimal condition for reducing or avoiding the undesired oxidation of colloidal copper solution or Cu NPs. To be specific, the SPR features of Cu NPs by laser ablation in liquid media (LAL) are studied by considering shapes, sizes, different laser power density, ablation time, organic solvents, and aging time. In reality, the as-prepared Cu NPs in our experiment have nearly spherical morphology and with diameters over 10 nm which are more than the Bohr radius of Cu, and thus the shape and quantum confinement effect on the SPR features of the as-prepared Cu NPs in different conditions can be neglected.28 Therefore, we investigate the influences of the parameters mentioned above. And yet the probable formation mechanism of the products in different solvents is put forward to reveal the difference in SPR features of the colloidal copper nanoparticles. In general, we can tune the position or intensity of the SPR peaks and avoid or reduce the oxidation of the colloidal copper solution or Cu NPs via regulating disparate factors effectively. Then it is expected to provide a feasible approach to fabricate Cu NPs.

2. Experimental section

2.1 Fabrication of Cu NPs

The typical experiment was carried out through pulsed laser ablation of a pure copper plate (99.99%) in pure water, ethanol (AR, 99.7%), glycol (AR, 99.9%), acetone (AR, 99.5%) and aqueous solution of sodium dodecyl sulfate (SDS, AR, 99.5%) surfactants with various concentrations from 0.001 to 0.1 M, respectively. A copper plate was fixed on the bracket in a glass vessel filled with 25 mL solution which was continuously stirred to disperse the smoke-like colloids above the metal plate. The plate was located at 4 mm from the solution surface in the solution and then was ablated by the first harmonic (1064 nm) of a Nd[thin space (1/6-em)]:[thin space (1/6-em)]YAG laser operated at 10 Hz with a pulse width of 10 ns. A Scientech power meter monitored the output of the 1064 nm laser with the distinct power density from 2.23 to 3.50 J per cm2 per pulse. The laser beam was focused on the metal plate with a spot size about 2 mm in diameter using a lens with a focal length of 200 mm. Laser ablation lasted for varying from 5 to 30 min, and the colloidal solutions turned to mauve from initially canary yellow. After irradiation, the solutions were centrifuged at 14[thin space (1/6-em)]000 rpm for 5 min. Subsequently, the obtained powder-products were ultrasonically rinsed with ethanol for several times, intending to remove the surfactant SDS molecules and other possible impurities on the particles as much as possible, and then draught-dried in vacuum at room temperature.

2.2 Characterization

X-ray diffraction (XRD) patterns were recorded on a multipurpose XRD system D8 Advance from Bruker with a Cu Kα radiation (λ = 1.5406 Å). For transmission electron microscopic (TEM) and high resolution transmission electron microscopic (HRTEM) examination, the powder samples were ultrasonically re-dispersed in ethanol, before they were dropped on the copper grids coated with thin carbon film and evaporated in air at room temperature. TEM and HRTEM observations were conducted on a JEOL 2010 TEM, operating at an accelerating voltage of 200 kV. The optical absorption spectra of the obtained colloidal solutions were recorded, immediately after laser ablation (in about 5 min except aging colloidal solutions), by a Cary 5E UV-vis-IR spectrometer. Fourier transform infrared (FTIR) spectra were obtained using a Nicolet iS10 FTIR spectrophotometer from Thermo Fisher Scientific Inc. with an average of 32 scans and at a resolution of 4 cm−1.

3. Results and discussion

Fig. 1(a) shows an X-ray diffraction (XRD) pattern of the as-prepared sample at the incident laser power density of ∼2.55 J per cm2 per pulse for 30 min in pure water. The XRD spectrum contains six distinguishable peaks. All of them can be perfectly indexed to the crystalline Cu (111), (200) and Cu2O (111), (200), (220), (331) planes, respectively. According to the XRD pattern, we know that the obtained products suffer from extensive aerobic oxidation, but no other impurity peaks are observed such as CuO. Fig. 1(b) shows a typical series of normalized absorbance spectra of colloidal copper solution. The spectra exhibit a distinct SPR band at ∼626 nm, along with the copper inter-band transition (IBT) dominating the short wavelength region. The position of the SPR band peaks is virtually unchangeable but their intensity increases with prolonging the laser ablation time. As the size is over 10 nm that is far more than cupreous Bohr radius28 and it has invariable spherical morphology in this study, we can exclude the effect of quantum confinement and deem it dues to the increasing concentration of the metal Cu NPs in colloidal solution with prolonging the laser ablation time. At the initial stage, the surface of Cu NPs is easily to be oxidized to Cu2O shell due to the dissolved oxygen in water under laser illumination.
image file: c5ra14933a-f1.tif
Fig. 1 (a) XRD pattern of the corresponding product at 30 min and (b) normalized absorption spectra of the as-prepared colloidal solution in pure water under ∼2.55 J per cm2 per pulse laser power density for different time.

Fig. 2(a) shows the TEM image of the as-prepared sample and reveals nearly spherical morphology with average diameter 37.72 nm (as the inset indicates) above 10 nm. With the analysis of the SAED (as shown in Fig. 2(b)) and the XRD (as indicated in Fig. 1(a)), we conclude that the as-prepared sample is a Cu@Cu2O core–shell structure. And the Cu2O shell can surely offer the protection of Cu core. Next the Cu core will be further oxidized with the diminishing intensity of the SPR band. In return, it brings about more difficulties in application, scientific research, and so forth. To take advantage of the Cu SPR effectively, some preventive oxidation approaches must be employed. One way is to add some surfactants in pure water due to their steric effects which can avoid or reduce Cu NPs oxidized and here we take the surfactant SDS as a precedent.


image file: c5ra14933a-f2.tif
Fig. 2 TEM images (a) and the corresponding selected area electronic diffraction (SAED) (b) of the sample prepared in pure water under ∼2.55 J per cm2 per pulse laser power density for 30 min. The inset is the particle size distribution.

Fig. 3 shows the TEM, HRTEM images and SAED of the samples prepared in different SDS concentration aqueous solutions from 0.001 to 0.1 M. From the TEM images (a, d and g), it is seen clearly that the as-prepared products are nearly spherical accompanying the particle average size from 35.83 nm to 25.12 nm (as described in the insets) with the increasing SDS concentrations and the dispersivity of nanoparticles in colloidal solution becomes better with increasing SDS concentration. According to the corresponding HRTEM images (b, e and h), there is an obvious Cu@Cu2O core–shell structure and the thickness of Cu core of Cu@Cu2O core–shell increases with the increasing SDS concentrations from 0.001 to 0.1 M, apparently. Due to the steric effect by the surfactant SDS, the further oxidation of colloidal copper solution is reduced or avoided, coinciding with the corresponding SAED in patterns (c, f and i), just as the report of Zn@ZnO composites by Zeng et al.29 The detailed analysis of the formation process shall be discussed in the part of the formation mechanism. In addition, we also estimate the yield of Cu@Cu2O core–shell NPs via the difference of the target before and after laser ablation. The estimated results are 115, 106, 110 μg ml−1 corresponding to the 0.001, 0.01, 0.1 M SDS, respectively. It is obvious that the yields of the as-prepared products are so minute.


image file: c5ra14933a-f3.tif
Fig. 3 TEM, HRTEM images and the SAED of the samples prepared in aqueous solution with different SDS concentrations. (a–c) 0.001 M; (d,–f) 0.01 M; (g–i) 0.1 M. The insets are the corresponding particle size distribution (D is the particle average size).

Fig. 4(a) indicates the normalized ultraviolet-visible (UV-vis) absorption spectra of the colloidal suspension solution. For the sample prepared in pure water, there is an obvious SPR absorption peak at ∼626 nm. With the concentrations of surfactant SDS increasing from 0.001 to 0.1 M, the peak position of different samples shifted from ∼612 nm to ∼595 nm due to the reducing size of colloidal NPs induced by the steric effect of surfactant SDS. Furthermore, it also leads to the increasing intensity of the SPR band because of the increasing Cu content in core–shell structure. The absorption of pure SDS aqueous solution is very weak in the wavelength region, as our previous report.29 Therefore, we deem that the absorption peaks originate from the Cu nanoparticles suspended in the solution. Fig. 4(b) reveals the FTIR spectra collected from the nanoparticles mulled in KBr wafer. The broad absorption band centered at 3415 cm−1 corresponds to the –OH groups and water molecules. The bands at 1061, 1468, 2920 and 2952 cm−1 are ascribed to –C–H stretching and bending modes, respectively. In addition, the band at 1228 cm−1 is related to –SO4 of SDS molecules.29 However, there is no apparent absorption peak of Cu–O bonds due to the faintest yield as mentioned above. The emergence of the absorption peak corresponding to surfactant molecules also confirms that SDS has a paramount effect in the synthesis process of Cu nanoparticles.


image file: c5ra14933a-f4.tif
Fig. 4 (a) Normalized absorption spectra of the colloidal solution prepared in aqueous solution with different SDS concentrations at the incident laser power density of ∼2.55 J per cm2 per pulse for 30 min. (b) The corresponding FTIR spectra. (a) In pure water, (b), (c) and (d) is with SDS concentration of 0.001, 0.01 and 0.1 M, respectively.

Fig. 5(a) shows the normalized absorption spectra of the acquired colloidal solution in ethanol at different laser ablation time. The spectra exhibit distinct SPR bands at ∼590 nm, along with the Cu IBT dominating the short wavelength region. In terms of the whole spectra, the obtained colloidal solutions in ethanol have a blue-shift of the SPR band compared with that in pure water with slight difference in the intensity. As to the increasing intensity, we believe that they originate from the increase in quantity of metal Cu NPs in colloidal solution. Except the effect of laser ablation time, this result may mainly account for the capping effect of the encapsulated amorphous carbon by laser induced ethanol decomposition on Cu or Cu@Cu2O surface (as shown in Fig. 6(b), (e) and (h)), as reported in ref. 29–34. And furthermore, the capping effect of encapsulated carbon can not only reduce the oxidation degree of Cu NPs, but also increase the stability of the colloidal copper solution. The protection of the encapsulated amorphous carbon will be explained in the following part of the formation mechanism.


image file: c5ra14933a-f5.tif
Fig. 5 Normalized absorption spectra of the acquired colloidal solution (a) in ethanol at the incident laser power density of ∼2.55 J per cm2 per pulse for different time from 5 to 30 min and (b) at different laser power density from 2.23 to 3.50 J per cm2 per pulse for 5 min.

image file: c5ra14933a-f6.tif
Fig. 6 TEM, HRTEM images and the SAED of the samples prepared in ethanol (a–c), glycol (d,–f) and acetone (g–i), respectively. The insets are the corresponding particle size distribution (D is the particle average size).

In Fig. 5(b), the whole normalized absorption spectra of the as-prepared colloidal solution are similar to that in Fig. 5(a). The peak positions of the SPR bands are nearly invariable but the intensity increases, which should be ascribed to the previous formation of the carbon layer on the copper clusters in ethanol, which may further limit the growing up of the Cu particles and increase the concentration. In addition, the encapsulated carbon can prevent the further oxidation of metal Cu NPs and make the colloidal copper solution more stable, ultimately leading to the increasing of the intensity of the SPR band.

Fig. 6 shows the TEM, HRTEM images and SAED of the as-prepared samples in various organic solvents, ethanol, glycol and acetone at laser ablation power density of 2.86 J per cm2 per pulse for 15 min. Compared with the obtained samples in pure water, they exhibit barely aggregation and superior dispersivity in organic solvents apart from the spherical morphology and small average size 13.99 nm, 14.34 nm, 12.67 nm above 10 nm corresponding to ethanol, glycol, acetone (as depicted in the insets). As shown in Fig. 6, there are legible amorphous carbon layers encapsulated on the surface of the NPs. And yet there is no obvious difference in the thickness of the amorphous carbon layers in disparate organic solvents. Thus, we assume that the content of the carbon in various organic solvents have slight impact on the thickness of the carbon layer. In other words, if the as-prepared Cu NPs has a better dispersivity in a certain solvent than the others, namely, it may increase the content of metal Cu NPs and the corresponding SAED patterns (c, f and i) also indicate the obvious results, as discussed above. Eventually, it leads to the increasing of the intensity or blue-shift of the SPR band.

Fig. 7(a) reveals the normalized absorption spectra of the as-prepared colloidal solution in different organic solvents and pure water at laser ablation power density of 2.86 J per cm2 per pulse for 15 min. The spectrum has an appreciably blue-shift from ∼626 nm (water) to ∼590 nm (glycol). Based on the analysis above, the NPs are encapsulated by carbon produced in colloidal solution during laser ablation in the organic solvents to prevent the products from being further oxidized. And with the protection of the carbonized carbon and increasing dispersion of the various organic solvents, the concentration of Cu NPs in colloidal solution will increase, leading to the blue-shift and intensity increased in the SPR band.


image file: c5ra14933a-f7.tif
Fig. 7 Normalized absorption spectra of the obtained colloidal solution (a) in acetone, ethanol, glycol, pure water and (b) in ethanol for different aging time: 6 h, 1 day, 3 days, 5 days, 7 days.

Fig. 7(b) shows the normalized absorption spectra of the obtained colloidal solution in ethanol by laser ablation power density of ∼2.55 J per cm2 per pulse for 30 min at different aging time. A minuscule shift of the SPR band is observed and the intensity slightly decrease with prolonging aging time. It also proves that the as-prepared colloidal solution by laser ablation in ethanol is relatively steady due to the encapsulation of amorphous carbon on Cu or Cu@Cu2O core–shell structure surface, compared with other results.25 Further oxidation continues slowly for up to a month or so, thereby the SPR band will disappear almost completely. This is concomitant with a substantial decrease of absorbance in the short-wavelength region, as expected when the metal IBT for Cu NPs is gradually oxidized to be Cu2O NPs.

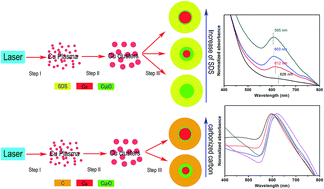
To our knowledge, there are few reports on the formation mechanism of copper NPs by LAL. Basing on our experiential results, the possible formation mechanism of Cu@Cu2O composite NPs could be depicted in three steps, as illustrated in Fig. 8. (I) The high-temperature and high-density copper plasma (without solvent) is produced at the solid–liquid interface quickly after the interaction between the pulsed laser and metal copper target. (II) The subsequent ultrasonic and adiabatic expansion of the high-temperature and high-pressure copper plasma leads to cooling of the copper plume region and hence to the formation of copper clusters. In our case, the interval between two successive pulses is 0.1 s (10 Hz), which is much longer than the life of the plasma plume (∼1000 ns).35 Therefore, the next laser pulse has no interaction with the former plasma plume. (III) With the extinguishment of the plasma, the formed copper clusters encounter the solvent or surfactant molecules and carbonized carbon by laser induced organic solvent molecules decomposed in the solution, which induces some chemical reactions and steric effect. The final structure and morphology of the particles are dependent on the SDS concentration and carbonized carbon content in solution or on the competition between aqueous oxidation of copper particles and SDS or carbonized carbon protection.


image file: c5ra14933a-f8.tif
Fig. 8 Illustration of the formation process for Cu@Cu2O composite nanoparticles. (a) In different concentrations surfactant SDS and (b) in different organic solvents.

For Cu NPs, in brief, the decrease of NPs' size with the increasing SDS concentration in solution can be attributed to the steric effect of SDS and electrostatic repulsive force among colloidal particles, as previously reported.29 The higher SDS concentration leads to the higher surface coverage of SDS molecules on the particle surface and to the stronger steric effect, inducing formation of fewer oxidation. Thus the SPR band shifts to the blue end. And yet, for carbonized carbon, we prefer to the dispersivity of carbon encapsulated Cu NPs in organic solvents rather than carbonized carbon concentration influencing on the SPR band except the protection just like the SDS molecules. In our study, the carbon content of diverse organic solvents has a delicate difference and thus the superior dispersivity in organic solvents will have primary functions on the SPR band. It means that the better dispersivity in organic solvents, the higher concentration of metal Cu NPs will be obtained and the intensity of the SPR band also becomes stronger accompanying a blue-shift.

However, oxygen-rich solvents such as water are known to have little effects on composition of nanoparticles except incorporation of oxygen in forming of the reactive metal nanoparticles. Since copper is relatively active metal compared to gold and silver, we cannot perfectly exclude the possibility of reaction with organic solvent although they are the only chemicals used as solvents in this study. The reaction between copper and the solvents in ablation and the investigation of amorphous carbonized carbon clouds will be further studied.

4. Conclusions

In summary, we demonstrate the feasibility of controlled-synthesis of Cu@Cu2O composite nanoparticles by laser ablation of pure active copper target in liquid media. Then we investigate the effects of different factors on optical properties of the as-prepared colloidal solution, primarily and gave out relative interpretations. Laser ablation of the target induces local copper plasma above the target, which results in the formation of Cu clusters during extinguishment of the copper plasma plume, and subsequent aqueous oxidation can lead to the formation of Cu2O nanoparticles. However, SDS and carbonized carbon can depress such oxidation because of their steric effect on the particles and can lead to the formation of Cu@Cu2O core–shell nanoparticles. Relative amounts of components Cu and Cu2O can thus evolve with SDS concentration in solution and the dispersivity of carbon encapsulated Cu NPs in organic solvents. High SDS concentration and the superior dispersivity in organic solvents correspond to high relative amount of Cu nanoparticles, to the contrary, leading to high Cu2O amount. Correspondingly, optical absorption spectra undergoes blue-shift with rise of SDS concentration and the increasing dispersivity in organic solvents. The steric effect of SDS and carbonized carbon or electrostatic repulsive force among colloidal particles will result in the decrease of nanoparticle size. Furthermore, with increasing aging time, the intensity of absorption spectra decreases and the position of it keeps unvaried due to the unapparent change in morphology and size of the product.

We believe that laser ablation of active metal in liquid media is an appropriate method to synthesize a series of metal colloidal solutions with controlled composition, morphology, size, and so on. Most of all, we can get high quality metal colloidal NPs via tuning different parameters (such as laser power density, ablation time, etc.) or employing organic solvents with preventing the as-prepared samples oxidized. That is of importance to study the catalysis, sensitivity, and photoelectric detector of the active metal materials.

Acknowledgements

This work was supported by the National 973 project from National Basic Research Program of China (2014CB931700), the National Natural Science Foundation of China (61222403, 21375067, 61474067, 11104150, and 61571245) and the Key Natural Science Foundation of the Jiangsu Higher Education Institutions of China (10KJA140043, 14KJA510005).

References

  1. L. Jing, C. Y. Liu and Y. Liu, J. Mater. Chem., 2012, 22, 8426–8430 RSC .
  2. S. Link and M. A. El-Sayed, J. Phys. Chem. B, 1999, 103, 4212–4217 CrossRef CAS .
  3. V. Amendola, S. Polizzi and M. Meneghetti, Langmuir, 2007, 23, 6766–6770 CrossRef CAS PubMed .
  4. X. M. Zhou, G. Liu, J. G. Yu and W. H. Fan, J. Mater. Chem., 2012, 22, 21337–21354 RSC .
  5. S. Roh, T. Chung and B. Lee, Sensors, 2011, 11, 1565–1588 CrossRef PubMed .
  6. H. Sipova and J. Homola, Anal. Chim. Acta, 2013, 773, 9–23 CrossRef CAS PubMed .
  7. P. Zhang, C. L. Shao, Z. Y. Zhang, M. Y. Zhang, J. B. Mu, Z. C. Guo, Y. Y. Sun and Y. C. Liu, J. Mater. Chem., 2011, 21, 17746–17753 RSC .
  8. S. Krejcikova, L. Matejova, K. Koci, L. Obalova, Z. Matej, L. Capek and O. Solcova, Appl. Catal., B, 2012, 111, 119–125 CrossRef PubMed .
  9. Z. Y. Zhang, C. L. Shao, Y. Y. Sun, J. B. Mu, M. Y. Zhang, P. Zhang, Z. C. Guo, P. P. Liang, C. H. Wang and Y. C. Liu, J. Mater. Chem., 2012, 22, 1387–1395 RSC .
  10. P. Sathishkumar, R. V. Mangalaraja, H. D. Mansilla, M. A. Gracia-Pinilla and S. Anandan, Appl. Catal., B, 2014, 160–161, 692–700 CrossRef CAS PubMed .
  11. J. Wang and H. S. Zhou, Anal. Chem., 2008, 80, 7174–7178 CrossRef CAS PubMed .
  12. E. Hutter and M. P. Pileni, J. Phys. Chem. B, 2003, 107, 6497–6499 CrossRef CAS .
  13. I. H. El-Sayed, X. Huang and M. A. El-Sayed, Nano Lett., 2005, 5, 829–834 CrossRef CAS PubMed .
  14. L. Dykman and N. Khlebtsov, Chem. Soc. Rev., 2012, 41, 2256–2282 RSC .
  15. C. M. Cobley, J. Chen, E. C. Cho, L. V. Wang and Y. N. Xia, Chem. Soc. Rev., 2012, 40, 44–56 RSC .
  16. J. M. J. Santillan, F. A. Videla, M. B. F. van Raap, D. C. Schinca and L. B. Scaffardi, J. Appl. Phys., 2012, 112, 054319 CrossRef PubMed .
  17. K. Liu, Y. Song and S. Chen, Nanoscale, 2015, 7, 1224–1232 RSC .
  18. M. K. Patel, B. J. Nagare, D. M. Bagul and S. K. Haram, Surf. Coat. Technol., 2005, 196, 96–99 CrossRef CAS PubMed .
  19. H. Zhu, C. Zhang and Y. Yin, Nanotechnology, 2005, 16, 3079 CrossRef CAS .
  20. D. P. Dubal, D. S. Dhawale, R. R. Salunkhe, V. S. Jamdade and C. D. Lokhande, J. Alloys Compd., 2010, 492, 26–30 CrossRef CAS PubMed .
  21. A. V. Vinogradov, A. V. Agafonov and V. V. Vinogradov, J. Alloys Compd., 2012, 515, 1–3 CrossRef CAS PubMed .
  22. O. Akhavan and E. Ghaderi, Surf. Coat. Technol., 2010, 1, 219–223 CrossRef PubMed .
  23. M. Gracia-Pinilla, E. Martinez, G. S. Vidaurri and E. Perez-Tijerina, Nanoscale Res. Lett., 2010, 5, 180–188 CrossRef CAS PubMed .
  24. M. A. Gracia-Pinilla, M. Villanueva, N. A. Ramos-Delgado, M. F. Melendrez and J. Menchaca-Arredondo, Dig. J. Nanomater. Bios., 2014, 9, 1389–1397 Search PubMed .
  25. K. P. Rice, E. J. Walker, M. P. Stoykovich and A. E. Saunders, J. Phys. Chem. C, 2011, 115, 1793–1799 CAS .
  26. M. Kawasaki, J. Phys. Chem. C, 2011, 12, 5165–5173 Search PubMed .
  27. P. S. Liu, Z. G. Li, W. P. Cai, M. Fang and X. D. Luo, RSC Adv., 2011, 1, 847–851 RSC .
  28. K. H. Su, Q. H. Wei, X. Zhang, J. J. Mock, D. R. Smith and S. Schultz, Nano Lett., 2003, 3, 1087–1090 CrossRef CAS .
  29. H. B. Zeng, W. P. Cai, Y. Li, J. L. Hu and P. S. Liu, J. Phys. Chem. B, 2005, 109, 18260–18266 CrossRef CAS PubMed .
  30. C. C. Hao, F. Xiao and Z. L. Cui, J. Nanopart. Res., 2008, 1, 47–51 CrossRef .
  31. V. G. Kravets, R. Jalil, Y. J. Kim, D. Ansell, D. E. Aznakayeva, B. Thackray, L. Britnell, B. D. Belle, F. Withers, I. P. Radko, Z. Han, S. I. Bozhevolnyi, K. S. Novoselov, A. K. Geim and A. N. Grigorenko, Sci. Rep., 2014, 4, 5517 CAS .
  32. S. L. Wang, X. L. Huang, Y. H. He, H. Huang, Y. Q. Wu, L. Z. Hou, X. L. Liu, T. M. Yang, J. Zou and B. Y. Huang, Carbon, 2012, 50, 2119–2125 CrossRef CAS PubMed .
  33. X. N. Guo, C. H. Hao, G. Q. Jin, H. Y. Zhu and X. Y. Guo, Angew. Chem., 2014, 126, 2004–2008 CrossRef PubMed .
  34. J. Jiao and S. Seraphin, J. Appl. Phys., 1998, 5, 2442–2448 CrossRef PubMed .
  35. D. Kim and H. Lee, J. Appl. Phys., 2001, 10, 5703–5706 CrossRef PubMed .

This journal is © The Royal Society of Chemistry 2015
Click here to see how this site uses Cookies. View our privacy policy here.