Exploiting XPS for the identification of sulfides and polysulfides

Marzia Fantauzzi*ab, Bernhard Elsenerabc, Davide Atzeiab, Americo Rigoldiab and Antonella Rossiab
aDipartimento di Scienze Chimiche e Geologiche, Università degli Studi di Cagliari, Campus di Monserrato S.S. 554, Italy. E-mail: fantauzzi@unica.it
bINSTM, UdR, Cagliari, Italy
cETH Zurich, Institute for Building Materials, ETH Hönggerberg, CH-8093 Zurich, Switzerland

Received 27th July 2015 , Accepted 28th August 2015

First published on 28th August 2015


Abstract

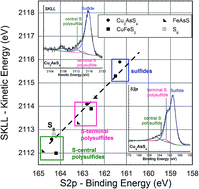
The identification of surface sulfide and polysulfide species based on the curve fitting of S2p photoelectron spectra and, for the first time, of X-ray excited S KLL Auger spectra has been performed. The different sulfur chemical states present on the surface (sulfide S2−, central S and terminal S in polysulfide chains) could be unambiguously assigned in the chemical state plot. Sulfur atoms in the central or terminal position, respectively, are found on a line with slope ca. −3 irrespective of the cation indicating similar initial state effects. On the other hand, for a given polysulfide, e.g. K2Sn, sulfur atoms both in central or terminal positions are found on the same line with slope −1 indicating similar final state effects. This behavior can be rationalized with the fact that the negative charge in polysulfide chains is located mainly on sulfur atoms in the terminal position; indeed, sulfur present as central S shows a binding energy shift of −0.6 eV with respect to elemental sulfur (S8), and sulfur in terminal S a shift of −2.4 eV. An application of this approach tested on commercial alkali polysulfides is provided for the curve fitting of SKLL signals and sulfur speciation of three different sulfide minerals enargite (Cu3AsS4), chalcopyrite (CuFeS2) and arsenopyrite (FeAsS). Also for the surface of mineral sulfides, terminal S atoms and central S atoms in the polysulfide chains can successfully be identified.


1. Introduction

The problem of sulfur speciation at the surfaces of materials is of general interest, involving chemists, geochemists, physics and material scientists. Sulfur speciation is of crucial importance for studies on portable storage devices (rechargeable Li–S batteries),1–3 on mineral processing and oxidation processes,4,5 on tribology,6,7 on sorbents for desulfurization8 and on corrosion phenomena.9

Authors have been involved over the last decade in research on arsenic bearing sulfide minerals oxidation10–14 and bio-oxidation and particular attention was devoted to the investigation of the surface alteration of the minerals by means of surface analytical techniques (XPS and XAES) in order to clarify the mechanism of oxidative dissolution especially for enargite. In fact, it is acknowledged, that different sulfide minerals follow different bio-oxidation paths.15 Pyrite (FeS2) for example, is known to be bio-leached according to a mechanism that leads to the formation of sulfate ions: thiosulfates are proposed to be present as intermediates. Sphalerite (ZnS) on the other hand, is also bio-oxidized but in this case the mechanism which takes place should have the polysulfides as intermediate.15 The identification of sulfur species at the surfaces of the minerals is thus essential to clarify and thus to control the oxidation mechanism.

The use of the Auger parameter and of chemical state plots16,17 was found to be useful for highlighting the chemical state of the elements on sulfide minerals but, in the previous works, sulfur speciation by means of XPS and XAES was carried out without any attempt of curve fitting of the X-ray induced Auger SKLL signal.11,14 Sulfur speciation was carried out on the basis of only the S2p signal and data interpretation was in some cases ambiguous. In agreement with the literature while the difference of about 8 eV between sulfide (S2−) and sulfate (S6+) makes straightforward the identification of sulfur chemical state when this element is present in intermediate oxidation state its chemical environment is still controversial. The S2p signals between 162.5 and 164.5 eV have been assigned to elemental sulfur,18,19 polysulfide enriched layers20 and metal deficient sulfide layers.21

This work focuses on a detailed analysis of the S2p and SKLL signals of commercial alkali metal sulfides and polysulfides, in analogy with a previous investigation on alkali sulfates.22 Alkali metal sulfides and polysulfides due to their high reactivity and fast oxidative polymerization that lead to the formation of polysulfides were chosen since they can be regarded as model systems for investigating the oxidation of sulfur bearing materials. For the first time, the chemical state plot obtained after SKLL curve fitting is presented and explained in terms of initial state effects (ground state valence charge of the photoexcited atoms and Madelung potential) and in terms of relaxation energies (final state effects) and polarizability.

Furthermore, an application of this approach is provided for the SKLL signal of three different sulfide minerals: enargite (Cu3AsS4), chalcopyrite (CuFeS2) and arsenopyrite (FeAsS). Differences in terms of initial state effects and relaxation energies compared to elemental sulfur are discussed.

2. Experimental

2.1 Sample preparation

A series of alkali metal sulfides and polysulfides were analyzed by XPS and XAES: their purity together with the suppliers is listed in Table 1. All products were stored and opened in argon atmosphere using a Unilab MBrown glove box (residual O2 and water were lower than 1 mg kg−1). Powders were ground and mounted as pellet on a standard VG sample holder. A closed bell shaped device, described in,22 was used to transfer the samples from the glove box to the spectrometer analysis chamber, without contact with the laboratory atmosphere.
Table 1 Details of the commercial sulfides and polysulfides analyzed in this work
Compounds Purity Supplier
Li2S anhydrous 99% Alfa Aesar
Na2S anhydrous 100% Alfa Aesar
Na2S4 90–95%, H2O 5% max. Alfa Aesar
K2Sn K2S 42% min. Riedel de Haën


All the experiments were performed at the liquid nitrogen temperature.

Together with the model compounds an arsenopyrite (FeAsS) sample from China, an enargite (Cu3AsS4) sample from Leonard Mine, Butte, Montana (USA) and a sample of chalcopyrite (CuFeS2) from a private collection and unknown provenance were analyzed after cleavage and air exposure for one week and after grinding for ten minutes under argon in the glove box, in order to investigate by XPS a fresh, un-oxidized surface.

2.2 XPS analyses

XPS analyses were performed with an ESCALAB200 manufactured by Vacuum Generator Ltd, East Grinstead, UK. Spectra were collected with the Al Kα1,2 (1486.6 eV) operated at 20 mA and 15 kV (300 W). Al Kα source allows measuring the SKLL line that is found at ca. 2115 eV using the bremsstrahlung. The analyzer was operated in constant analyzer energy (CAE) mode, at 20 eV pass energy for high-resolution spectra, and at 50 eV for the acquisition of the survey spectra. The full-width at half-maximum (FWHM) of the Ag3d5/2 line, at 20 eV was measured to be 1.1 eV. The intensity/energy response function was evaluated to be equal to image file: c5ra14915k-t1.tif. The instrument was calibrated according to the ISO 15472:2001 – surface chemical analysis – X-ray photoelectron spectrometers – calibration of energy scale. To ensure an appropriate alignment in the region of the SKLL peak, the position of the AuM4N7N7 Auger peak at 2101.3 eV was checked.23 In this work it was found at 2101.1 eV.

XPS spectra were processed by CasaXPS software – version 2.3.16 (Casa Software Ltd, Wilmslow, Cheshire, UK). The composition was calculated according to,24 starting from the experimental areas that were corrected for the sensitivity factors calculated taking into account Scofield's photoionization cross sections,25 the asymmetry parameter26 and the intensity/energy response function.

3. Results

In this section the results of XPS and XAES analyses on the commercial sulfides and polysulfides are presented together with the spectra recorded on the sulfide minerals.

3.1 Lithium, sodium and potassium sulfides and polysulfides

The survey spectra of Li2S, Na2S, Na2S4 and K2Sn (Fig. 1A–D) showed the presence of all the elements constituting the salts together with small amount of carbon as organic contaminant and oxygen. The oxygen peak is quite intense in all samples and it might be ascribed to both adsorbed contamination and presence of sulfates as oxidation product; this is also confirmed by the signal at binding energy values higher than 168 eV of the sulfur S2p high-resolution spectra for all the samples (Table 2).
image file: c5ra14915k-f1.tif
Fig. 1 Survey spectra of commercial sulfides and polysulfides. (A) Li2S; (B) Na2S; (C) Na2S4; (D) K2Sn (X-ray source: Al Kα).
Table 2 Binding energy (eV) values of S2p3/2 components and FWHM (eV) of all peaks of commercial sulfides and polysulfides. The binding energy value of the cations is also provided
Compound Assignment Binding energy (eV) FWHM (eV) Cation (BE) eV
Li2S Sulfide 160.8 (0.1) 1.4 (0.1) Li1s (I) = 55.9 (0.2), Li1s (II) = 54.9 (0.2)
Polysulfide (terminal S) 162.3 (0.1) 1.4 (0.1)
Polysulfide (central S) 163.9 (0.1) 1.4 (0.1)
Sulfite 167.8 (0.1) 1.4 (0.1)
Sulfate 169.6 (0.1) 1.4 (0.1)
Na2S Polysulfide (terminal S) 161.7 (0.1) 1.4 (0.1) Na1s = 1071.6 (0.1)
Polysulfide (central S) 163.3 (0.1) 1.4 (0.1)
Sulfate 168.8 (0.1) 1.4 (0.1)
Na2S4 Polysulfide (terminal S) 161.8 (0.1) 1.4 (0.1) Na1s = 1071.5 (0.1)
Polysulfide (central S) 163.4 (0.1) 1.4 (0.1)
Sulfate 168.8 (0.1) 1.4 (0.1)
K2Sn Polysulfide (terminal S) 161.9 (0.1) 1.4 (0.1) K2p3/2 = 292.8 (0.2)
Polysulfide (central S) 163.5 (0.1) 1.4 (0.1)
Sulfate 168.6 (0.1) 1.4 (0.1)


S2p spectra of all the commercial samples (Fig. 2A–D) showed the presence of multicomponent peaks, consisting of multiple doublets S2p3/2–S2p1/2 (binding energy difference constrained to 1.2 eV together with the intensity ratio 2[thin space (1/6-em)]:[thin space (1/6-em)]1).


image file: c5ra14915k-f2.tif
Fig. 2 XPS high-resolution S2p spectra of (A) Li2S, (B) Na2S, (C) Na2S4, (D) K2Sn and XAES high-resolution SKLL spectra of (E) Li2S, (F) Na2S, (G) Na2S4, (H) K2Sn.

S2p3/2 binding energy values are reported in Table 2 as means over three or more independent measurements with their corresponding standard deviations. The binding energy of the sulfate, according to ref. 22 was chosen as an internal reference for the binding energy scale.

XAES SKLL peaks are shown in Fig. 2E–H. Curve fitting procedure started from the information obtained on alkali metal sulfate, published in a previous paper.22 According to it, SKL23L23 peak consists of three components: the main peak was the SKL23L23 (1D) component and it was found at 8.1 eV lower than SKL23L23 (1S). Between the two peaks a satellite was revealed and the separation between SKL23L23 (1D) was constrained to 4.2 eV. Together with the kinetic energy separation, also the intensity ratios were fixed as following: SKL23L23 (1S): SKL23L23 (1D) = 0.09 and sat: SKL23L23 (1D) = 0.05.

Polysulfides are chains with variable length of sulfur atoms. One can distinguish sulfur atoms in the center of the chain (central-S) and sulfur atoms at the end of the chain (terminal-S).

Li2S. S2p signal of commercial lithium sulfide (Fig. 2A) showed the presence of five doublets, whose binding energy values and full-width at half-maximum are listed in Table 2 together with the binding energy of Li1s. The binding energy values ranged between 160.8 eV and 169.6 eV.

Five different components were also used to fit the SKLL signal (Fig. 2E). The kinetic energy values of the most intense peak SKL23L23 (1D) of each triple-peak component are listed in Table 3.

Table 3 Kinetic energy (eV) and FWHM (eV) of the SKL23L23 (1D) peaks in SKLL signals of commercial sulfides and polysulfides
Compound Assignment SKL23L23 (1D) KE (eV) FWHM (eV)
Li2S Sulfide 2114.3 (0.2) 1.7
Polysulfide (terminal S) 2113.0 (0.2) 1.7
Polysulfide (central S) 2111.0 (0.2) 1.7
Sulfite 2106.9 (0.2) 1.8
Sulfate 2105.1 (0.2) 1.8
Na2S Polysulfide (terminal S) 2114.5 (0.2) 2.2
Polysulfide (central S) 2113.4 (0.2) 2.2
Sulfate 2106.2 (0.2) 1.8
Na2S4 Polysulfide (terminal S) 2114.2 (0.2) 2.1
Polysulfide (central S) 2113.1 (0.2) 2.1
Sulfate 2106.2 (0.2) 1.8
K2Sn Polysulfide (terminal S) 2115.1 (0.2) 2.1
Polysulfide (central S) 2113.5 (0.2) 2.1
Sulfate 2106.4 (0.2) 1.8


Na2S. S2p spectra of Na2S showed the presence of three doublets (Table 2) ranging from 161.7 eV to 168.8 eV (Fig. 2B). Three doublets were thus used for curve fitting the SKLL signal (Fig. 2F) and the kinetic energy of the 1D peak of each component is provided in Table 3.
Na2S4. In Fig. 2C the S2p signal of Na2S4 sample is shown. The binding energy of the S2p3/2 component of each doublet is given in Table 2, together with the binding energy of the cation. The binding energy values ranged between 161.8 and 168.8 and there are not significant differences compared to Na2S. In Fig. 2G and Table 3 the SKLL signal is shown and the kinetic energy of the 1D components are listed.
K2Sn. Potassium polysulfide showed a multicomponent S2p signal (Fig. 2D). The binding energy values ranged from 161.9 to 168.6 eV (Table 2). The kinetic energy of the SKLL (Fig. 2H), ranging from 2106.4 eV to 2115.1 eV is listed in Table 3.

3.2 Sulfide minerals

The S2p and SKLL spectra recorded on ground sulfide minerals air-exposed for one week are provided in Fig. 3. All the minerals showed the presence of complex multicomponent S2p signals with sulfur atoms in different chemical state (sulfide, terminal sulfur and central sulfur in poly-sulfides). Each component consists of a doublet S2p3/2–S2p1/2; the separation energy and the intensity ratio were constrained at 1.2 eV and at 0.5 eV respectively. In Table 4 the binding energy values of the S2p3/2 components of each sulfide minerals are listed together with the kinetic energy of the 1D-SKLL components. Both arsenopyrite (FeAsS) and chalcopyrite (CuFeS2) showed the presence of sulfates.
image file: c5ra14915k-f3.tif
Fig. 3 S2p and SKLL spectra of air exposed sulfide minerals: enargite (Cu3AsS4), chalcopyrite (CuFeS2) and arsenopyrite (FeAsS).
Table 4 Binding energy of S2p photoelectron peaks (eV), kinetic energy of SKLL Auger components after curve fitting and kinetic energy of the SKLL at the peak maxima. The Auger parameters α′ of the sulfide minerals were calculated taking into account in one case the kinetic energy of each the 1D-SKLL component (α′ (1)) and considering the kinetic energy at the peak maximum (α′ (2)) as usually reported
Mineral Sulfur chemical state S2p3/2-BE (eV) SKLL-KE 1D (eV) SKLL KE peak maximum (eV) α′ (1) eV α′ (2) eV
Enargite Sulfide 161.3 (0.1) 2115.9 (0.2) 2115.6 (0.2) 2277.2 (0.2) 2276.9
Polysulfide (terminal S) 162.8 (0.1) 2114.1 (0.2) 2276.9 (0.2) 2278.4 (0.2)
Polysulfide (central S) 164.4 (0.1) 2112.6 (0.2) 2277.0 (0.2) 2280.0 (0.2)
Chalcopyrite Sulfide 161.5 (0.1) 2115.3 (0.2) 2115.3 (0.2) 2276.8 (0.2) 2276.8 (0.2)
Polysulfide (terminal S) 162.6 (0.1) 2113.9 (0.2) 2276.5 (0.2) 2277.9 (0.2)
Polysulfide (central S) 164.2 (0.1) 2112 (0.2) 2276.2 (0.2) 2279.5 (0.2)
Sulfate 169.8 (0.1) 2106.9 (0.2)      
Arsenopyrite Sulfide 162.4 (0.1) 2114.4 (0.2) 2114.0 (0.2) 2276.8 (0.2) 2276.4 (0.2)
Polysulfide (terminal S) 163.2 (0.1) 2113.3 (0.2) 2276.5 (0.2) 2277.2 (0.2)
Polysulfide (central S) 164.8 2112.1 (0.2) 2276.9 (0.2) 2278.8 (0.2)
Sulfate 169.9 2105.4 (0.2)      


The curve fitting of the SKLL signals was performed using three components for each sulfur species identified in the S2p spectra. The curve fitting parameters were determined on the sulfide minerals analyzed after grinding for 10 minutes in glove box, under argon fluxing. The spectra of the ground minerals and the peak fitting parameters are shown in the ESI (S.I. Fig. 1 and. Table S.I. 1).

Some differences are observed between the binding energy values of S2p spectra and the kinetic energy values of SKLL spectra of the copper containing minerals (enargite and chalcopyrite) and of arsenopyrite (Table 4): the BE of the sulfide component in Cu3AsS4 and CuFeS2 are about 1 eV lower than the BE of the same component in FeAsS. On the contrary, the Auger parameter calculated taking into account the kinetic energy of each 1D-SKLL component (column α′ (1) in Table 4) are close to each other for the different minerals, and it is within the experimental error for the different sulfur component in each mineral.

4. Discussion

Due to their high reactivity and fast oxidative polymerization toward elemental sulfur, alkali metal sulfides have been used to modeling the intermediate polysulfide species formed at the surface of mineral sulfides.27 In this paper, sulfur chemical state of commercial sulfides and polysulfides is presented together with the aspects related to bond polarizability. Two commercial sulfides (Li2S and Na2S) and two commercial polysulfides have been investigated. All samples showed multicomponent S2p peaks. The Auger parameter and the chemical state plot will be applied to clarify the differences among the alkali metal sulfides and polysulfides and to identify the chemical state of sulfur at the surface of sulfide minerals.

4.1 Alkali metal sulfides: chemical state analysis from binding energies values

According to literature3 a single doublet S2p3/2–S2p1/2 was expected at 160.4 eV for Li2S but in the present work five doublets ranging from 160.5 eV to 169.6 eV were detected. The first doublet was ascribed to lithium sulfide Li2S. Since alkali metal sulfides are very reactive and tend to polymerize the two peaks at 162.3 and 163.9 eV could be assigned to terminal-S and to central-S of the corresponding polysulfide that do not show a partial negative charge, in the polysulfide chains.

In sodium sulfide Na2S two doublets, separated by 1.6 eV, were revealed. The lower binding energy component was found at 161.7 eV while the higher one at 163.3 eV. According to literature28 the binding energy of S2− in sodium sulfide should be 160.8 eV. The presence of a doublet separated by 1.6 eV led us to conclude that, similarly to Li2S, despite the fact that the sulfides pellets were prepared under argon in a glove box to avoid surface oxidation and contamination, the surfaces of the samples were oxidized and polysulfide chains were present. In fact, in Na2S4 a similar doublet of S2p3/2–S2p1/2 doublets was found at 161.7 eV and 163.3 eV and they are assigned to terminal S and central S atoms in the polysulfide chains. Taking into account the presence of Na2SO4 and subtracting its contribution to the S2p area, the quantitative analysis allows assessing that, as far as the polysulfide is concerned, Na and S are in 1[thin space (1/6-em)]:[thin space (1/6-em)]2 ratio but instead of Na2S4, a mixture of polysulfides with different chain lengths is likely present since a 1[thin space (1/6-em)]:[thin space (1/6-em)]1 ratio of the two S2p doublets should be expected for S42− ions.

Similar results were obtained for Na2S4. S2p peak consisted of three doublets: the higher binding energy one is due to sulfate.22 The doublet at 161.8 eV might be assigned to terminal S sulfur species in the polysulfide chain and the 163.4 eV component should be ascribed to the central S atoms in the polysulfide chain.27 The experimentally determined stoichiometry (Table S.I. T2) is in agreement with Na2S4 but since a 1[thin space (1/6-em)]:[thin space (1/6-em)]1 ratio of the two S2p components at 161.8 and 163.4 eV should be expected for S42− ions, probably instead of Na2S4, a mixture of polysulfide might be envisaged.

Similarly K2Sn showed the presence of both sulfate signal (S2p3/2 = 168.6 eV) and polysulfide, with the terminal S sulfur atom at 161.9 eV and the central S one at 163.5 eV.

So apparently, despite the high purities declared by the suppliers (Table 1) for Li2S and Na2S and despite the care taken in the pellets preparation under controlled dried argon atmosphere, the sulfide ion S2− was only found in Li2S (together with polysulfides and S–O species). The sulfide at the surface of Na2S was completely polymerized and some sulfate ion was detected as well. It is worth noting that no significant modifications are induced at the surface of Na2S as a consequence of grinding. The comparison of S2p signals recorded on the as received Na2S pressed powder and on the powder pressed after 20 minutes grinding, did not show any significant change in peak shapes and positions (S.I. Fig. 2).

4.2 Effect of the cations

Table 2 shows that the binding energy values of S2p components due to poly-sulfides (terminal S atoms) decrease from 162.8 for Li2S to 161.9 eV for K2S eV. The binding energy shift, ΔBE, is due to both intra-atomic effect and extra-atomic effect since, according to the charge potential model29 it can be written as follows:
 
image file: c5ra14915k-t2.tif(1)

In eqn (1) the first term represents the intra-atomic effect (k describes the Coulomb interactions between core and valence electrons on atom i with charge qi) while the second term represents the inter-atomic effect. In ionic solids it is often referred to as Madelung potential (VM) and it sums the potential at atom i due to changes at surrounding atoms j (di–j is the bond distance).

The decrease of S2p binding energy values, going from Li to K poly-sulfides, might be explained in terms of initial state effect and it might be due to the increase in the average valence orbital radius (rv) that affects the first term of eqn (1), being k = 1/rv. In analogy with22,29 the intra-atomic effect can be described also taking into account the ionization potential (I) of the cations. In Fig. 4 a linear trend is observed for the ionization potential vs. the binding energy chemical shift between the cations (Li+, Na+ and K+) in polysulfides and the elemental Li, Na and K.


image file: c5ra14915k-f4.tif
Fig. 4 First ionization potential of the cations vs. binding energy shift between the cations in the polysulfides and the pure metals.

Lithium shows positive binding energy shift during the formation of the polysulfide: being Δqi positive and VM negative for cations, the intra-atomic effects are predominant (eqn (1)). On the contrary, for Na and K, (ΔBE < 0) the inter-atomic effect are predominant, since |VM| > Δqi.

The shift towards lower binding energy of S2p signal passing from Li to K further confirms the effect of the first ionization potential: if I decreases an increase of the delocalization of the valence electrons from the metal ion to S is observed. Lower BE values of S2p indicate that the negative charge on the S atoms is higher.

4.3 Chemical state plot: relaxation energies and final state effects

It is known that the Auger parameter and chemical state plots are essential tools to interpret the chemical state of elements in different compounds when the binding energy is not enough to univocally define it, while the combined information obtained by photoelectron binding energies and Auger electron kinetic energies, allows the identification.16,17 As far as Auger parameter and chemical state plot is concerned the authors already devoted their attention to their application on the study of sulfide minerals13,14 and of minerals of environmental interest.30

The concept of Auger parameter is based on the idea that there is a fixed difference between two line energies (Auger and photoelectron) of the same element in different compounds. The modified Auger parameter is thus defined as:

 
α′ = BEphotoelectron + KEAuger (2)

For the same element in different compounds, the shifts in the Auger parameter Δα′ are related to differences in the relaxation energies (final state effects) due to the neighbor atoms (ΔRea extra-atomic relaxation energy)17 and the simple experimental determination of Δα′ represents an easy way to measure polarization energy, since:

 
Δα′ = 2ΔRea (3)

The experimental measurement of the polarization energy for sulfur (and phosphorus) is not so straightforward since in the Auger SKLL emission, both S1s and S2p electrons are involved. The S2p orbitals are spatially modified by alteration of the atomic environment, thus the S2p shift differs from the S1s shift and the relationship between Δα′ and ΔRea for sulfur has to be re-written as follows:17

 
Δα′ = 0.16ΔBES2p + 2ΔRea (4)

In this paper elemental sulfur (S8) was chosen as a reference for Δα′ calculation. XPS spectra of S8 acquired in the same experimental conditions, were already reported in ref. 22 and in Table 5 the α′ values, the ΔBE and the ΔRea evaluated for sulfide and polysulfide are listed. Sulfate components are not considered here since a detailed investigation is already published.22

Table 5 Modified Auger parameter α′ (eV), Auger parameter shift Δα′ and extra-atomic relaxation energy shift ΔRea calculated for the sulfide (Li2S) and the polysulfide components of the alkali metal commercial sulfides and polysulfides
  α′ (eV ± 0.2) Δα ΔBE (eV) ΔRea
S8 2277.1
Li2S 2275.1 −2.0 −3.5 −0.7
Li2Sn (terminal S) 2275.3 −1.8 −2.0 −0.7
Li2Sn (central S) 2274.9 −2.2 −0.4 −1.0
Na2S (terminal S) 2276.2 −0.9 −2.6 −0.2
Na2S (central S) 2276.7 −0.4 −1 −0.1
Na2S4 (terminal S) 2276 −1.1 −2.4 −0.3
Na2S4 (central S) 2276.5 −0.6 −0.8 −0.1
K2Sn (terminal S) 2277 −0.1 −2.4 −0.1
K2Sn (central S) 2277 −0.1 −0.8 −0.01


The chemical state plot of sulfur in alkali metal sulfide and polysulfide is shown in Fig. 5.


image file: c5ra14915k-f5.tif
Fig. 5 Chemical state plot of sulfur for alkali metal sulfides and polysulfides. Dashed lines: same final state effect, slope of the line 1. Dotted lines: same initial state effect, slope −2.8.

On the chemical state plot, the dots that fall on straight lines with slope −1 have the same α′ value and, according to eqn (4), the shifts in the Auger parameter values are due to differences in the final state effects: higher Auger parameter values are related to higher values of extra-atomic relaxation energy. The relaxation energy represents a contribution to the measured photoelectron binding energy or Auger electron binding energy, that is due to the response of the solid or molecule to the creation of the hole states. The extra-atomic relaxation energy is determined by the polarizability of the chemical environment of the excited atom.31

The chemical state plot of sulfur (Fig. 5) and the data reported in Table 5 lead to the following considerations:

(1) There are not significant differences in the Auger parameter α′ of lithium sulfide and polysulfides so there are not significant differences in extra atomic relaxation energies (Table 4).

(2) α′ value for Li–S compounds is different from α′ calculated for Na and K–S compounds.

(3) The differences of the extra-atomic relaxation energies calculated with respect to elemental S22 are more negative for Li–S compounds than for Na–S compounds. Potassium polysulfides showed the same Δα′ value of elemental sulfur.

The lower ΔRea, the lower is the polarizability of the chemical environment. In Li–S compounds, the polarization of the electronic cloud toward the holes is less efficient due to the lower number of electrons available on Li atoms.

4.4 Chemical state plot: initial state effects

The position of the dots in the chemical state plot can be also explained in terms of initial state effects, since according to ref. 17 the following equation can be written as:
 
KEAuger = [const + 2(VM + kQ)] − 3BEphotoelectron (5)

This equation shows that the chemical states with similar initial state effects (Madelung energy, VM and valence charge Q) will appear in the chemical state plot on straight lines with slope −3 and intercept I = [const + 2(VM + kQ)]. For S containing compounds, eqn (5) has to be re-written (due to the BE correction term in eqn (4)) as follows:

 
KESKLL = [const + 2(VM + kQ)] − 2.85BES2p (6)

According to eqn (6), S species for which the initial state effect contribution to KE is the same, lie on straight lines with slope 2.85 (dotted lines in Fig. 5). Fig. 5 clearly shows that the points for both the terminal and central sulfur atom in polysulfide chains have the same initial state effect (fall on a line with slope ca. 3) irrespective of the different cations.

The shift in the intercept with respect to elemental sulfur can be expressed in terms of initial state effects according to eqn (7):

 
ΔKE = 2Δ(VM + kQ) (7)

Being Sn2− an anion, VM has positive values and Q has negative values. The ΔKE value is negative for both the central sulfur atoms in the polysulfide chain and the terminal ones. A negative ΔKE value is due, in these cases, to the higher ionicity of the chemical bonds, compared to elemental sulfur. The larger |ΔKE| values of the terminal S atoms, compared to the central S atom, are in agreement with the assumption that it is Q to determine the negative KE shift. This is in agreement with theoretical studies32 that showed that the negative charges are essentially localized at the outermost sulfur atoms in polysulfide chains whereas the inner atoms only carry small amounts of negative charge.

4.5 The chemical state of sulfur in mineral sulfides

All mineral samples studied in this paper were analyzed after grinding for ten minutes in glove box, under argon, to expose fresh surfaces in order to obtain the signals of the pure sulfides (Fig. S.I. 2), and after one week of air exposure (Fig. 3) in order to verify the presence of oxidation products. The binding energy of the pure sulfides (S2−) was found to be 161.3 (0.1) eV for enargite, 162.4 (0.1) eV for arsenopyrite and 161.5 (0.2) eV for the chalcopyrite sample. While the S2p showed the presence of a single doublet for enargite and arsenopyrite, chalcopyrite spectra showed the presence of two more S2p3/2–S2p1/2 doublets, in analogy with the air exposed sample (Fig. 3). The higher binding energy doublets found at the surfaces of the air-exposed mineral samples between 162.8 and 164.8 eV were thus assigned to polysulfides and the peaks at about 170 eV were ascribed to sulfate (Table 4).

The curve fitting parameters obtained on SKLL signals of enargite and arsenopyrite analyzed after grinding (Table S.I. 1) were then applied to the more complex signals acquired on the air exposed mineral samples. It is worth noting that, while S2p component assigned to sulfide did not show any shift despite the sample treatment, a 2 eV shift of the SKLL signal is observed for the ground minerals and the air-exposed samples, as a consequence of exposure to the atmosphere.

According to the traditional approach to chemical state study of sulfur in sulfide minerals, the authors used to consider only the SKLL peak maximum to calculate Auger parameters.13,14 As a consequence, plotting the data reported in Table 4, the chemical state plot in Fig. 6A was obtained.


image file: c5ra14915k-f6.tif
Fig. 6 Chemical state plot of sulfur in air-exposed sulfide minerals. (A) The SKLL kinetic energy value corresponds to the peak maximum. (B) The SKLL kinetic energy value of each 1D component after curve fitting is considered.

The interpretation of the sulfur chemical state plot in Fig. 6A, in terms of differences in relaxation energies and initial state effects is obviously misleading, being the position of the dots in the plot due to a data analysis approximation. The only benefit of using that approach seems to be the possibility of differentiates copper-containing minerals (enargite, Cu3AsS4 and chalcopyrite, CuFeS2) from arsenopyrite (FeAsS).

The chemical state plot obtained following the novel curve fitting approach for processing the SKLL signals of sulfides and polysulfides is shown in Fig. 6B. Only small differences are found in the Auger parameter values (see Tables 4 and 5), so all the points are found around one diagonal line. The position of the dots may be rationalized in terms of initial state effects, taking into account the different charges on the sulfur atoms. So the region of sulfides, terminal S atoms in the polysulfide chain and central S atoms in the polysulfide chains can clearly be located.

As far as the lower binding energy component of arsenopyrite is concerned, its position in the Wagner plot is close to the terminal sulfur in polysulfide chains at the surfaces of enargite and chalcopyrite. The reason of this finding might be due to the different crystal structure of arsenopyrite which is derived from that of marcasite (orthorhombic FeS2) and contains As–S dianions with octahedral coordination to iron with a covalent bond similar to that of S–S bond in pyrite and marcasite33 which are disulfides.

The dots corresponding to central-S atoms fall close to elemental sulfur. This is not surprising since the oxidation number on those sulfur atoms is formally zero and the negative charge on the central atoms of the Sn2− chain is close to zero, in agreement with the results obtained on commercial alkali metal polysulfides.

4.6 Comparison of the chemical state of sulfur in alkali polysulfides and in minerals

The chemical state plot (Fig. 7) summarizes all the results from this investigation, comparing the chemical state of central-S and terminal-S of alkali polysulfides and minerals.
image file: c5ra14915k-f7.tif
Fig. 7 Chemical state plot of sulfur in air-exposed sulfide minerals and alkali metal sulfides and polysulfides. Standard deviation of replica measurements are given by the size of the symbols used for the different compounds.

The peculiarity (much lower Auger parameter α′) of lithium sulfides and polysulfides is further confirmed. More important the dots corresponding to alkali polysulfides and of the polysulfides at the surfaces of the minerals fall all on the same diagonal line with Auger parameter α′ = 2276.5 eV, indicating that the final state effects are identical for all sulfur atoms irrespective of chemical state (terminal-S, central-S, S2−) and cations in these compounds.

The influence of the mineral composition and structure has already been discussed (Section 4.5), one can note that the difference between the three minerals is negligible for central-S, whereas terminal S and S2− of arsenopyrite (FeAsS) are increasingly more far from the corresponding sulfur atoms in enargite and in chalcopyrite (see also Tables 2–4).

Comparing the different sulfur chemical states of alkali polysulfides with the corresponding chemical state on minerals, one can note that both the central-S sulfur atoms and the terminal-S atoms on copper based minerals (Cu3AsS4, CuFeS2) are shifted by ca. +1 eV in BE and −1 eV in KE. Both shifts can be explained in terms of different initial state effects, and in particular in terms of ionicity of the metal–sulfur bonds. From eqn (7) the positive KE shift of alkali-metal polysulfide, compared to the minerals, may be ascribed to a higher charge on sulfur atoms, and according to eqn (1) a higher negative charge on sulfur atoms determines a negative binding energy shift. Differences in relaxation energies due to bond polarizability seem to be much less significant.

5. Conclusions

Sulfur speciation in this work uses for the first time curve fitting of the X-ray excited SKLL Auger signal together with the S2p signal traditionally applied. The following conclusions can be drawn:

• Curve fitting of the SKLL Auger signal as proposed in this work allows unambiguously assignment of the sulfur chemical state in commercial alkali-polysulfides, sulfide S2− and central S or terminal S in polysulfide chains.

• Sulfur in the terminal position of a polysulfide chain is shifted by ca. 1.6 eV to lower binding energies compared to sulfur in the central position, confirming that the negative charge in the polysulfide chain is located at the end positions.

• Sulfur in the terminal and in the central position fall each on a separate line with slope ca. −3 in the chemical state plot irrespective of the cation (Li, Na, K), indicating similar identical initial state effects.

• Application of this approach with curve fitting of the SKLL Auger signal to air exposed sulfur minerals highlighted that sulfide S2−, terminal S and central S atoms could be clearly identified. Binding and kinetic energy of these sulfur atoms decrease going from S2− to central S, but all have the same Auger parameter α′ = 2276.5 ± 0.4 eV. This means that the extra-atomic relaxation energy is approximately identical.

The Auger parameter α′ is identical for sulfur atoms in Na and K polysulfides and for sulfur atoms at the surface of air exposed sulfur minerals. Thus the atomic environment for sulfur is the same and not influenced by the cation.

Acknowledgements

Sardinia Regional Government is gratefully acknowledged for the financial support (P.O.R. Sardegna F.S.E. Operational Program of the Regione Autonoma della Sardegna, European Social Fund 2007–2013 – Axis IV Human Resources, Objective 1.3, Line of Activity 1.3.1 “Avviso di chiamata per il finanziamento di Assegni di Ricerca”).

References

  1. X. Ji and L. F. Nazar, J. Mater. Chem., 2010, 20, 9821–9826 RSC .
  2. P. G. Bruce, S. A. Freunberger, L. J. Hardwick and J. Tarascon, Nat. Mater., 2012, 11, 19–29 CrossRef CAS PubMed .
  3. Y. Fu, Y. Su and A. Manthiram, Angew. Chem., 2013, 125, 7068–7073 CrossRef PubMed .
  4. P. Lattanzi, S. Da Pelo, D. Atzei, B. Elsener, M. Fantauzzi and A. Rossi, Earth-Sci. Rev., 2008, 86, 62–88 CrossRef PubMed .
  5. C. L. Corkhill and D. J. Vaughan, Appl. Geochem., 2009, 24, 2342–2361 CrossRef CAS PubMed .
  6. A. Rossi, F. M. Piras, D. Kim, A. J. Gellman and N. D. Spencer, Tribol. Lett., 2006, 23, 197–208 CrossRef CAS .
  7. R. Heuberger, A. Rossi and N. D. Spencer, Tribol. Lett., 2007, 25, 185–196 CrossRef CAS .
  8. M. Mureddu, I. Ferino, A. Musinu, A. Ardu, E. Rombi, M. G. Cutrufello, P. Deiana, M. Fantauzzi and C. Cannas, J. Mater. Chem. A, 2014, 2, 19396–19406 CAS .
  9. A. Rossi, B. Elsener, G. Hähner, M. Textor and N. D. Spencer, Surf. Interface Anal., 2000, 29, 460–467 CrossRef CAS .
  10. M. Fantauzzi, C. Licheri, D. Atzei, G. Loi, B. Elsener, G. Rossi and A. Rossi, Anal. Bioanal. Chem., 2011, 401, 2237–2248 CrossRef CAS PubMed .
  11. M. Fantauzzi, G. Rossi, B. Elsener, G. Loi, D. Atzei and A. Rossi, Anal. Bioanal. Chem., 2009, 393, 1931–1941 CrossRef CAS PubMed .
  12. M. Fantauzzi, B. Elsener, D. Atzei, P. Lattanzi and A. Rossi, Surf. Interface Anal., 2007, 29, 908–915 CrossRef PubMed .
  13. B. Elsener, D. Atzei, M. Fantauzzi and A. Rossi, Eur. J. Mineral., 2007, 19, 353–361 CrossRef CAS PubMed .
  14. M. Fantauzzi, D. Atzei, B. Elsener, P. Lattanzi and A. Rossi, Surf. Interface Anal., 2006, 38, 922–930 CrossRef CAS PubMed .
  15. A. Schippers and W. Sand, Appl. Environ. Microbiol., 1999, 65, 319–321 CAS .
  16. C. D. Wagner, L. J. Gale and R. H. Raymond, Anal. Chem., 1979, 51, 466–482 CrossRef CAS .
  17. G. Moretti, J. Electron Spectrosc. Relat. Phenom., 1998, 95, 95–144 CrossRef CAS .
  18. J. Asbjornsson, G. H. Kelsall, R. A. D. Pattrick, D. J. Vaughan, P. L. Wincott and G. A. Hope, J. Electrochem. Soc., 2004, 151, E250–E256 CrossRef PubMed .
  19. R. S. C. Smart, W. M. Skinner and A. R. Gerson, Surf. Interface Anal., 1999, 28, 101–105 CrossRef CAS .
  20. J. R. Mycroft, H. W. Nesbitt and A. R. Pratt, Geochim. Cosmochim. Acta, 1995, 59, 721–733 CrossRef CAS .
  21. Y. L. Mikhlin, G. L. Pashkov and E. V. Tomashevich, J. Min. Sci., 1993, 29, 175–181 CrossRef .
  22. M. Fantauzzi, A. Rigoldi, B. Elsener, D. Atzei and A. Rossi, J. Electron Spectrosc. Relat. Phenom., 2014, 193, 6–15 CrossRef CAS PubMed .
  23. C. D. Wagner and J. A. Taylor, J. Electron Spectrosc. Relat. Phenom., 1980, 20, 83–93 CrossRef CAS .
  24. Surface Analysis by Auger and X-ray Photoelectron Spectroscopy, ed. M. P. Seah, D. Briggs and J. T. Grant, IM Publication Surface Science Spectra Limited, 2003, pp. 354–375 Search PubMed .
  25. J. H. Scofield, J. Electron Spectrosc. Relat. Phenom., 1976, 8, 129–137 CrossRef CAS .
  26. R. F. Reilman, A. Msezane and S. T. J. Manson, J. Electron Spectrosc. Relat. Phenom., 1976, 8, 389–394 CrossRef CAS .
  27. A. Parker, C. Klauber, A. Kougianos, H. R. Watling and W. van Vronswijk, Hydrometallurgy, 2003, 71, 265–276 CrossRef CAS .
  28. W. E. Swartz Jr, K. J. Wynne and D. M. Hercules, Anal. Chem., 1971, 43, 1884–1887 CrossRef .
  29. P. A. W. van der Heide, J. Electron Spectrosc. Relat. Phenom., 2006, 151, 79–91 CrossRef CAS PubMed .
  30. C. Ardau, C. Cannas, M. Fantauzzi, A. Rossi and L. Fanfani, Neues Jahrb. Mineral., Abh., 2011, 188, 49–63 CrossRef CAS PubMed .
  31. P. Streubel, R. Franke, T. Chassé, R. Fellenberg, R. Szargan, J. Electron Spectrosc. Relat. Phenom., 1991, 57, 1–13 Search PubMed.
  32. V. Berghof, T. Sommerfeld and L. S. Cederbaum, J. Phys. Chem. A, 1998, 102, 5100–5105 CrossRef CAS .
  33. J. C. M. Silva, H. A. de Abreu and H. A. Duarte, RSC Adv., 2015, 5, 2013–2023 RSC .

Footnote

Electronic supplementary information (ESI) available. See DOI: 10.1039/c5ra14915k

This journal is © The Royal Society of Chemistry 2015
Click here to see how this site uses Cookies. View our privacy policy here.