The effect of the octan-3-yloxy and the octan-2-yloxy chiral moieties on the mesomorphic properties of ferroelectric liquid crystals

Dorota Węgłowska*, Paweł Perkowski, Wiktor Piecek, Mateusz Mrukiewicz and Roman Dąbrowski
Faculty of Advanced Technologies and Chemistry, Military University of Technology, 2 Kaliskiego Str., 00-908 Warsaw 49, Poland. E-mail: dorota.weglowska@wat.edu.pl

Received 27th July 2015 , Accepted 9th September 2015

First published on 9th September 2015


Abstract

New mesogenic compounds exhibiting unique, so called orthoconic, behavior at the synclinic smectic SmC* phase have been obtained. The newly synthesized compounds belong to two chiral homologous series: 4′-[ω-(2,2,3,3,4,4,4-heptafluorobutoxy)alkoxy]biphenyl-4-yl-4-(octan-2-yloxy)benzoates and 4′-[ω-(butoxy)alkoxy]biphenyl-4-yl-4-(octan-3-yloxy)benzoates. Their mesogenic behavior has been studied and their phase transition temperatures as well as enthalpies have been evaluated using polarizing optical microscopy, differential scanning calorimetry and dielectric spectroscopy techniques. The tilt angle, the spontaneous polarisation as well as the helical pitch of the compounds have been studied in the full temperature domain. The compounds with a 4′-ω-(2,2,3,3,4,4,4-heptafluorobutoxy)alkoxy terminal chain exhibit a polar smectic C* phase. The analogous compound with a 4′-ω-(butoxy)alkoxy achiral terminal chain and an octan-2-yloxy chiral part exhibits an Iso-N*-SmC* phase sequence, while the one with an octan-3-yloxy chiral part does not exhibit mesogenic behavior. The compounds with the octan-3-yloxy chiral part have much lower melting points than those with the octan-2-yloxy chiral part. The clearing points of the new compounds decrease with the increase of the length of the oligomethylene spacer chain. Dielectric studies confirmed the presence of SmC* and N* phases. The tilt angles measured in the SmC* phase reveal extremely high values at saturation approaching 45°. The values of the spontaneous polarization for all investigated compounds are as high as 89.5 nC cm−2. The length of the helical pitch for different compounds varies from 460.7 nm to 1367.7 nm.

1 Introduction

Since N. A. Clark and S. T. Lagerwall demonstrated the fast switching electro-optical effects based on surface stabilized ferroelectric liquid crystals (SSFLCs) in 1980 (ref. 1), ferroelectric smectic liquid crystals (FLCs) have been extensively studied.2–9 The main problem with the use of FLCs in photonic applications is the difficulty in obtaining homogenous and permanent structures (resistant to mechanical shock) of the smectic layers inside the liquid crystal cell. The mechanical shock resistance of FLCs can be increased by stabilizing the smectic layer with a polymer network.10

In 1995 Fukuda mentioned for the first time the V-shaped electro-optic response11 exhibiting electro-optical characteristics similar to that observed for nematic liquid crystals, which has potential to become a very promising technology in photonic applications. The electro-optical effect in ferroelectric liquid crystals stabilized by polymer networks (PSV) exhibiting V-shaped switching was developed by the Japanese company Dainippon Ink and Chemicals. FLCs working in the PSV mode exhibit short switching times (100–200 μs (ref. 12)) and high contrast ratios. In addition, they require a low applied voltage (<10 V) and the phase sequence: Iso-N*-SmA*-SmC* (INAC phase sequence). In the PSV effect the length of the helical pitch of the FLC plays no role.

In the deformed helix ferroelectric (DHF) effect13–16,24 the helix axis is parallel to the substrate plane. This electro-optical effect is observed while the helical structure is affected by a weak electric field E (which is less than the critical field EC of the helix unwinding). The critical electric field EC and the switching time τ are given by eqn(1) and (2):

 
image file: c5ra14903g-t1.tif(1)
and
 
image file: c5ra14903g-t2.tif(2)
where: γφ is the rotation viscosity, p is the helical pitch, K is the elastic constant and Ps is the spontaneous polarization.

The electric field value required for the helix deformation and the deviation of the optical axis of the FLC slab in the plane of the measuring cell is low.22

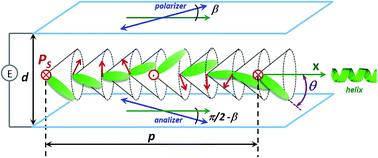
The helical pitch p of the FLC structure within a cell prepared for the observation of the DHF effect is much smaller than the cell gap d (pd), so that the structure can be considered to be free from boundary surface induced distortions.17 In consequence, the helix becomes wound within the cell18 in contrast to the SSFLC effect, where the surface induces unwinding of the helix and it requires the helical pitch of the FLC to be longer than the cell thickness. The director of the ferroelectric liquid crystal structure inside the cell in the DHF mode is arranged in a similar way as in SSFLC effect, but with such a difference that the helix of the FLC is not unwound. The DHF mode has been regarded as very promising for display and photonic applications. When an electric field is applied that is lower than the critical electric EC field between the two substrate plates it couples to the spontaneous polarization in each molecular layer. The helical structure becomes deformed and then fully untwisted for an electric field higher than the critical field EC. The helical pitch for the DHF effect should be preferably short (p < 1 μm) and the tilt angle should be relatively large (θ > 30°).18,19 In the DHF mode, the light transmission T of the cells, placed between crossed polarizers (see Fig. 1) is described by relationship (3):20

 
image file: c5ra14903g-t3.tif(3)
where: β is the angle between the polarizer and the helix axis x of the ferroelectric phase; Δα is the shift of the helical axis due to the electric field; Δneff is an effective birefringence and λ is the wavelength.


image file: c5ra14903g-f1.tif
Fig. 1 A schematic drawing of the DHF mode in a planar cell.

Regardless of the polarity of the driving voltage an electro-optical response is obtained for the geometry with β = 0.21 The maximum light transmission under this condition occurs if:

 
Δα = π/4 (4)
and
 
image file: c5ra14903g-t4.tif(5)
so, the tilt angle θ of the FLC should be close to 45° (π/4) to provide the maximum light transmission at β = 0:20,22
 
Δαθ (6)

The helical configuration in the DHF mode exhibits a wide range of unique optical properties such as circularly polarized Bragg type reflections and a huge optical rotatory dispersion. The switching time in the DHF mode is short, less than 100 μs, at a very low applied voltage (1 V μm−1). The switching curve is a hysteresis-free V-shape and is nearly independent of the frequency of the applied voltage in a broad frequency range (10 Hz to 4 kHz).

The above features make FLCs working in the DHF mode very useful for tunable filters, thermography, electrically tunable optical diodes,23 biosensors,24 voltage sensors,25–28 spatial light modulators,29–32 real-time multi-point measurements, under water sonar array systems33–35 such as fiber optic hydrophone array systems that could be used for underwater acoustic surveillance applications (e.g. military, counter terrorist and customs authorities for protecting ports and harbours) and many other various applications.36

For the above mentioned electro-optic effect ferroelectric liquid crystals having a low melting point, a broad temperature range of SmC* phase, a high tilt angle, high spontaneous polarization and a short helical pitch are especially promising. The assortment of high tilted FLCs is still limited.

There is a strong relationship between the molecular structure of the FLCs and their mesomorphic and electro-optical properties.37,38 Even a small change of the molecular structure influences its properties.39–41 The first family of highly tilted FLCs was described by T. Inukai et al.42 (see I; The black dots confirm the presence of the particular phase):

image file: c5ra14903g-u1.tif

n Cr   SmC*   N*   Iso θ [°]
7 88.2 93.5 120.4 45
8 78.3 98.4 121.1 45
9 79.1 101.0 117.1 45

In compounds I the molecular director is tilted with respect to the smectic layer’s normal at an angle of 45°. They exhibit a phase sequence: Iso-N*-SmC*. With the elongation of the alkoxy chain CnH2n+1O– the stability of the SmC* phase increases and the melting point of the compounds decreases. Compounds I synthesized by Inukai exhibit high melting points, which makes such compounds less useful for photonic applications.

In 2011 C. Liao et al.43 synthesized compounds with a siloxane terminal chain exhibiting much lower melting points (compounds II):

image file: c5ra14903g-u2.tif

m n Cr   SmC*   Iso θ [°] τ [μs]
6 2 1.3 88.9 45 23
11 3 46.9 106.9 44 35

Switching times of such compounds are very short (less than 40 μs), but the applied voltage is high (160 V at the cell gap of 7.5 μm). Such behaviour is ascribed to the presence of the bulky dimethylsiloxane group, which shows less flexibility and a smaller number of conformational states than the alkyl chain compounds.

Continuing our previous studies44,45 we have decided to synthesize two homologous series of new chiral esters with general structures III:

image file: c5ra14903g-u3.tif
where: X = H or F; m = 2–7; either: R1 = CH3 and R2 = C6H13 for (S)-(+)-octan-2-yloxy derivatives or R1 = C2H5 and R2 = C5H11 for (R)-(−)-octan-3-yloxy derivatives.

These compounds are abbreviated as 3XOmCk, where X is the hydrogen or fluorine atom at the achiral terminal chain, m is the length of the oligomethylene spacer between the rigid core and the first alkoxy group of the terminal chain and k is the number of carbon atoms in the R1 group at the chiral terminal chain. Either R1 is a methyl group (k = 1) and R2 is an hexyl-group [obtained from (S)-(+)-octan-2-ol; series nXOmC1] or R1 is an ethyl group (k = 2) and R2 is a pentyl group [obtained from (R)-(−)-octan-3-ol; series nXOmC2].

Temperatures and enthalpies of the phase transitions, tilt angles, spontaneous polarizations as well as the helical pitch in the SmC* phase of homologues described above have been examined.

2 Experimental

2.1 Synthesis

The method of synthesis of the final compounds 3XOmC2 [prepared from (S)-(+)-octan-3-ol] is shown in Scheme 1 and described in a MSc thesis.46 The preparative procedures of the final compounds 3XOmC2 and 3XOmC1 [prepared from (R)-(−)-octan-2-ol] are presented in the ESI. The preparative procedures of the required chiral phenol 8b [(S)-(+)-4′-hydroxybiphenyl-4-yl-4-(octan-2-yloxy)benzoate] has been presented in our earlier papers.44,45 For the chiral functionalization (compound 4a) a Mitsunobu etherification47 has been used. During this reaction the configuration at the chiral carbon atom is inverted. This method was also used to couple the chiral phenol (8a) with an appropriate butoxyalkanol or 2,2,3,3,4,4,4-heptafluorobutoxy alkanol. The method of the synthesis of 2,2,3,3,4,4,4-heptafluorobutoxy alkanols is described by P. Kula et al.48
image file: c5ra14903g-s1.tif
Scheme 1 The synthesis route of compounds 3XOmC2 (prepared from (S)-(+)-octan-3-ol).

The preparative procedures of the final compounds 3XOmCk and their characterization by GC-MS, HPLC-MS and by 1H and 13C NMR spectroscopy are presented in the ESI.

3 Results and discussion

3.1 Mesomorphic properties

Mesophases have been identified conventionally by observing textures using an Olympus polarizing optical microscope (POM) with crossed polarizers and equipped with a Linkam TMSH 600 hot stage and a Linkam TMS 93 temperature controller. Phases have been additionally confirmed on the basis of the results of the dielectric studies. The temperatures and enthalpies of the phase transition have been determined using differential scanning calorimetry with a DSC SETARAM 141 instrument with the scanning rate 2 °C min−1 in both heating and cooling cycles. In Table 1 the temperatures and the enthalpies of the phase transitions of compounds from series 3XOmCk are presented.
Table 1 The phase transition temperatures [°C] (upper row; onset point) and the enthalpies [kJ mol−1] (lower row) of the members of the homologous series 3XOmCk from DSC measurements determined during heating (values given in brackets were determined upon cooling)a
Acr. Cr2   Cr   SmX*   SmC*   N*   Iso
a Acr. stands for acronym.
3FO2C1     96.0     132.4    
27.96 8.62
3FO3C1 43.1 84.3     114.5    
3.91 25.93 6.58
3FO4C1     82.2     135.6    
14.98 8.53
3FO5C1     77.8     123.7    
37.01 7.03
3FO6C1     70.8     129.2    
32.79 8.21
3FO7C1 37.3 74.5     123.1    
8.93 33.13 7.71
3HO3C1     74.3 (55.7) (71.2) 83.1
39.89 −0.71 −3.83 0.77
3FO2C2     87.0     92.6    
24.83 5.40
3FO3C2     73.7     (72.4)    
38.78 −3.75
3FO5C2     49.6     75.6    
27.10 3.32
3FO7C2     36.8     78.0    
16.44 3.55
3HO3C2     40.1            
33.97


Compounds of the fluorinated series 3FOmC1 and 3FOmC2 exhibit the SmC* phase only (with the direct SmC*-Iso transition). The members of the homologous series 3FOmC1 with m = 5, 6 and 7 exhibit very high melting enthalpies (above 32 kJ mol−1). In the case of the protonated analogues the nematic phase above and a more ordered tilted smectic phase below the synclinic SmC* phase have been observed upon cooling in compound 3HO3C1. Similar to the Inukai compounds with the alkyl or alkoxy terminal chain the Iso-N*-SmC* phase sequence has here been observed. The melting points of the compounds of series 3FOmC1 decrease with the increase of the index m in the terminal achiral alkyl chain. An exception is compound 3FO7C1, which exhibits a slightly higher melting point than compound 3FO6C1. Members 3FO3C1, 3FO5C1 and 3FO7C1 exhibit lower clearing points than members 3FO2C1, 3FO4C1 and 3FO6C1, so the characteristic odd-even effect is observed.49 In Fig. 2 the effect of the number of carbon atoms m in the oligomethylene spacer on the melting and clearing points for the compounds 3FOmC1 is presented.


image file: c5ra14903g-f2.tif
Fig. 2 The effect of the number of carbon atoms in the oligomethylene spacer on the melting points (the Cr-SmC* transition) and clearing points (the SmC*-Iso transition) for compounds 3FOmC1.

The fluorinated members of the homologous series 3FOmC2, wherein m = 2, 5 and 7 exhibit the enantiotropic SmC* phase accompanied with the direct SmC*-Iso transition, while the member with m = 3 (compound 3FO3C2) exhibits the monotropic SmC* phase. Their clearing and melting points are much lower. This is a typical behavior observed for compounds with a larger branched chain (an ethyl instead of a methyl group). The melting points of compounds of the series 3FOmC2 decrease with the increase of the length of the oligomethylene spacer (index m). Compound 3FO7C2 exhibits the lowest melting point, only 36.8 °C. For the protonated compound 3HO3C2 (no fluorine atom substituted) no mesophase is observed.

Compounds of the series 3FOmC1 exhibit the focal-conic texture of the SmC* phase, while members of the series 3FOmC2 form strongly defected microscopic patterns of the SmC* phase with small domains, see Fig. 3.


image file: c5ra14903g-f3.tif
Fig. 3 Micrographs of the textures observed during cooling for compounds 3FO6C1: (a) during the Iso-SmC* transition at 129.0 °C, (b) the SmC* phase at 90.2 °C and 3FO5C2: (c) during the Iso-SmC* transition at 75.5 °C and (d) the SmC* phase at 53.7 °C.

3.2 Dielectric measurements

The measurements have been taken using a HP 4192A impedance analyzer and custom-made measuring cells.50 A low-resistivity ITO layer (10 Ω sq−1) were used to avoid the high-frequency losses related to the finite conductivity of the ITO electrodes.51 Short wires of a low-resistivity were used for the connection of the measuring cells to the impedance analyzer. Cells with a thickness of 5 μm covered with polyimide SE130 as a homogeneous aligning layer and anti-parallel rubbed (wherein the glass substrates were rubbed in the opposite directions) were used. Due to the cell gap being small, applying a small value of AC voltage (0.5 V) creates a large electric field E = 100 kV m−1. For this reason measurements were conducted at a low (0.1 V) applied measuring voltage. Such an AC voltage is enough for the electric current response to be easily interpreted by the impedance analyzer. Additionally, such AC voltages create an electric field (E) which is far from the level producing nonlinear effects in liquid crystals. A 0.1 V electric voltage of the AC measuring signal allows us to ignore nonlinearity in the dielectric response. During measurements no bias (DC) voltage was applied. Measuring frequencies varied from 100 Hz up to 10 MHz. The temperature of the measuring cells was controlled using a computer driven Linkam TMS 92 unit and a hot stage Linkam THMSE 600 at an accuracy of 0.1 °C. During measurements cells were slowly cooled at a rate of 0.3 °C min−1.

In Fig. 4 the real part ε′ of the electric permittivity at six frequencies (0.1, 1, 10, 100 kHz, 1 MHz and 10 MHz) versus the temperature for compound 3FO5C2, chosen as a typical member of the fluorinated series, is shown. At frequencies below 1 kHz a strong dispersion is observed. This dispersion is typical for the SmC* phase. It falls with the increase of the frequency. The observed mode can be interpreted as a Goldstone mode.52 The Goldstone mode is a collective relaxation, which is related with the procession of tilted molecules around the helical axis observed in the ferroelectric SmC* phase. It is the strongest mode observed in liquid crystals built from rod-like molecules. It is not an Arrhenius-type relaxation. The relaxation frequency of the Goldstone mode varies usually from 100 Hz to 10 kHz. Using our calculation procedure53,54 the parameters of the Goldstone mode for four temperatures were calculated. The results are shown in Table 2. The dielectric strength δε for compound 3FO5C2 decreases with the temperature decrease. The same effect is observed for the relaxation frequency of the Goldstone mode. Due to the fact that in the investigated compound a direct nucleation of clusters in the SmC* phase was observed at the temperature of the phase transition from the isotropic liquid one cannot observe the soft mode.52 One can see that the dielectric spectroscopy results confirm the phase sequences observed from the differential scanning calorimetry (DSC) measurements. Transitions observed during the cooling cycle for compound 3FO5C2 are as follows: Iso 77.5 °C SmC* 31.5 °C Cr. The plot for the frequency of 10 MHz is influenced by cell properties53,54 due to resistivity of the ITO electrodes. This means that the ε′ values presented for 10 MHz are slightly underestimated.


image file: c5ra14903g-f4.tif
Fig. 4 The real part ε′ of the electric permittivity as a function of temperature (T) for compound 3FO5C2 measured during cooling for 100 Hz, 1, 10, 100 kHz, 1 MHz and 10 MHz. Arrows indicate the phase transitions.
Table 2 The parameters of the Goldstone mode (dielectric strength δε, and the relaxation frequency fR) for compounds 3FO5C2 and 3HO3C1
Acronym Parameter 70 °C 60 °C 50 °C 40 °C
3FO5C2 δε 52.2 44.2 40.6 28.5
fR 420 kHz 340 kHz 220 kHz 150 kHz
3HO3C1 δε 12.4 11.2    
fR 2900 kHz 2020 kHz    


In Fig. 5 the real part ε′ of the electric permittivity at six frequencies (0.1, 1, 10, 100 kHz, 1 MHz and 10 MHz) versus the temperature for compound 3HO3C1 is shown. The plot for 10 MHz is influenced by the properties of the measuring cell (cut-off frequency of the measuring cell), as it is for the measurements of 3FO5C2. The observed dielectric spectrum confirms all phases observed using the DSC method. The phase transition temperatures determined using dielectric spectroscopy differ a little in comparison with the DSC results: Iso 84.5 °C N* 72.5 °C SmC* 55 °C SmX 48.5 °C Cr. In addition, a more ordered smectic phase (SmX) with hindered dispersion below the SmC* phase is observed. The well defined Goldstone mode is observed too, while the soft mode is not observed in the dielectric response of 3HO3C1, due to the absence of the SmA* phase. The parameters of the Goldstone mode for two values of the temperature: 70 and 60 °C were calculated. The results of these calculations are presented in Table 2.


image file: c5ra14903g-f5.tif
Fig. 5 The real part ε′ of the dielectric permittivity as a function of temperature for compound 3HO3C1 measured during cooling for 100 Hz, 1, 10, 100 kHz, 1 MHz and 10 MHz. Arrows indicate the phase transitions.

The dielectric strength δε exhibited by compound 3HO3C1 is four times smaller than in the case of compound 3FO5C2 (at the same value of temperature). It means that fluorine atoms can support a stronger dielectric response of the Goldstone mode. The relaxation frequency of the Goldstone mode of compound 3HO3C1 is higher than in the case of compound 3FO5C2, because the 3FO5C2 molecule is much larger and heavier than the 3HO3C1 molecule. Longer and larger objects show lower relaxation frequencies than shorter and lighter ones.

In the case of compound 3FO5C2 in the isotropic phase, near to the Iso-SmC* transition, a weak dispersion is observed at high frequencies. It is worth noting that this can be interpreted as the dielectric response of the molecular rotation around a short molecular axis (S-mode).55 This S-mode is strongly temperature dependent. In the SmC* phase the S-mode is hindered. Such a mode should be easily detectable both in the isotropic and in the nematic phases, but the molecules of compound 3HO3C1 are too light in comparison with the molecules of compound 3FO5C2 and hence the relaxation frequency of the S-mode in compound 3HO3C1 is much higher than in compound 3FO5C2 and cannot be observed using our experimental setup (limited frequency measuring range).

3.3 Tilt angle measurements

The tilt angle was studied using the standard method56 with custom made cells with a bookshelf-like structure of the liquid crystal in the SmC* phase. Cells with a thickness of 1.5 μm with ITO electrodes were coated with polyamide nylon 6.6 to obtain a homogeneous alignment layer. Aligning layers were deposited from a 0.5% solution of the dry mass in 3-fluoroethanol by spinning. After the drying and baking processes cell substrates with polyamide orienting layers were rubbed unidirectionally and assembled using a rod-like spacer in the sealing frame only. Cells were filled with the compound to be investigated using capillary action at a temperature elevated enough to keep the material under study in the isotropic phase. A homogenous texture with the planar alignment of the director at the smectic layers was obtained upon slow (0.01 °C min−1) cooling. The tilt angle θ in the temperature domain was observed during the cooling cycle in the presence of an electric field (E = 2.8 V μm−1; f = 15 Hz) of magnitude enough to saturate the switching angle. The transmitted light intensity on the angle between the direction of the smectic layer normal and the orientation of the polarizer for both electric field polarizations was observed. The tilt angle was obtained as half of the angle between the two minima of the light transmissions for both of the polarizations of the electric field applied.

In Fig. 6 the values of the tilt angles θ as a function of temperature for compounds 3FO6C1, 3FO7C2 and 3HO3C1 measured in the SmC* phase are presented. A maximum optical tilt angle of 44.9° was observed at 106 °C for compound 3FO6C1, 45.0° at 40 °C for compound 3FO7C2 and 42.9° at 61 °C for compound 3HO3C1. The values of the tilt angle in all the investigated compounds depend on the temperature slightly at the same distance from the Iso-SmC* transition and increase with the temperature decrease.


image file: c5ra14903g-f6.tif
Fig. 6 The tilt angle θ as a function of temperature for compounds 3FO6C1, 3FO7C2 and 3HO3C1 measured during cooling.

3.4 Spontaneous polarization measurements

The values of the spontaneous polarization (PS) were studied using the reverse current method57,58 with a triangle pulse of the AC electric field. Cells with a cell gap of 3.0 μm were prepared in a similar way as for the tilt angle measurements. The samples were slowly (0.1 °C min−1) cooled from the isotropic phase in the presence of an electric field (E = 2.8V μm−1; f = 15 Hz). Values of the PS were obtained from the integration of the polarization reversal current peaks registered in response to the application of the triangular shaped voltage pulse.

In Fig. 7 the results of the polarization measurements at different temperatures for the SmC* phase for compounds 3FO6C1, 3FO7C2 and 3HO3C1 are shown. The values of the spontaneous polarization for the investigated compounds are relatively high: 89.5 nC cm−2 at 101 °C for compound 3FO6C1, 91.4 nC cm−2 at 40 °C for compound 3FO7C2 and 103.1 nC cm−2 at 59 °C for compound 3HO3C1. The values of the spontaneous polarization for all investigated compounds increase with the temperature decrease. The compound with a butoxypropoxy achiral chain (3HO3C1) has the highest value of spontaneous polarization. The same relation was observed in the recently investigated benzoates with alkanoyloxyalkoxy and perfluoroalkanoyloxyalkoxy achiral chains.43,44 For 4-octyl-2-oxycarbonylobiphenylyl-4-yl-4-(alkanoyloxy-alkoxy) benzoates and perfluoroalkanoyloxyalkoxy benzoates the opposite relation was observed. The fluorinated compounds exhibit higher PS values.


image file: c5ra14903g-f7.tif
Fig. 7 Spontaneous polarization PS as a function of temperature for compounds 3FO6C1, 3FO7C2 and 3HO3C1 measured during cooling.

3.5 Helical pitch measurements

The helical pitch measurements were carried out based on the selective light reflection phenomenon.59,60 The wavelength of selectively reflected light was calculated by the observation of the minimum of the light transmission measured using a UV-VIS-NIR 3600 Shimadzu spectrophotometer in the range of 360–3000 nm during the cooling cycle. Cells were cooled from the isotropic phase and the temperature was controlled using the Linkam S-1700 temperature controller. The maximum of the selective reflection of the light in the SmC* phase for compounds 3FO3C1, 3FO6C1, 3HO3C1, 3FO3C2, 3FO5C2 and 3FO7C2 was measured. The helical pitch in the measured compounds was calculated using the equation: λmax = ňp, where λmax is the length of the selectively reflected light and ň is the average refractive index (for the investigated compound ň is about 1.5 (ref. 61)). The glass plate, covered by a thin layer of the investigated compound, was placed into the spectrophotometer in the way of the light ray at the side. The selective reflection was registered every 1 °C. The calculated lengths of the helical pitches for the measured compounds are shown in Fig. 8.
image file: c5ra14903g-f8.tif
Fig. 8 The length of the helical pitch vs. temperature calculated for compounds 3FO3C1, 3FO6C1, 3HO3C1, 3FO3C2, 3FO5C2 and 3FO7C2 in the SmC* phase measured during cooling.

The length of the helical pitch in compounds 3FO3C1 and 3FO6C1 in the SmC* phase decreases with the temperature decrease from 510.7 nm at 107 °C to 460.7 nm at 71 °C and from 1009 nm at 105 °C to 927 nm at 70 °C respectively. For compounds 3HO3C1, 3FO3C2, 3FO5C2 and 3FO7C2 the length of the helical pitch decreases with the temperature increase: from 1024.7 nm at 74 °C to 840 nm at 77 °C, from 693.3 nm at 71 °C to 720 nm at 65 °C, from 1096.7 nm at 44 °C to 902 nm at 71 °C and from 1367.7 nm at 35 °C to 938 nm at 80 °C respectively. For compound 3HO3C1 the wavelength of the selective reflection in the SmC* phase below 74 °C is out of the range of the spectrometer. The helical pitch p depends on the length of the oligomethylene spacer and decreases with the decrease of the index m.

4 Discussion and conclusions

The prepared compounds with the fluorinated 2,2,3,3,4,4,4-heptafluorobutoxy unit in the achiral chain of both homologous series 3FOmC1 and 3FOmC2 exhibit the Cr-SmC*-Iso phase sequence and their clearing points decrease with the increase of the m index in the oligomethylene spacer of the terminal achiral chain. The compound with the butoxypropoxy chain 3HOmC1 exhibits the Cr-SmC*-N*-Iso phase sequence, similar to the alkoxy compounds obtained by Inukai, while compound 3HO3C2 with the longer branch at the chiral centre has no mesophase. Compound 3FO7C2 exhibits the widest temperature range of the synclinic, high tilted SmC* phase. The members of the homologous series 3FOmC2, having an octan-3-yloxy chiral moiety, exhibit much lower melting points than compounds of the series 3FOmC1, having an octan-2-yloxy chiral moiety. Changing the chiral part from oct-2-yloxy- to oct-3-yloxy- decreases the melting as well as clearing points significantly. Replacing the partially fluorinated butoxy unit in the terminal achiral chain in compounds 3FOmCk by a butoxy unit (compounds 3HOmCk) destabilizes the SmC* phase. The comparison of the temperature range of the mesophases of both series 3XOmC1 and 3XOmC2 is presented in Fig. 9. For compounds 3HO3C1 and 3FO3C2 the temperature range of the phase only during cooling are given.
image file: c5ra14903g-f9.tif
Fig. 9 The comparison of the temperature ranges of phases in both series 3XOmC1 and 3XOmC2.

The Goldstone mode is detected in the ferroelectric SmC* phases. Fluorinated compounds have a higher dielectric strength (δε) of the Goldstone mode than the protonated ones and the relaxation frequency (fR) of the Goldstone mode is lower for fluorinated compounds than for the protonated ones. The observed maximum optical tilt angle for fluorinated compounds is high: 44.9° for compound 3FO6C1 and 45.0° for compound 3FO6C1. The observed maximum optical tilt angle for protonated compound 3HO3C1 is a little bit lower, and is about 42.9°. The values of the spontaneous polarization for all investigated compounds is relatively high, above 89.5 nC cm−2. The length of the helical pitch decreases with the decrease of the m index and is the shortest for compound 3FO3C1 (460.7 nm at 71 °C).

An analogous series with an ester group in the terminal achiral chain44,45 (marked as 3XOOmC1, see Fig. 10 and 11) exhibits similar or slightly lower melting points and a similar phase sequence: Cr-SmC*-Iso. Compounds 3HO3C1 and 3HOO3C1 also show a similar phase sequence. The fluorinated compounds with an ester group in the achiral chain (nFOOmC1) exhibit a low-tilted SmC* phase (the tilt angle value below 20°), while fluorinated compounds 3FOmC1 have a very high tilt angle: 45°. The tilt angle of protonated compounds (nHOOmC1) is quite high, for example: 40.3° at 60 °C for compound 3HOO3C1, but lower than for compound 3HO3C1 (42.9° at 61 °C). Both protonated families of compounds (3HO3C1 and 3HOO3C1) have an additional N* phase and a more ordered chiral smectic phase below the SmC* phase. The replacement of the partially fluorinated terminal butoxy unit by the butoxy unit in the achiral terminal chain led to the decrease of the stability of the SmC* phase, similar to that observed for many other liquid crystals. The length of the helical pitch in compounds nFOOmC1 is similar to that in compounds 3FOmC1. The length of the helical pitch in compounds nHOOmC1 is shorter than in compounds 3HOmC1.


image file: c5ra14903g-f10.tif
Fig. 10 The structures of the series 3XOmC1 and 3XOOmC1; X = F or H.

image file: c5ra14903g-f11.tif
Fig. 11 The comparison of the temperature ranges of phase sequences for both series 3XOmC1 and 3XOOmC1.

Acknowledgements

This work has been supported by the Polish Ministry of Science and Higher Education, grant RMN No. 974/2014 and POIG.01.03.01-14-016/08. We are thankful to Mr Edwin Myka for his help in the preparation of compounds 3FOmC2.

References

  1. N. A. Clark and S. T. Lagerwall, Appl. Phys. Lett., 1980, 36, 899–901 CrossRef CAS.
  2. A. D. L. Chandani, A. Fukuda, S. Kumar and J. Vij, Liq. Cryst., 2011, 38, 663–668 CrossRef CAS.
  3. A. Bubnov, V. Novotná, D. Pociecha, V. Hamplová and M. Kašpar, Phase Transitions, 2012, 85, 849–860 CrossRef CAS.
  4. M. Koden, Ferroelectrics, 1996, 179, 121–129 CrossRef CAS.
  5. V. Novotná, V. Hamplová, M. Kašpar, N. Podoliak, A. Bubnov, M. Glogarová, D. Nonnenmacher and F. Giesselmann, Liq. Cryst., 2011, 38, 649–655 CrossRef.
  6. P. Malik, K. K. Raina, A. Bubnov, A. Chaudhary and R. Singh, Thin Solid Films, 2010, 519, 1052–1055 CrossRef CAS.
  7. M. Garić, A. Bubnov, V. Novotná, M. Kašpar, V. Hamplová, D. Ž. Obadović and M. Glogarová, Liq. Cryst., 2005, 32, 565–572 CrossRef.
  8. M. Stojanović, A. Bubnov, D. Ž. Obadović, V. Hamplová, M. Kašpar and M. Cvetinov, Phase Transitions, 2011, 84, 380–390 CrossRef.
  9. K. Kurp, M. Czerwiński and M. Tykarska, Liq. Cryst., 2015, 42, 248–254 CrossRef CAS.
  10. S. Kawamoto, M. Oh-kochi, S. Kundu, H. Hasebe, H. Takatsu and S. Kobayashi, Displays, 2004, 25, 45 CrossRef CAS.
  11. A. Fukuda, Proc. Asia Display, Hamamatsu, 1995, 95, p. 61 Search PubMed.
  12. T. Fujisawa, M. Hayashi, H. Hasebe, K. Takeuchi, H. Takatsu and S. Kobayashi, DIC Tech. Rev., 2007, 13, 1–5 Search PubMed.
  13. E. Pozhidaev and V. Chigrinov, SID’10 Conference, 27-2, Seattle, Washington, USA, May, 2010 Search PubMed.
  14. A. Jakli, L. Bata and L. A. Bersnev, Mol. Cryst. Liq. Cryst., 1989, 177, 43–57 CrossRef CAS.
  15. A. G. H. Verhulst, G. Cnossen, J. Fünfschilling and M. Schadt, J. Soc. Inf. Disp., 1995, 3, 133–138 CrossRef.
  16. J. Fünfschilling and M. Schadt, Jpn. J. Appl. Phys., 1996, 35, 5765–5774 CrossRef.
  17. I. Abdulhalim, Appl. Phys. Lett., 2012, 101, 141903 CrossRef.
  18. A. D. Kiselev and V. G. Chigrinov, Phys. Rev. E, 2014, 90, 042504 CrossRef PubMed.
  19. A. D. Kiselev, E. Pozhidaev, V. G. Chigrinov and H. S. Kwok, Photonics Lett. Pol., 2011, 3, 29–31 CAS.
  20. V. G. Chigrinov, Liquid Crystal Devices: Physics and Applications, Artech-House, Boston- London, 1999, p. 357 Search PubMed.
  21. E. Pozhidaev and V. G. Chigrinov, SID, 2010, 41, 387–390 CrossRef.
  22. L. A. Baresnev, V. Chigrinov, D. I. Dergachev, E. P. Poshidaev, J. Fünfshilling and M. Schadt, Liq. Cryst., 1989, 5, 1171–1177 CrossRef.
  23. I. Abdulhalim, Appl. Phys. Lett., 2012, 101, 141903 CrossRef.
  24. S. J. Woltman, G. D. Jay and G. P. Crawford, Nat. Mater., 2007, 6, 929–938 CrossRef CAS PubMed.
  25. F. Anagni, C. Bartoletti, U. Marchetti, L. Podesta and G. Sacerdoti, IEEE Trans. Instrum. Meas., 1994, 43, 475–480 CrossRef.
  26. T. Woliński, A. Czapla, S. Ertman, M. Tefelska, A. Domański, J. Wójcik, E. Nowinowski-Kruszelnicki and R. Dąbrowski, IEEE T Instrum Meas., 2008, 57, 1796–1802 CrossRef.
  27. Z. Brodzeli, L. Silvestri, A. Michie, Q. Guo, E. P. Pozhidaev, V. Chigrinov and F. Ladouceur, J. Lightwave Technol., 2013, 31, 2940–2946 CrossRef.
  28. Z. Brodzeli, L. Silvestri, A. Michie, Q. Guo, E. P. Pozhidaev, V. Chigrinov and F. Ladouceur, Liq. Cryst., 2013, 40, 1427–1435 CrossRef CAS.
  29. C. C. Mao, D. J. McKnight and K. M. Johnson, Opt. Lett., 1995, 20, 342–344 CrossRef CAS PubMed.
  30. G. B. Cohen, R. Pogreb, K. Vinokur and D. Davidov, Appl. Opt., 1997, 36, 455–459 CrossRef CAS PubMed.
  31. D. V. Wick, T. Martinez, M. V. Wood, J. M. Wilkes, M. T. Gruneisen, V. A. Berenberg, M. V. Vasil’ev, A. P. Onokhov and L. A. Beresnev, Appl. Opt., 1999, 38, 3798–3803 CrossRef CAS PubMed.
  32. J. G. Cuennet, E. A. Vasdekis, L. de Sio and D. Psaltis, Nat. Photonics, 2011, 5, 234–238 CrossRef CAS.
  33. Y. V. Izdebskaya, V. G. Shvedov, A. S. Desyatnikov, W. Krolikowski and Y. S. Kivshar, Opt. Lett., 2010, 35, 1692–1694 CrossRef PubMed.
  34. Z. Ge, S. Gauza, M. Jiao, H. Xianyu and S. T. Wu, Appl. Phys. Lett., 2009, 94, 101104–101113 CrossRef.
  35. Z. Brodzeli, F. Ladouceur, L. Silvestri, A. Michie, V. Chigrinov, Q. Guo, E. P. Pozhidaev and A. D. Kiselev, Third Asia Pacific Optical Sensors Conference, 2012, p. 83512 Search PubMed.
  36. Z. Brodzeli, L. Silvestri, A. Michie, V. Chigrinov, Q. Guo, E. P. Pozhidaev, A. D. Kiselev and F. Ladouceur, Photonic Sens., 2012, 2, 237246 Search PubMed.
  37. A. Nafees, G. Kalita, M. K. Paul, A. Sinha and N. V. S. Rao, RSC Adv., 2015, 5, 7001–7006 RSC.
  38. S. Ghosh, N. Begum, S. Turlapati, S. K. Roy, A. K. Das and N. V. S. Rao, J. Mater. Chem. C, 2014, 2, 425–431 RSC.
  39. M. Hird, Liq. Cryst., 2011, 38, 1467–1493 CrossRef CAS.
  40. P. Kula, J. Herman and O. Chojnowska, Liq. Cryst., 2013, 40, 83–90 CrossRef CAS.
  41. M. Czerwiński, M. Tykarska, R. Dąbrowski, A. Chełstowska, M. Żurowska, R. Kowerdziej and L. R. Jaroszewicz, Liq. Cryst., 2012, 39, 1498–1502 CrossRef.
  42. T. Inukai, S. Saitoh, H. Inoue, K. Miyzawa, K. Terashima and K. Furukawa, Mol. Cryst. Liq. Cryst., 1986, 141, 251–266 CrossRef CAS.
  43. C. T. Liao, J. Y. Lee and C. C. Lai, Mol. Cryst. Liq. Cryst., 2011, 534, 95–113 CrossRef CAS.
  44. D. Ziobro, R. Dąbrowski, M. Tykarska, W. Drzewiński, M. Filipowicz, W. Rejmer, K. Kuśmierek, P. Morawiak and W. Piecek, Liq. Cryst., 2012, 39, 1011–1032 CrossRef CAS.
  45. D. Węgłowska and R. Dąbrowski, Liq. Cryst., 2014, 41, 1116–1129 CrossRef.
  46. E. Myka, M. Sc. Thesis. Military University of Technology, 2015 Search PubMed.
  47. O. Mitsunobu and M. Yamada, Bull. Chem. Soc. Jpn., 1967, 40, 2380–2382 CrossRef CAS.
  48. P. Kula, A. Spadło, M. Żurowska and R. Dąbrowski, Synlett, 2010, 9, 1394–1396 CrossRef.
  49. D. Demus, J. W. Goodby, G. W. Gray, H. W. Spiess and V. Vill, Handbook of liquid crystals. Low molecular weight liquid crystals I. Vol. 2A, Wiley-VCH, Weinheim, 1998, p. 530 Search PubMed.
  50. M. Mrukiewicz, P. Perkowski and K. Garbat, Liq. Cryst., 2015, 42, 1036–1042 CrossRef CAS.
  51. P. Perkowski, Opto-Electron. Rev., 2009, 17, 180–186 CAS.
  52. S. T. Lagerwall, Ferroelectric and Antiferroelectric Liquid Crystals, Wiley-Vch, Weinheim 1999 Search PubMed.
  53. P. Perkowski, Opto-Electron. Rev., 2009, 17, 180–186 CAS.
  54. P. Perkowski, Opto-Electron. Rev., 2011, 19, 176–182 Search PubMed.
  55. M. Mrukiewicz, P. Perkowski, K. Garbat and R. Dąbrowski, Liq. Cryst., 2014, 41, 1537–1544 CrossRef CAS.
  56. W. Piecek, Z. Raszewski, P. Perkowski, J. Kędzierski, J. Rutkowska, E. Nowinowski-Kruszelnicki, J. Zielinski, R. Dąbrowski and X. W. Sun, Mol. Cryst. Liq. Cryst., 2007, 477, 205–221 CrossRef CAS.
  57. J. Gąsowska, R. Dąbrowski, W. Drzewiński, M. Filipowicz, J. Przedmojski and K. Kenig, Ferroelectrics, 2004, 309, 83–93 CrossRef.
  58. R. Dąbrowski, J. Gąsowska, J. Oton, W. Piecek, J. Przedmojski and M. Tykarska, Displays, 2004, 25, 9–19 CrossRef.
  59. M. Tykarska, M. Czerwiński and J. Miszkurka, Liq. Cryst., 2010, 37, 487–495 CrossRef CAS.
  60. A. Chełstowska, M. Czerwiński, M. Tykarska and N. Bennis, Liq. Cryst., 2014, 41, 812–820 CrossRef.
  61. Z. Raszewski, J. Kędzierski, P. Perkowski, W. Piecek, J. Rutkowska, S. Kłosowicz and J. Zieliński, Ferroelectrics, 2002, 276, 289–290 CrossRef CAS.

Footnote

Electronic supplementary information (ESI) available. See DOI: 10.1039/c5ra14903g

This journal is © The Royal Society of Chemistry 2015
Click here to see how this site uses Cookies. View our privacy policy here.