Adsorption of nucleobases on 2D transition-metal dichalcogenides and graphene sheet: a first principles density functional theory study†
Hakkim Vovushaab and
Biplab Sanyal*a
aDepartment of Physics and Astronomy, Uppsala University, Box-516, 751 20, Uppsala, Sweden. E-mail: biplab.sanyal@physics.uu.se
bDepartment of Cell and Molecular Biology, Uppsala University, Box-596, BMC, 751 24, Uppsala, Sweden
First published on 30th July 2015
Abstract
Adsorption characteristics of DNA/RNA nucleobases on monolayers of transition-metal dichalcogenide (TMD) such as molybdenum disulfide (MoS2) and tungsten disulfide (WS2) have been studied using first principles density functional theory (DFT) with vdW-DF method. The same calculations have been performed with PBE and DFT-D2 method for comparison. In addition, a comparative study has been done for adsorption with graphene (GRA) also to compare with MoS2 and WS2. We have found that all nucleobases are physisorbed on MoS2 and WS2 due to van der Waals interaction, which is similar to that of nucleobases on GRA. The order of binding energy of the nucleobases with MoS2 and WS2 is G > A > T > C > U using vdW-DF and DFT-D2 method, which is also similar to that of GRA–nucleobases. Without the inclusion of vdW interaction (PBE only), the order of the binding energies is calculated to be G > C > A > T > U for MoS2 and WS2–nucleobase complexes and G > C > A![[double bond, length as m-dash]](https://www.rsc.org/images/entities/char_e001.gif) T > U for GRA. We have analyzed changes in the electronic structures due to adsorption and the consequences in the calculated optical absorption spectra. Moreover, we have found that the calculated work functions of MoS2, WS2 and GRA decrease after the adsorption of nucleobases. Our results demonstrate that apart from graphene, transition metal dichalcogenides may also be used to detect biomolecules for medical science and biotechnology.
T > U for GRA. We have analyzed changes in the electronic structures due to adsorption and the consequences in the calculated optical absorption spectra. Moreover, we have found that the calculated work functions of MoS2, WS2 and GRA decrease after the adsorption of nucleobases. Our results demonstrate that apart from graphene, transition metal dichalcogenides may also be used to detect biomolecules for medical science and biotechnology.
Introduction
The role of DNA is vital in life science and its detection is very important in the field of genomics, diagnosis of disease and forensic sciences.1 Using nanomaterials such as carbon nanotubes (CNT's), quantum dots (QD's)2,3 and graphene oxide (GO),4–6 DNA molecules have been sensed based on calorimetric7,8 and fluorescent assays.4,9 The important advantage of using 2D materials in the sensing of molecules is due to the high surface-to-volume ratio.10 For example, 2D sheets of graphene (GRA),11–15 graphene oxide (GO)16,17 and hexagonal boron nitride (h-BN)18,19 are used to sense the gas molecule and biomolecules. Transition metal dichalcogenides (TMD) constitute a class of two dimensional (2D) materials with intrinsic band gaps of 1–2 eV used for various applications.20 Molybdenum disulfide (MoS2) is one of the well known metal dichalcogenides used in nanoelectronics, optoelectronics, energy harvesting and catalysis processes.21–25 2D MoS2 is a layered semiconducting material with a hexagonal arrangement of Mo atoms in the middle layer and S atoms on the surface. Mo atoms are located in between the surface S atoms. Mo and S atoms are bonded covalently with a typical distance of about 2.40 Å with S–Mo–S angle of 80.6°.26 2D MoS2 and WS2 are being studied extensively as some of their properties are similar to GRA.27–31 Pachter and coworkers have studied chemical sensing of MoS2 with planar and non-planar molecules using DFT.32 Using first principles calculations, Yue et al. have demonstrated that the adsorption of gas molecules such as H2, O2, NH3 and NO on MoS2 surfaces increases in the presence of external electric field.33 Experimental studies on chemical vapor sensing of laboratory solvents, such as dichlorobenzene, dichloropentane, nitromethane, nitrotoluene with MoS2 are available in the literature.34Tungsten disulfide (WS2) is used in solid lubricants, catalysis and tips in the scanning microscopy. WS2 nano sheets have been used as nanoquenchers for DNA detection.,35–37 e.g., by fluorescence quenching method.37 Electronic and mechanical properties of WS2 have been studied theoretically by several groups.38–40 Amin et al. have studied the effect of strain on WS2, WSe2 and WTe2, where it was found that the direct band gaps change to indirect ones due to the application of compressive strain.38 Wei et al. have studied the effect of defects on the optical properties of WS2 and found that the presence of defect increases the intensity of absorption.40
Although the application of MoS2 and WS2 is explored in electronics, catalysis and vapor molecule detection, the study of sensing of biomolecules can hardly be found in literature. Even though, graphene and its analogues have been used for this purpose, alternative 2D materials should be sought because of the poor ON/OFF current ratio in graphene.40–43 It has been demonstrated that a monolayer of MoS2 exhibits a better ON/OFF current ratio21 than graphene and hence, can potentially be used for sensing. Recently, Zhu et al. have studied the homogeneous detection of DNA with MoS2 based fluorogenic nanoprobes.44 Density functional theory and molecular dynamics study by Farimani et al. showed that the DNA sequencing ability of nanopore and nanoribbon–MoS2 with four different nucleobases is better than that of graphene.45
Understanding of organic molecules and biomolecular interaction with nanosurfaces is important for designing of better sensors with the selectivity. Numerous theoretical studies have been carried out to understand the interaction of DNA/RNA nucleobases, e.g., adenine (A), cytosine (C), guanine (G), thymine (T) and uracil (U) with 2D surfaces of GRA, GO, h-BN11–19 for sensing of biomolecules. Also, monolayer GRA and h-BN for Li-ion battery electrode materials have been studied.46,47
To gain insights on the absorption characteristics of nucleobases on 2D surfaces, the objective of the present investigation is to study the.
1. Geometries and energetics of MoS2 and WS2–nucleobase complexes.
2. Modifications of the electronic structures.
3. Signatures of adsorption in the optical adsorption spectra of the complexes.
4. Changes in the work function of pristine MoS2, WS2, GRA and its complexes with nucleobases.
5. Comparison of the properties with complexes of nucleobases with 2D graphene (GRA).
Computational methods
DFT calculations were performed using Vienna ab initio simulation package (VASP)48,49 in a plane wave basis with the electron–ion interactions described by projector augmented wave method. We have used non-local van der Waals density functional (vdW-DF)50,51 to describe the interactions between nucleobases and 2D substrates. The exchange–correlation functional in vdW-DF has three terms: exchange energy from GGA, local correlated energy from LDA and nonlocal correlation energy, which approximates vdW interaction. Calculations were performed with 6 × 6 lateral supercells of MoS2, WS2 (108 atoms) and GRA (72 atoms). To minimize the interaction between the supercell images, a 20 Å spacing was used in the direction perpendicular to the substrate. Brillouin zone integrations were performed with a 5 × 5 × 1 Monkhorst–Pack k-point mesh to calculate total energies and densities of states. The Hellman Feynman forces on each atom were allowed to converge to 10 meV Å−1 with a plane wave cutoff of 400 eV. Binding energies of the nucleobases with substrates (MoS2 or WS2 or GRA) were calculated using the equation:| EBE = ESub+Nuc − (ESub + ENuc), |
To study the optical properties of pure substrates and substrate–nucleobase complexes, frequency dependent dielectric functions were computed. The imaginary part of the dielectric function was calculated by the following equation:
The work functions of the 2D substrates before and after adsorption have been calculated using the following equation:
| ϕ = V(ϕ) − Ef |
Results and discussion
We have placed nucleobases on different adsorption sites of MoS2, WS2 and GRA as the starting geometries for the calculation. The center of each nucleobase was placed on top of hexagon (A site), M (Mo or W) (B site) and S (C site) of MoS2 and WS2. For GRA, the center of the nucleobases was placed on top of hexagon (A site), C (B site) and C–C (C site) bonds. All of these starting configurations were relaxed using vdW-DF method and the minimum energy configuration for each system has been taken for further calculations. The total energies of all configurations are listed in Table S1.† The optimized M (Mo or W)–S bond lengths are obtained as 2.40 Å and 2.43 Å for MoS2 and WS2 whereas S–M–S angles are calculated to be 81.9° and 81.7° for MoS2 and WS2 respectively. Our calculated geometries for MoS2 and WS2 match very well with earlier studies.52,53 Similarly for GRA, the optimized C–C distance is 1.42 Å, which is in good agreement with previous reports.54Adsorption of nucleobases on MoS2 and WS2 surfaces
In this section the structure and energetics of MoS2–nucleobase and WS2–nucleobase will be discussed.Force minimized structures of MoS2–nucleobase and WS2–nucleobase complexes are shown in Fig. 1 and 2 respectively. For each system, the minimum energy configuration has been chosen among the various possibilities (Table S1†). The optimized structures for GRA–nucleobases are presented in the ESI (Fig. S1†). The calculated vertical distances between nucleobases and MoS2, WS2 and GRA are presented in Table 1.
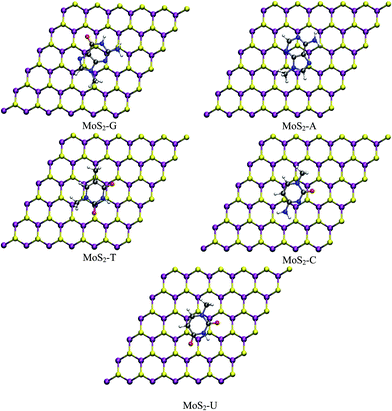 | ||
| Fig. 1 Optimized structures of nucleobases adsorbed on monolayer MoS2 (purple: Mo, yellow: S, red: O, blue: N, gray: C and white: H). | ||
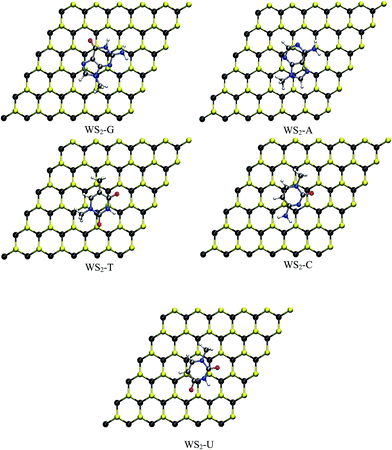 | ||
| Fig. 2 Optimized structures of nucleobases adsorbed on monolayer WS2 (purple: Mo, yellow: S, red: O, blue: N, gray: C and white: H). | ||
| Vertical distance (in Å) | |||
|---|---|---|---|
| MoS2 | WS2 | G | |
| G | 3.55 | 3.61 | 3.56 |
| A | 3.53 | 3.59 | 3.55 |
| T | 3.64 | 3.59 | 3.58 |
| C | 3.52 | 3.53 | 3.55 |
| U | 3.60 | 3.54 | 3.54 |
The calculated vertical separations between MoS2, WS2 and GRA and nucleobases are in the ranges 3.52–3.64 Å, 3.53–3.61 Å and 3.54–3.58 Å respectively. Our calculated distances for GRA–nucleobase complexes are in good agreement with a previous report.14 From Table 1, it is clear that the difference in the vertical distances for these three substrates is very small. Similar results have been obtained for MoS2–heterocyclic composites with a vertical distance of about 3.50 Å.37 The presence of hetero atoms like N and O tilts the molecules slightly on MoS2 and WS2 whereas the molecules have a parallel orientation on GRA. The orientation and position of the nucleobases on the GRA surface agree quite well with an earlier study.14 The nucleobases are parallel to GRA due to π–π interactions. In TMD, in addition to the hetero atoms, the hydrogen atoms in the tail (–NH2 and –CH3 group) part of nucleobase interacts with MoS2 and WS2 surfaces. In TMD–A complex, the H atom of CH3 group in adenine is in close contact with S atom of the surface with a typical distance of about 3.20 Å and for TMD–C, H of methyl group and O of cytosine are relatively closer to substrates with distances of about 2.72 Å and 3.33 Å respectively.
For TMD–G, H of NH2 and O of guanine interact strongly than the other atoms and the vertical distance for this close contact is about 3.22 Å. In the case of MoS2/WS2–T, H atoms of two methyl groups of thiamine have a close contact (3.12 Å) with surface and for MoS2/WS2–U, similar to other complexes, H of CH3 of uracil is in close contact (3.15 Å) than other atoms. It should be noted that the presence of nucleobases does not modify the surface geometrical parameters such as M–S bond distances and S–M–S angles significantly. The unchanged geometrical parameters of TMD–nucleobase complexes clearly show that the nucleobases are physisorbed on monolayer TMDs. This physisorption is mainly due to van der Waals interaction between nucleobases and monolayer TMDs. The calculated vertical distances between MoS2, WS2 and GRA surfaces and nucleobases with PBE and DFT-D2 methods are shown in Table S2.† It is clear from Table 1 and S2† that the vertical distances between the substrates and nucleobases are larger with PBE and shorter with DFT-D2 with the values obtained with vdW-DF in between the PBE and DFT-D2 ones. Our obtained trend is similar to the one reported in literature.55
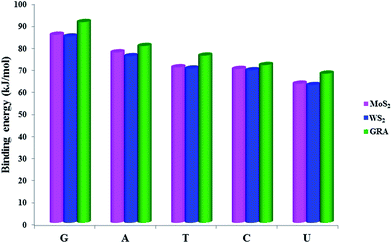
The comparison of binding energies of complexes of nucleobases with MoS2, WS2, and GRA is shown in Fig. 3. The order of binding affinity of nucleobases with MoS2 and WS2 is G > A > T > C > U, which is similar to that of GRA in the present study and also in earlier studies.14 Among all nucleobases, G has the highest binding affinity, which is similar to the nucleobase adsorption with GRA and h-BN sheets.19 We have considered another method, viz. DFT-D2 to treat vdW interactions to compare the results with vdW-DF method. The results are presented in Table S3† along with the results of PBE calculations without the inclusion of any vdW interaction. First of all, the binding energies predicted by PBE are very small along with relatively large vertical distances, which indicates the necessity of the treatment of vdW. Secondly, the vdW contributions to total binding energies of G, A, T, C and U adsorbed on MoS2 are 75.89, 71.36, 67.62, 61.48 and 58.88 kJ mol−1 respectively and for WS2 the values are 77.59, 71.24, 67.54, 61.01, 58.01 kJ mol−1 respectively. For GRA, the vdW contributions to the binding energies of G, A, T, C and U are 81.19, 70.41, 70.55, 64.40 and 63.52 kJ mol−1 respectively. The vdW contribution to the total binding energy clearly indicates physisorption of base molecules on the substrates. Finally, we want to comment that the binding energy difference between the nucleobases are 8–25 kJ mol−1, which is small. However, G has a higher binding affinity and it may be recognized by substrates similar to silicene.56
The calculated work functions for pristine MoS2, WS2 and GRA and nucleobase–substrate complexes are shown in Table 2.
| Work function (in eV) | |||
|---|---|---|---|
| MoS2 | WS2 | GRA | |
| Pristine | 5.74 | 5.57 | 4.00 |
| G | 5.18 | 5.06 | 3.62 |
| A | 5.40 | 5.10 | 3.80 |
| T | 5.50 | 5.24 | 3.78 |
| C | 5.60 | 5.42 | 3.84 |
| U | 5.64 | 5.29 | 3.81 |
The calculated work function of pristine graphene is 4 eV, which agrees well with work function of CVD-grown monolayer graphene (∼4.3 eV).60 Similarly, the calculated work function of MoS2 is closer to the experimental value of 5.25 eV.61 A previous DFT calculation62 reported the work function for WS2 to be 5.89 eV, which is close to our value of 5.57 eV. Due to adsorption of nucleobases, the work functions decrease by 0.1–0.56 eV, 0.15–0.51 eV and 0.16–0.38 eV for MoS2, WS2 and GRA respectively. The changes are not so dramatic as our calculated charge transfer by Bader analysis57–59 is around 0.01e between the nucleobases and the substrates.
Electronic structure of MoS2/WS2–nucleobases
To understand further the interactions of nucleobases with MoS2, WS2 and GRA, we have calculated total density of states (TDOS) of pure substrates and their complexes with nucleobases.The calculated TDOS of MoS2–nucleobase and WS2–nucleobase complexes are shown in Fig. 4 and 5. The same for GRA–nucleobases have been depicted in the ESI (Fig. S2†). For MoS2–G (−0.26 eV) and MoS2–A (−0.18 eV), a peak of molecular origin arises near the valence band maximum. For WS2–G complex, a similar type of peak occurs at −0.24 eV near the valance band. For all complexes with GRA, we have found the same conclusion.
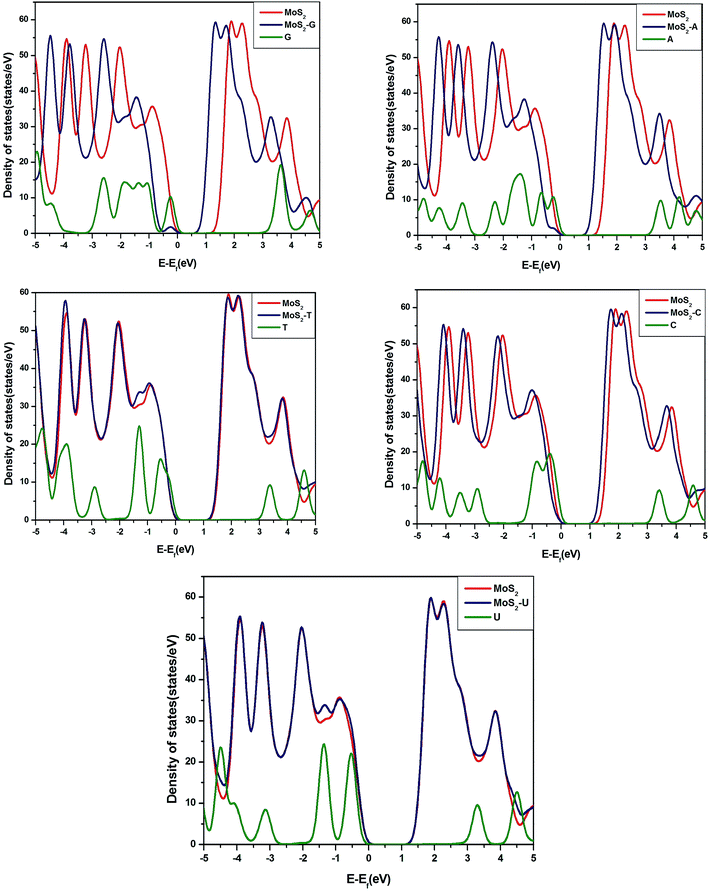 | ||
| Fig. 4 Total densities of states of pristine MoS2, MoS2–nucleobase complexes and nucleobases in the gas phase. | ||
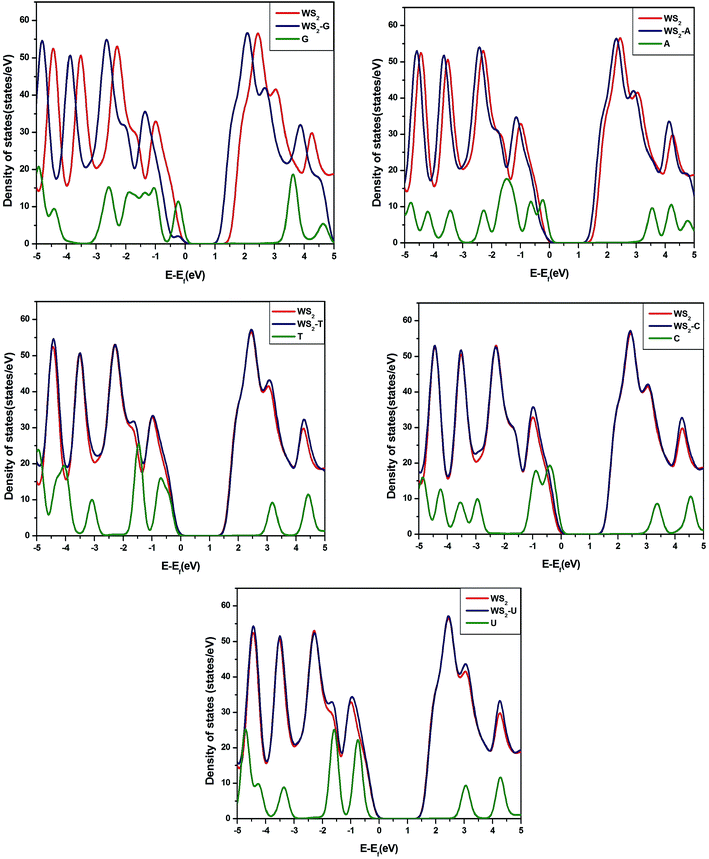 | ||
| Fig. 5 Total densities of states of pristine WS2, WS2–nucleobase complexes and S nucleobases in the gas phase. | ||
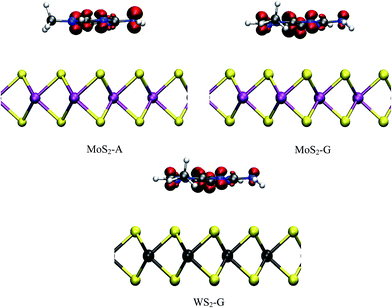
The calculated charge densities corresponding to the newly appearing peaks are shown in Fig. 6 for MoS2–G, MoS2–A and WS2–G complexes. It is clear that the charge densities are mainly localized on the nucleobases, once again confirming the molecular origin.
The calculated band gaps for pure MoS2, WS2 and their complexes with nucleobases are shown in Table 3.
| Band gap (in eV) | ||
|---|---|---|
| MoS2 | WS2 | |
| Pristine | 1.68 | 1.85 |
| G | 1.16 | 1.52 |
| A | 1.35 | 1.73 |
| T | 1.68 | 1.85 |
| C | 1.53 | 1.84 |
| U | 1.68 | 1.85 |
It can be seen from Table 3 and TDOS plots that pristine MoS2 and WS2 have band gaps of 1.68 eV and 1.85 eV respectively, which have a good agreement with experiments and previous theories.14,40 Changes in the band gap occur when nucleobases are adsorbed on MoS2, WS2 surfaces. Among all nucleobases, adsorption of G reduces the band gap of MoS2 and WS2 by the largest amount, i.e., 0.52 eV and 0.33 eV respectively whereas the amounts of reduction are 0.33 eV and 0.12 eV for the adsorption of A. T and U do not affect the band gaps. Band gaps of MoS2 and WS2 reduce to 0.15 and 0.10 eV respectively after the adsorption of C. For GRA complexes, the DOSs are shown in Fig. S2.† One can easily identify the extra features in the DOS of pristine graphene arising from molecular peaks.
Optical properties of TMD–nucleobase complexes
It is well known that 2D nanomaterials can be used as optical sensors for detecting DNA molecules.37,44,63,64 We have calculated the optical properties of pure systems and their complexes to explore distinct features in the optical spectra due to adsorption. The imaginary part of the dielectric functions of pure MoS2 and WS2 substrates and their complexes are shown in Fig. 7. In MoS2, the main absorption peak appears at 2.62 eV, which is in very good agreement with a previous study.52 The main peak for pure WS2 appears at 2.92 eV, which also matches well with an earlier report.40 Fig. 7 clearly demonstrates that the absorption spectra of MoS2–nucleobase and WS2–nucleobase complexes are identical to those of pure MoS2 and WS2. Therefore, the addition of nucleobases has no significant effect on the optical properties of pure MoS2 and WS2. A slightly different situation occurs for GRA. For GRA–nucleobases, the calculated absorption spectra are depicted in the ESI (Fig. S3†). For pure GRA, we have observed a high intensity peak at 4.9 eV and a low intensity peak at 14 eV, which have also been reported in earlier reports.65 Interestingly, a new peak is observed after the adsorption of nucleobases on GRA at 12.5 eV. To analyze the origin of this peak, absorption spectra of nucleobases and 2D GRA sheet in the complex have been calculated (Fig. S3†) separately to find that the new feature originates from the GRA part in the complex. It clearly demonstrates that the GRA sheet is modified due to adsorption and this detection is possible by optical means.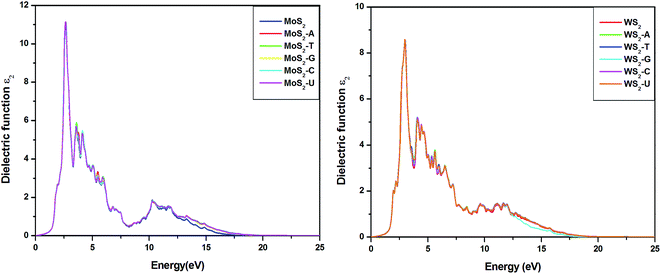 | ||
| Fig. 7 Imaginary part of the dielectric function of pristine TMD and its complexes with nucleobases. | ||
Conclusions
In this study, adsorption characteristics of DNA/RNA nucleobases on 2D monolayers of MoS2 and WS2 have been investigated using first principles DFT and vdW-DF scheme to treat van der Waals interaction. The results have been compared to those obtained for graphene. The salient outcomes of the present study are:All the nucleobases are physisorbed on MoS2 and WS2 with the order of interactions being G > A > T > C > U, which is similar to that of graphene. Adsorption occurs due to van der Waals interactions. The binding energies for MoS2–nucleobase and WS2–nucleobase complexes are lower than that of G–nucleobases due to the different surface electronic clouds of MoS2, WS2 and GRA. Charge transfer between the nucleobases and the substrates is very small (∼0.01e). The band gaps of MoS2 and WS2 are modified due to the adsorption of G, A and C nucleobases. The calculated work functions of the substrates decrease due to adsorption of nucleobases but not significantly. In general, some new features occur in the densities of states of substrates due to adsorption of nucleobases. As these originate from the nucleobases at different energies, a selective detection may be possible in certain cases.
Therefore, one may conclude from the analysis of geometries, energetics, electronic structures and optical properties of the above mentioned systems that similar to GRA, 2D MoS2 and WS2 substrates may also act as potential candidates to sense the nucleobases in DNA sequencing and other biomolecules.
Acknowledgements
This work is supported by VR-SIDA (Swedish Research Links), Linnaeus grant (Uppsala RNA Research Center) and Knut and Alice Wallenberg Foundation (RiboCORE). We gratefully acknowledge supercomputing time allocation by Swedish National Infrastructure for Computing (SNIC) for performing the computations. We acknowledge the supercomputing support from PRACE-3IP project (FP7 RI-312763) resource Cy-Tera based in Cyprus at CaSToRC and PRACE-3IP project (FP7 RI-312763) resource Zeus based in Poland at Cyfronet.Notes and references
- D. Klein, Trends Mol. Med., 2002, 8(6), 257–260 CrossRef CAS.
- C. Y. Zhang, H. C. Yeh, M. T. Kuroki and T. H. Wang, Nat. Mater., 2005, 4(11), 826–831 CrossRef CAS PubMed.
- W. Lu, X. Qin, Y. Luo, G. Chang and X. Sun, Microchim. Acta, 2011, 175(3–4), 355–359 CrossRef CAS.
- C. H. Lu, H. H. Yang, C. L. Zhu, X. Chen and G. N. Chen, Angew. Chem., 2009, 121(26), 4879–4881 CrossRef PubMed.
- S. He, B. Song, D. Li, C. Zhu, W. Qi, Y. Wen, L. Wang, S. Song, H. Fang and C. Fan, Adv. Funct. Mater., 2010, 20(3), 453–459 CrossRef CAS PubMed.
- S. Guo, D. Du, L. Tang, Y. Ning, Q. Yao and G. J. Zhang, Analyst, 2013, 138, 3216–3220 RSC.
- Y. Guo, L. Deng, J. Li, S. Guo, E. Wang and S. Dong, ACS Nano, 2011, 5(2), 1282–1290 CrossRef CAS PubMed.
- W. Xu, X. Xue, T. Li, H. Zeng and X. Liu, Angew. Chem., Int. Ed., 2009, 48(37), 6849–6852 CrossRef CAS PubMed.
- R. Yang, J. Jin, Y. Chen, N. Shao, H. Kang, Z. Xiao, Z. Tang, Y. Wu, Z. Zhu and W. Tan, J. Am. Chem. Soc., 2008, 130(26), 8351–8358 CrossRef CAS PubMed.
- V. Sorkin, H. Pan, H. Shi, S. Y. Quek and Y. W. Zhang, Crit. Rev. Solid State Mater. Sci., 2014, 39(5), 319–367 CrossRef CAS PubMed.
- F. Schedin, A. K. Geim, S. V. Morozov, E. W. Hill, P. Blake, M. I. Katsnelson and K. S. Novoselov, Nat. Mater., 2007, 6(9), 652–655 CrossRef CAS PubMed.
- O. Leenaerts, B. Partoens and F. M. Peeters, Phys. Rev. B: Condens. Matter Mater. Phys., 2008, 77, 125416 CrossRef.
- M. Zhou, Y. H. Lu, Y. Q. Cai, C. Zhang and Y. P. Feng, Nanotechnology, 2011, 22(38), 385502 CrossRef PubMed.
- S. Gowtham, R. H. Scheicher, R. Ahuja, R. Pandey and S. P. Karna, Phys. Rev. B: Condens. Matter Mater. Phys., 2007, 76(3), 033401–033405 CrossRef.
- G. H. Lu, L. E. Ocola and J. H. Chen, Nanotechnology, 2009, 20(44), 445502 CrossRef PubMed.
- S. Prezioso, F. Perrozzi, L. Giancaterini, C. Cantalini, E. Treossi, V. Palermo, M. Nardone, S. Santucci and L. Ottaviano, J. Phys. Chem. C, 2013, 117(20), 10683–10690 CAS.
- H. Vovusha, S. Sanyal and B. Sanyal, J. Phys. Chem. Lett., 2013, 4(21), 3710–3718 CrossRef CAS.
- N. Ding, X. Chen, C. M. Lawrence Wu and H. Li, Phys. Chem. Chem. Phys., 2013, 15, 10767–10776 RSC.
- J. H. Lee, Y. K. Choi, H. J. Kim, R. H. Scheicher and J. H. Cho, J. Phys. Chem. C, 2013, 117(26), 13435–13441 CAS.
- Q. H. Wang, K. Kalantar-Zadeh, A. Kis, J. N. Coleman and M. S. Strano, Nat. Nanotechnol., 2012, 7(11), 699–712 CrossRef CAS PubMed.
- B. Radisavljevic, A. Radenovic, J. Brivio, V. Giacometti and A. Kis, Nat. Nanotechnol., 2011, 6(3), 147–150 CrossRef CAS PubMed.
- K. F. Mak, C. Lee, J. Hone, J. Shan and T. F. Heinz, Phys. Rev. Lett., 2010, 105(13), 136805 CrossRef.
- Z. Y. Yin, H. Li, L. Jiang, Y. M. Shi, Y. H. Sun, G. Lu, Q. Zhang, X. D. Chen and H. Zhang, ACS Nano, 2012, 6(1), 74–80 CrossRef CAS PubMed.
- J. Liu, Z. Zeng, X. Cao, G. Lu, L. Wang, Q. Fan, W. Huang and H. Zhang, Small, 2012, 8(22), 3517–3522 CrossRef CAS PubMed.
- W. Zhou, D. Y. Yin, X. Huang, Z. Zeng, Z. Fan, H. Liu, J. Wang and H. Zhang, Small, 2013, 9(1), 140–147 CrossRef CAS PubMed.
- E. S. Kadantsev and P. Hawrylak, Solid State Commun., 2012, 152(10), 909–913 CrossRef CAS PubMed.
- J. N. Coleman, M. Lotya and A. O'Neill, et al., Science, 2011, 331(6017), 568–571 CrossRef CAS PubMed.
- K. G. Zhou, N. N. Mao, H. X. Wang, Y. Peng and H. L. Zhang, Angew. Chem., Int. Ed., 2011, 50(46), 10839–10842 CrossRef CAS PubMed.
- Z. Y. Zeng, Z. Y. Yin, X. Huang, H. Li, Q. Y. He, G. Lu, F. Boey and H. Zhang, Angew. Chem., Int. Ed., 2011, 50(47), 11093–11097 CrossRef CAS PubMed.
- Y. M. Shi, C. Hamsen, X. T. Jia, K. K. Kim, A. Reina, M. Hofmann, A. L. Hsu, K. Zhang, H. N. Li, Z. Y. Juang, M. S. Dresselhaus, L. J. Li and J. Kong, Nano Lett., 2010, 10(10), 4134–4139 CrossRef CAS PubMed.
- M. Chhowalla, H. S. Shin, G. Eda, L. J. Li, K. Loh and H. Zhang, Nat. Chem., 2013, 5(4), 263–275 CrossRef PubMed.
- F. Mehmood and R. Pachter, J. Appl. Phys., 2014, 115(16), 164302 CrossRef PubMed.
- Q. Yue, Z. Shao, S. Chang and J. Li, Nanoscale Res. Lett., 2013, 8, 425–432 CrossRef PubMed.
- F. K. Perkins, A. L. Friedman, E. Cobas, P. M. Campbell, G. G. Jernigan and B. T. Jonker, Nano Lett., 2013, 13(2), 668–673 CrossRef CAS PubMed.
- C. Ataca, H. Sahin and S. Ciraci, J. Phys. Chem. C, 2012, 116(6), 8983–8999 CAS.
- A. Klein, S. Tiefenbacher, V. Eyert, C. Pettenkofer and W. Jaegermann, Phys. Rev. B: Condens. Matter Mater. Phys., 2001, 64, 205416 CrossRef.
- S. Wang, Y. Zhang, Y. Ning and G. J. Zhang, Analyst, 2015, 140, 434–439 RSC.
- B. Amin, T. P. Kaloni and U. Schwingenschlögl, RSC Adv., 2014, 4, 34561 RSC.
- K. Ashok and P. K. Ahluwalia, Phys. B, 2012, 407(24), 4627–4634 CrossRef PubMed.
- J. Wei, Z. Ma, H. Zeng, Z. Wang, Q. Wei and P. Peng, AIP Adv., 2012, 2, 042141 CrossRef PubMed.
- V. Velusamy, K. Arshak, O. Korostynska, K. Oliwa and C. Adley, Biotechnol. Adv., 2010, 28(2), 232–254 CrossRef CAS PubMed.
- B. M. Paddle, Biosens. Bioelectron., 1996, 11, 1079–1113 CrossRef CAS.
- K. S. Novoselov, A. K. Geim, S. V. Morozov, D. Jiang, Y. Zhang, S. V. Dubonos, I. V. Griorieva and A. A. Firsov, Science, 2004, 306(5696), 666–669 CrossRef CAS PubMed.
- C. Zhu, Z. Zeng, H. Li, F. Li, C. Fan and H. Zhang, J. Am. Chem. Soc., 2013, 135(16), 5998–6001 CrossRef CAS PubMed.
- A. B. Farimani, K. Min and N. R. Aluru, ACS Nano, 2014, 8(8), 7914–7922 CrossRef CAS PubMed.
- Y. X. Yu, J. Mater. Chem. A, 2014, 2, 8910–8917 CAS.
- Y. X. Yu, ACS Appl. Mater. Interfaces, 2014, 6, 16267–16275 CAS.
- G. Kresse and J. Furthmuller, Comput. Mater. Sci., 1996, 6(1), 15–50 CrossRef CAS.
- G. Kresse and J. Furthmuller, Phys. Rev. B: Condens. Matter Mater. Phys., 1996, 54(16), 11169–11186 CrossRef CAS.
- J. Klimes, D. R. Bowler and A. Michelides, J. Phys.: Condens. Matter, 2010, 22, 022201 CrossRef PubMed.
- J. Klimes, D. R. Bowler and A. Michelides, Phys. Rev. B: Condens. Matter Mater. Phys., 2011, 83, 195131 CrossRef.
- J. Schutte, J. L. de Boer and F. Jellinek, J. Solid State Chem., 1987, 70(2), 207–209 CrossRef.
- Y. Li, Y. L. Li, C. M. Araujo, W. Luob and R. Ahuja, Catal. Sci. Technol., 2013, 3, 2214 CAS.
- W. A. Harrison, Electronic Structure and the Properties of Solids: the Physics of the Chemical Bond Freeman, San Francisco, 1980, p. 90 Search PubMed.
- D. Le, A. Kara, E. Schröder, P. Hyldgaard and T. S. Rahman, J. Phys.: Condens. Matter, 2012, 24, 424210 CrossRef PubMed.
- R. G. Amorim and R. H. Scheicher, Nanotechnology, 2015, 26, 154002 CrossRef PubMed.
- W. Tang, E. Sanville and G. Henkelman, J. Phys.: Condens. Matter, 2009, 21, 084204 CrossRef CAS PubMed.
- E. Sanville, S. D. Kenny, R. Smith and G. Henkelman, J. Comput. Chem., 2007, 28(5), 899–908 CrossRef CAS PubMed.
- G. Henkelman, A. Arnaldsson and H. Jónsson, Comput. Mater. Sci., 2006, 36, 254–360 CrossRef PubMed.
- S. Bae, H. Kim, Y. Lee, X. Xu, J. S. Park, Y. Zheng, J. Balakrishnan, T. Lei, H. R. Kim, Y. I. Song, Y. J. Kim, K. S. Kim, B. Ozyilmaz, J. H. Ahn, B. H. Hong and S. Iijima, Nat. Nanotechnol., 2010, 5, 574–578 CrossRef CAS PubMed.
- Y. Li, C.-Y. Xu, B.-Y. Zhang and L. Zhen, Appl. Phys. Lett., 2013, 103, 033122 CrossRef PubMed.
- C. S. Rout, P. D. Joshi, R. V. Kashid, D. S. Joag, M. A. More, A. J. Simbeck, M. Washington, S. K. Nayak and D. J. Latec, Sci. Rep., 2013, 3, 3282 Search PubMed.
- J. Balapanuru, J. Yang, S. Xiao, Q. Bao, M. Jahan, L. Polavarapu, J. Wei, Q. H. Xu and K. P. Loh, Angew. Chem., 2010, 122(37), 6699–6703 CrossRef PubMed.
- X. J. Xing, X. G. Liu, Y. He, Y. Lin, C. L. Zhang, H. W. Tang and D. W. Pang, Biomacromolecules, 2013, 14(1), 117–123 CrossRef CAS PubMed.
- P. Rani, G. S. Dubey and V. K. Jindal, Physica E, 2014, 62, 28–35 CrossRef CAS PubMed.
Footnote |
| † Electronic supplementary information (ESI) available: Optimized structures of GRA–nucleobase complexes, TDOS of pristine GRA, GRA–nucleobase complexes, absorption spectra of pristine GRA, GRA–nucleobase complexes and free nucleobases. See DOI: 10.1039/c5ra14664j |
| This journal is © The Royal Society of Chemistry 2015 |


