Selective hydrolysis of wheat straw hemicellulose using high-pressure CO2 as catalyst

Frederico M. Relvas a, Ana Rita C. Moraisab and Rafal Bogel-Lukasik*a
aUnidade de Bioenergia, Laboratório Nacional de Energia e Geologia, I.P., Estrada do Paço do Lumiar 22, 1649-038, Lisboa, Portugal. E-mail: rafal.lukasik@lneg.pt; Fax: +351 217163636; Tel: +351 210924600 ext. 4224
bLAQV/REQUIMTE, Departamento de Química, Faculdade de Ciências e Tecnologia, Universidade Nova de Lisboa, 2829-516 Caparica, Portugal

Received 23rd July 2015 , Accepted 24th August 2015

First published on 24th August 2015


Abstract

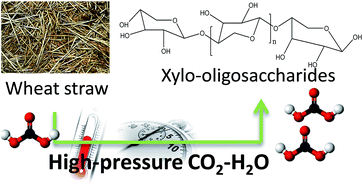
The processing of wheat straw using high-pressure CO2–H2O technology was studied with the objective to evaluate the effect of CO2 as catalyst on the hydrothermal production of hemicellulose-derived sugars either as oligomers or as monomers. Also, the reduction of the crystallinity of the cellulose-rich fraction was assessed. Over a range of reaction conditions (0 to 50 bar of initial CO2 pressure and 0 to 45 minutes of holding time, at T = 180 °C), the addition of CO2 to water-based processes led to the in situ formation of carbonic acid, which allowed us to obtain a higher dissolution of wheat straw hemicellulose. Furthermore, this approach led to a xylo-oligosaccharide (XOS) rich fraction, yielding 79.6 g of XOS per 100 g of the initial xylan content (at 50 bar of initial CO2 pressure and 12 min of residence time) while the water-only process gave only 70.8 g of XOS per 100 g of initial xylan content. Furthermore, for higher pressures of CO2, a decrease in oligosaccharide content was found and was counterbalanced by production of monomer sugars, achieving a maximum of 5.7 g L−1 at the severest condition.

1. Introduction

Worldwide energy demands coupled with a reduction of readily and economically available fossil feedstock and their environmental impacts have resulted in an extensive need for novel and sustainable sources of energy. Lignocellulosic biomass is the unique economic and environmentally acceptable alternative since it is abundant, renewable and low-cost, and does not compete with food and feed applications.1,2 Nowadays, lignocellulosic biomass is one of the most important energy sources, having an estimated annual production of 10–50 billion metric tons worldwide.3 One great example of the importance of lignocellulosic biomass is wheat straw, which is produced throughout the world as a residue of wheat cultivation. Wheat straw has drawn special attention due to its many interesting features that facilitate its valorization.4 For instances, it is produced in high amounts and it does not present an excessive commercial value.5 Presently, it is employed in low added-value applications such as animal-feed and bedding,6 mulch7 and pulp production.8 Furthermore, it is considered the agro-industrial residue that represents the uppermost potential for the production of second generation of bioethanol in Europe since its annual production is around 170 million tons per year.9,10

Lignocellulosic biomass has a very heterogeneous composition as it is generally composed of three main fractions: cellulose, hemicelluloses and lignin.11 Cellulose and hemicelluloses are constituted by polymers of hexosans and pentosans representing 35–50% and 20–40% of biomass, respectively. Lignin is a complex polymer matrix of aromatic alcohols constituting between 10 and 25% of the weight of entire biomass. The aforementioned complex composition and recalcitrant structure of lignocellulosic biomass creates a great challenge for its valorization in the biorefinery framework. In an effort to obtain all benefits of each biomass component, specific technologies are needed to deconstruct them and to make biomass available for further conversion to value-added products.12 Various physical, chemical, physico-chemical and biological pretreatment technologies have demonstrated to be efficient in deconstruction of recalcitrant structure of biomass increasing its susceptibility to enzymatic-based processes.13 On the other hand, most of these pretreatments are characterized by low selectivity influencing negatively the production of diverse value commodities at competitive costs. Thus, beyond the need to find alternative sources of energy, the development of novel and more environmentally benign technologies for lignocellulosic biomass processing is still strongly required.

Recently, green technologies such as high-pressure CO2–H2O approach have been used in the valorization of lignocellulosic and starch-based biomass to produce a wide-range of chemicals and others value-added products.14–20 Recently, Morais et al. published a review where the applicability and effectiveness of high-pressure CO2 and CO2–H2O technology for biomass pretreatment and its potential as alternative to conventional methods such as acid-catalyzed and water-only reactions were demonstrated.19 The presence of CO2 in hydrothermal processes allows to the in situ formation of acidic environment (CO2 + H2O ↔ (H2CO3), 2H2CO3 ↔ H3O+ + HCO3, HCO3 ↔ H3O+ + CO32−), which promotes acid-catalyzed hydrolysis of biomass-derived hemicellulose21 and simultaneously decreases cellulose crystallinity,22 without the typical disadvantages of acid-catalyzed reactions. In this respect, van Walsum et al. observed that the addition of CO2 to water-only reactions allowed to hydrolyze pure xylan to produce xylose oligomers at lower temperatures and at shorter holding times in comparison to those obtained with autohydrolysis (water-only) technology.23 Miyazawa and Funazukuri explored the effect of compressed CO2 in the hydrolysis of carbohydrates to monosaccharides under hydrothermal conditions.24 In water-only process, the final xylose yield was less than 5% while in CO2-assisted process a great improvement in the yield was achieved with lower production of degradation products in comparison to acid-catalyzed processes.

In this work, high-pressure CO2–H2O technology was selected for the pretreatment and hydrolysis of wheat straw. Previous results demonstrated the potential of this technology in hydrolysis of hemicellulose fraction into both oligosaccharides and monosaccharides25–27 concurrently with reduction of crystallinity of the processed materials. The kinetics of the wheat straw hemicellulose hydrolysis using high-pressure CO2–H2O is also reported in literature.27 The objective of this work was to evaluate the effect of holding time and initial CO2 pressures on the conversion of hemicellulose present in wheat straw to C5 sugars (either in oligomeric or in monomeric form) and its simultaneous effect on other constituents of biomass such as cellulose and lignin.

2. Experimental section

2.1. Raw material and chemicals

Wheat straw harvested in 2009 in Elvas, Portugal, was used as feedstock and was kindly supplied by Estação Nacional de Melhoramento de Plantas (Elvas, Portugal). The raw material was ground using a knife mill (IKA® WERKE, MF 10 basic, Germany) to a particle size smaller than 1.5 mm and stored at room temperature. The moisture level of wheat straw was determined upon drying at 105 °C for at least 18 h and was 8% w/w. CO2 used in high-pressure experiments was purchased from Air Liquide, AlphaGaz™ gamma, Paris, France with purity higher than 99.9% w/w. Distilled water (18.2 MΩ cm−1) was produced by Purelab Classic Elga system and ethanol (96% v/v), used to recover the gas phase during CO2 depressurization, was acquired from Carlo Erba Group, Arese, Italy. For infrared analysis, potassium bromide with >99.5% purity was purchased from Sigma-Aldrich Co. (St. Louis, MO). For compositional characterization of materials, aqueous solution of 72% w/w H2SO4 prepared from 96% w/w H2SO4 supplied by Panreac Química, Barcelona, Spain was used.

The chemical composition of wheat straw was presented elsewhere25 and is as follows (w/w): 38.5 ± 0.1 cellulose (as glucan), 19.1 ± 0.1 xylan, 3.0 ± 0.1 arabinan, 2.7 ± 0.2 acetyl groups, 17.7 ± 0.1 Klason lignin, 4.7 ± 0.1 protein, 10.7 ± 0.1 ash.

2.2. High-pressure CO2–H2O procedure

The high-pressure CO2–H2O treatment of wheat straw was carried out in a 160 mL stainless steel high-pressure Parr 4655 reactor (Parr Instruments Company, Moline, Illinois, USA) with Parr 4842 unit to monitor the reaction parameters such as temperature, pressure and agitation. The treatments were performed at isothermal conditions (180 °C) and fixed loading of 75 g of water and 7.5 g dry wheat straw with various holding times (from 0 min to 45 min) and CO2 pressures, namely: 0 (water-only reaction – no CO2 present), 20, 35 and 50 bar. Aiming to minimize the CO2 density variations caused by the initial temperature changes, the reactor was pressurized with CO2 at an initial temperature of −9 °C resulting in the reaction starting temperature of 17 °C. Next, the reaction mixture was heated up and stirred to the moment when the required temperature was achieved (180 °C). The reaction was continued for determined period of time (holding time) with continuous stirring and after that, the high-pressure reactor was rapidly cooled down using ice bath to quench the hemicellulose hydrolysis reaction. When temperature of the reaction mixture was 20 °C, the reactor was slowly depressurized and the gas phase was collected to a flask containing a known amount (5 g) of ethanol immersed in ice bath (0 °C). The depressurization was performed at controlled temperature to minimize loss of volatile compounds in the gas phase. This procedure allowed to capture all potentially volatile compounds in ethanol for further qualitative and quantitative analyses. Resulting liquid (liquor) and solid (processed materials) phases were separated by vacuum filtration. The qualitative and quantitative analyses of all fractions were performed using the procedures presented below.

2.3. Severity factor of high-pressure experiments

The severity factor was used with the aim to compare the data obtained at different reaction conditions. For water-only reaction, severity factor (R0)28 is described by the following equation: image file: c5ra14632a-t1.tif, where t is time expressed in minutes, T abbreviates temperature expressed in °C and 14.75 is an empirical parameter related with temperature and activation energy. A combined severity factor (CSpCO2)23 was applied to investigate the effect of high-pressure CO2–H2O technology on wheat straw pretreatment. For this purpose, CSpCO2 = log(R0) − pH equation was used. The direct pH measurements were technically impossible due to elevated temperature and pressure used in this process. Thus pH was estimated using to the following expression: pH = 8.00 × 10⁻⁶ × T2 + 0.00209 × ln(pCO2) + 3.92, where T is the temperature in °C and pCO2 is the partial pressure of CO2 expressed in atmospheres.23

In order to study the effect of CO2 concentration on the severity of reaction (R0), the CO2 density was calculated according to Peng–Robinson equation of state29 using both initial temperature and CO2 pressure employed in each experiment. For the same calculations, the Henry's constant (H) was determined according to the literature23 using the empirical equation H(T) = −0.017037T2 + 6.1553T + 78.227. The CO2 solubility in water was taken from literature30 and modelled using PE software31 for required temperature.

2.4. Chemical analysis

2.4.1. Characterization of liquor and post-hydrolysate liquors. The liquid phases (liquors) produced in both the high-pressure CO2–H2O and the water-only treatments were analyzed according to a method presented elsewhere.25 For the determination of total sugars, either in oligomeric or in monomeric form, an acid hydrolysis procedure was applied as described in literature.32
2.4.2. Characterization of processed solids. The processed solids were characterized according to the method described elsewhere.25 Glucan, xylan, arabinan and acetyl groups contents were determined using quantitative acid hydrolysis with 72% w/w H2SO4 according to the standard procedure published elsewhere.33 Klason lignin was determined gravimetrically after correction for the acid insoluble ash. The ash content was established using NREL/TP-510-42622 protocol.34
2.4.2.1. Fourier transform infrared spectroscopy (FTIR). FTIR spectra of produced samples were recorded using a spectrometer Spectrum BX, Perkin Elmer, Inc. (San Jose, CA, USA). This instrument was equipped with a DTGS detector and a KBr beam splitter. The used operating system was the Spectrum software (Version 5.3.1, Perkin Elmer, Inc., San Jose, CA, USA). FTIR spectra were recorded in the 4000–400 cm−1 region, with a total of 64 scans and a resolution of 4 cm−1 with strong apodization. For each analysis, the spectrum of the air background was subtracted. The areas of absorption bands at 1437 and 898 cm−1 were analyzed to calculate the cellulose crystallinity index according to the following equation: image file: c5ra14632a-t2.tif,35 where LOI is lateral order index and A is the absorbance value of the corresponding band.

2.5. Error analysis

Standard uncertainty (u) was determined for all the obtained results. Each weighing was made considering a u(m) = 0.1 mg. All pretreatments were made with a u(T) = 1 °C and a u(p) = 1 bar. An arbitrary error of 10% of measured value was defined for all the FTIR measurements and HPLC analyzes.

3. Results

3.1. Chemical composition of liquors

High pressure CO2–H2O and water-only reactions resulted in liquors containing products from hemicellulose hydrolysis such as XOS and arabino-oligosaccharide (AOS) or their respective monosaccharides (xylose and arabinose), aliphatic acids (acetic and formic acid) and trace amounts of furfural (the main product of pentose degradation). Additionally, products of cellulose hydrolysis such as glucose, mainly as gluco-oligosaccharide (GlcOS), and 5-hydroxymethylfurfural (5-HMF) (glucose degradation product) were found as well. The respective yield of each product is presented in Tables 1 and 2. The formation of all these compounds is highly dependent on the reaction conditions namely holding time and initial CO2 pressure, as it is clearly depicted in Fig. 1–3.
Table 1 Yield of each product present in liquors obtained in high-pressure CO2–H2O processes performed at 50 and 35 bar of initial CO2 pressure with respective severity factor and both estimated and measured pH values
a Calculated according to literature.23
t (min) 0 4 6 12 18 20 25 30 35 45 0 4 8 12 16 20 25 30 40
pinitial (bar) 50 35
CSpCO2a −1.16 −0.64 −0.49 −0.25 −0.09 −0.05 0.07 0.14 0.19 0.30 −1.25 −0.70 −0.45 −0.30 −0.19 −0.10 0.00 0.08 0.19
Estimated pH 3.72 3.78
Final pH 4.46 4.38 4.37 4.11 3.94 3.99 3.92 3.62 3.73 3.64 4.5 4.33 4.23 4.22 3.92 3.9 3.65 3.66 3.58
[thin space (1/6-em)]
Yield (g per 100 g of initial amount present in raw material)
XOS 38.9 55.3 60.1 79.6 73.7 66.1 64.2 40.7 27.5 18.6 36.8 60.0 67.9 73.0 72.4 57.7 50.4 33.5 31.9
AOS 53.0 62.3 54.6 39.9 39.3 15.3 29.7 8.0 9.7 7.3 49.1 57.0 47.7 35.5 44.4 29.4 19.9 10.1 15.3
GlcOS 11.5 9.5 9.2 10.4 11.3 9.5 9.9 9.3 6.7 7.5 11.6 9.9 11.3 12.3 12.0 11.0 10.7 7.2 8.7
Xylose 6.1 7.1 6.4 9.0 12.6 12.0 13.9 23.9 21.4 26.9 5.8 6.5 7.9 9.8 9.9 14.5 15.6 21.1 21.8
Arabinose 30.2 32.5 27.4 34.8 34.0 35.9 27.6 41.0 18.6 20.4 20.6 28.9 34.8 41.4 29.8 34.5 23.0 23.2 20.3
Glucose 1.9 1.9 1.3 1.5 1.5 1.5 1.2 3.0 1.4 2.1 0.9 1.5 1.5 1.3 0.6 1.4 0.8 1.6 1.5
5-HMF 0.0 0.1 0.1 0.3 0.4 0.4 0.4 0.8 0.7 1.4 0.1 0.1 0.1 0.2 0.3 0.4 0.5 0.6 0.9
Furfural 0.0 0.0 0.7 3.3 5.3 5.1 7.7 16.4 17.8 25.2 0.0 0.7 0.7 1.6 4.7 6.4 6.4 9.7 16.4


Table 2 Yield of each product present in liquors obtained in high-pressure CO2–H2O reactions performed at 20 bar of initial CO2 pressure and water-only experiments with respective severity factor and both estimated and measured pH values
a Calculated according to literature.23b log[thin space (1/6-em)]R0 determined according to literature.28
t (min) 0 4 8 12 16 20 25 30 40 0 4 8 12 16 20 25 30 40
pinitial (bar) 20 0
CSpCO2a/log[thin space (1/6-em)]R0 −1.28 −0.70 −0.45 −0.30 −0.19 −0.09 0.00 0.07 0.20 2.74b 3.20b 3.39b 3.52b 3.63b 3.71b 3.80b 3.87b 3.99b
Estimated pH 3.78
Final pH 4.35 4.04 3.95 3.85 3.8 3.6 3.6 3.6 3.53 4.48 4.4 4.15 4.02 4.07 3.93 3.78 3.8 3.73
[thin space (1/6-em)]
Yield (g per 100 g of initial amount present in raw material)
XOS 34.4 55.0 65.6 67.5 63.6 60.3 52.1 40.7 22.7 28.9 46.3 60.5 70.8 73.1 72.5 70.5 66.6 50.3
AOS 49.8 56.6 41.0 36.4 35.2 26.8 23.2 20.7 14.9 53.2 55.3 56.9 55.7 47.6 40.7 30.6 28.7 20.1
GlcOS 10.0 11.3 11.0 9.5 12.3 9.1 9.3 9.3 8.0 11.9 11.6 12.5 11.8 11.0 12.1 10.7 10.7 10.0
Xylose 5.7 6.4 7.9 10.9 16.2 15.7 18.0 20.5 25.1 5.8 6.0 6.3 6.2 8.0 10.9 11.6 13.9 19.9
Arabinose 21.6 30.8 39.7 32.4 29.7 28.3 25.1 20.7 18.9 18.0 28.9 32.0 34.1 32.0 33.7 31.2 31.7 27.4
Glucose 1.6 1.2 1.0 1.1 1.7 1.5 1.5 1.3 1.8 0.9 1.2 1.5 0.8 0.8 0.8 0.7 0.9 1.16
5-HMF 0.0 0.1 0.2 0.3 1.7 0.4 0.5 0.7 1.0 0.0 0.1 0.1 0.1 0.2 0.3 0.3 0.4 0.6
Furfural 0.1 0.6 1.3 4.1 4.4 8.8 7.7 11.8 23.0 0.0 0.2 0.7 1.1 2.7 4.3 5.9 8.8 14.0


image file: c5ra14632a-f1.tif
Fig. 1 Composition of liquors in terms of oligosaccharides (OS) (● – total OS, △ – XOS, ▲ – GlcOS, ○ – AOS) obtained from high-pressure CO2–H2O experiment performed at (a) 50 bar, (b) 35 bar, (c) and 20 bar of initial CO2 pressure and (d) water-only reaction as function of holding time.

Xylo-oligosaccharides were found to be the main products present in produced liquors. The processing of wheat straw using high-pressure CO2–H2O, performed with 50 bar of initial CO2 pressure for 12 min of holding time (CSpCO2 = −0.25), yielded a 79.6% xylan conversion to XOS with corresponding concentration of XOS as high as 14.8 g L−1. As increase of reaction severity (namely holding time), a decline in XOS content was observed, achieving its minimum (3.6 g L−1 or 18.6% of xylan conversion to XOS) for 45 min of reaction time (CSpCO2 = 0.30). Under this condition, an extended xylan hydrolysis to xylose and furfural (26.9% and 25.2%, respectively) coupled with loss of 77% of XOS yield were observed. Additionally, interesting is that comparing the reactions with different initial CO2 pressures, the XOS concentration was 18% higher for reactions performed with 50 bar of initial pressure of CO2 than this obtained at 20 bar of initial CO2 pressure. On the other hand, higher CO2 pressures favored quick decay of XOS yield along the reaction time than in the case of lower CO2 pressures.

Considering the effect of CO2 presence, it can be stated that, the addition of CO2 (initial pressure of 50 bar) to water-only reaction improved the XOS concentration by almost 10% and at the same time the highest XOS concentration was observed at shorter holding reaction time (shift from 16 to 12 min) as presented in Tables 1 and 2.

Xylose was the main monosaccharide present in liquors as depicted in Fig. 2. Under the best condition for XOS production (CSpCO2 = −0.25), the concentration of released xylose corresponded to 9% of the initial xylan content. The concentration of xylose increased with the progress of reaction severity achieving a maximum concentration of 5.7 g L−1 (26.9% xylan yield) at severest condition. Evaluating the influence of CO2 presence, the xylose concentration increased 71% with an initial CO2 pressure of 50 bar than in water-only reactions for the same holding reaction time (30 min).


image file: c5ra14632a-f2.tif
Fig. 2 Composition of liquors in terms of pentoses (▲ – xylose, △– arabinose) and ○ – furfural obtained from high-pressure CO2–H2O experiment performed at (a) 50 bar, (b) 35 bar, (c) and 20 bar of initial CO2 pressure and (d) water-only reaction as function of holding time.

Other hemicellulose-derived products such as arabino-oligosaccharides and arabinose exhibited similar profiles to those found for XOS and xylose. Under, the best condition for XOS production, the yield of released AOS and arabinose corresponded to 39.9% and 34.8% of initial arabinan content, respectively. Due to low content of arabinan in the raw material, the maximum concentration of AOS was only 1.9 g L−1 and it was achieved at the shortest examined holding time (4 min at 50 bar of initial CO2 pressure). For longer holding times, the concentrations of AOS and arabinose decreased rapidly and reached a minimum of 0.2 g L−1 and 0.7 g L−1, respectively.

The obtained liquors also contained free acetic acid and acetyl groups linked to oligosaccharides. As expected, the concentration of acetic acid increased along the reaction progress but demonstrated a tendency to stabilize (2.7 g L−1) for prolonged reactions.

The major C5-sugar degradation product, furfural, was detected in almost all experiments. The formation of furfural is highly influenced by either initial CO2 pressure or holding time. The increase of holding time from 12 min (CSpCO2 = −0.25) to 45 min (CSpCO2 = 0.30), increased furfural concentration almost 7.5-fold reaching even 25.2% xylan conversion yield. Furthermore, an increase of 85% of furfural concentration was observed in case of high-pressure CO2–H2O with 50 bar of initial CO2 pressure for 30 min in comparison to water-only reaction at the same holding time.

Among C6-derived products, gluco-oligosaccharides and glucose were found in the liquors. The formation of glucose in either oligomeric or monomeric form may have its origin in hydrolysis of amorphous cellulose, which is highly prone to hydrolysis even at very mild conditions. Analyzing the produced data it is clear that both GlcOS and glucose generally followed patterns of XOS and xylose. Even more, scrutinizing the effect of CO2, it can be concluded that in high-pressure CO2–H2O reactions performed at 50 bar of initial CO2 pressure for 30 min (CSpCO2 = 0.14) and in water-only process, the obtained GlcOS concentrations were very similar (3.4 g L−1 and 4.0 g L−1, respectively). On the other hand, the concentration of glucose was relatively different and in the case of high-pressure CO2–H2O was two times higher than in water-only reaction.

3.2. The composition of processed residues

The severity of reaction conditions (addition of CO2, various initial CO2 pressures and holding times) influenced either the liquor composition discussed above or the chemical composition of processed solids. The chemical composition of processed materials and respective solid recovery yields obtained from high-pressure CO2–H2O and water-only experiments under various experimental conditions are depicted in Tables 3 and 4.
Table 3 The composition and recovery yields (g per 100 g of raw material) of processed solids obtained in high-pressure CO2–H2O experiments performed at initial CO2 pressure of 50 and 35 bar
a Calculated according to literature.23
t (min) 0 4 6 12 18 20 25 30 35 45 0 4 8 12 16 20 25 30 40
pinitial (bar) 50 35
CSpCO2a −1.16 −0.64 −0.49 −0.25 −0.09 −0.05 0.07 0.14 0.19 0.30 −1.25 −0.70 −0.45 −0.30 −0.19 −0.10 0.00 0.08 0.19
Solid yield 90.0 92.8 91.0 67.2 73.8 66.9 72.3 60.4 60.1 65.5 90.7 89.2 87.0 63.9 68.8 69.7 67.4 67.2 66.9
[thin space (1/6-em)]
Composition
Glucan 36.8 41.3 41.5 33.9 37.6 33.0 36.4 31.0 32.3 31.6 37.5 41.7 43.1 31.4 35.1 34.4 35.0 35.3 32.2
Xylan 14.2 13.9 12.8 6.4 5.8 5.4 4.8 2.5 2.4 1.8 16.0 11.3 8.9 5.2 4.9 4.7 3.2 2.5 2.3
Arabinan 1.2 1.0 1.0 0.3 0.4 0.3 0.4 0.1 0.3 0.0 1.2 0.7 0.3 0.1 0.1 0.1 0.0 0.0 0.0
Acetyl groups 2.4 2.4 2.3 1.2 1.2 1.1 1.0 0.7 0.7 0.7 2.7 2.1 1.9 1.2 1.2 1.1 0.9 0.9 0.9
Klason lignin 17.7 19.1 20.2 17.6 20.3 18.5 20.3 19.4 19.1 22.8 18.5 20.7 21.7 17.3 19.6 20.8 20.9 21.6 22.1


Table 4 The composition and recovery yields (g per 100 g of raw material) of processed solids obtained in high-pressure CO2–H2O reactions performed at initial CO2 pressure of 20 bar and water-only reactions
a Calculated according to literature.23b log[thin space (1/6-em)]R0 calculated according to literature.28
t (min) 0 4 8 12 16 20 25 30 40 0 4 8 12 16 20 25 30 40
pinitial (bar) 20 0
CSpCO2a/log[thin space (1/6-em)]R0 −1.28 −0.70 −0.45 −0.30 −0.19 −0.09 0.00 0.07 0.20 2.74b 3.20b 3.39b 3.52b 3.63b 3.71b 3.80b 3.87b 3.99b
Solid yield 92.9 70.9 72.5 67.0 64.6 68.7 67.7 65.8 67.6 92.8 83.7 75.4 74.4 71.4 65.5 67.0 66.9 69.0
[thin space (1/6-em)]
Composition
Glucan 37.5 31.6 34.4 32.0 31.4 35.1 33.4 33.7 35.1 35.9 35.6 34.2 37.2 31.1 32.6 34.4 33.4 35.9
Xylan 15.5 9.1 8.0 5.3 4.6 4.2 3.2 2.6 2.5 17.8 13.3 10.6 9.3 7.3 6.4 5.2 5.0 4.0
Arabinan 1.3 0.4 0.2 0.1 0.1 0.0 0.0 0.0 0.0 1.6 0.7 0.4 0.2 0.2 0.2 0.1 0.0 0.0
Acetyl groups 2.6 1.6 1.4 1.1 1.0 1.0 0.8 0.7 0.7 2.5 1.8 1.3 1.0 0.9 0.7 0.5 0.5 0.4
Klason lignin 19.4 16.0 17.1 17.6 17.8 19.5 21.0 20.7 22.1 19.5 18.3 17.9 18.8 18.4 18.4 19.0 20.1 21.2


For all experiments, the lowest observed solid recovery yield was 60.4%. The water-only reactions demonstrated lower biomass dissolution resulting in solid recovery yield of 66.9% (for 30 min of reaction). This 11% of difference is mainly caused by more extensive CO2-assisted hydrolysis of hemicellulose, in particularly xylan, arabinan and acetyl groups. The presence of CO2 led to an efficient decrease of hemicellulose content in the processed materials and consequently in lower solid recovery yield. Considering the holding time effect, it is clear that it played a great role on biomass recovery yield either for CO2-assisted or for water-only reaction. As increase of the reaction time, the solid recovery yield decreased by 1/3 in comparison to the initial solid recovery yield found for 0 min holding time.

The performed pretreatments (high-pressure CO2–H2O and water-only reaction) also resulted in noticeable changes in chemical composition of processed solids. For the most severe CO2-assisted reaction (CSpCO2 = 0.30), up to 90.2% of hemicelluloses were removed. Despite the extensive hemicelluloses removal, an incomplete hydrolysis of xylan and minor amounts of acetyl groups present in processed solids were observed. For example, the content of xylan in processed solids gradually decreased with an increase of reaction severity reaching only 2.5% for the severest condition (CSpCO2 = 0.30). For water-only process at similar holding reaction time, the xylan content was 2-fold higher.

Similarly to the composition of the raw material, glucan is the major constituent of all processed solids, and for two the highest pressures examined its concentration decreased by less than 10% along the reaction time. For 20 bar of initial CO2 pressure and for water-only reaction, the glucan content was kept constant and varied within the experimental error. Another component of lignocellulosic biomass remaining in the processed materials is lignin. The lignin recovery was found to be between 16.0 and 22.8%. The reactions performed at two the highest initial CO2 pressures led to an increase of the lignin content in the processed materials to values above the lignin content in raw material. This fact could be explained by the formation of solid carbonaceous species (i.e. humins) due to lignin condensation reactions.36–39

4. Discussion

4.1. Production of oligosaccharides

The hemicellulose fraction is the most susceptible polymer to hydrothermal treatment due to lack of crystalline and resistant structure.40 For instances, Liu et al. observed a total hydrolysis of hemicellulose (99%) into its sugar constituents for 15 min at 220 °C in compressed water process.41 Also Laakso and co-workers found a total sugar release of 66% from arabinoxylan at optimal autohydrolysis conditions (log[thin space (1/6-em)]R0 = 3.81).42 On the other hand, data presented herein indicates that presence of CO2 promotes the hydrolysis of xylan to XOS. This beneficial effect occurs due to the in situ formation of carbonic acid in the presence of water.23,26,43 The dissociation of unstable carbonic acid increases the concentration of hydronium ion, which helps to lower the pH value of the reaction medium (slightly above 3), promoting dissolution and hydrolysis of biomass constituents.25 Furthermore, the addition of CO2 enhances the conventional hydrothermal reactions since it permits to use lower temperatures and shorter holding times. Similar effect of carbonic acid was found by van Walsum who dissolved CO2 in water to obtain a higher pentose yield in the liquid fraction in comparison to CO2-free reactions.23 Comparing the results obtained in this work to those achieved by Carvalheiro et al. it can be also stated that the presence of CO2 guided to almost 50% more production of XOS than a autohydrolysis process at maximal XOS concentration conditions (215 °C at 0 min holding time).5 For similar reaction conditions (log[thin space (1/6-em)]R0 = 3.50), the XOS concentration obtained with a high-pressure CO2–H2O is even more pronounced because it is 142% higher than that presented in literature.5

Even at the highest initial CO2 pressure (50 bar) conditions, the solubility of CO2 in water phase is very low (0.01 mol fraction of CO2).30 Nevertheless, this limited solubility is high enough to contribute to lower pH value of the medium promoting the hydrolysis of hemicellulose. In addition, the obtained results clearly show that even lower pressure of CO2 (e.g. 35 bar) is sufficient to play an important role in hemicellulose hydrolysis. For instances, at maximal XOS concentration (CSpCO2 = −0.45), the solubility of CO2 in aqueous phase is as low as xCO2 = 0.007.

For the lowest initial CO2 pressure conditions, XOS concentration remains lower because the solubility of CO2 in water is null creating a system with three immiscible phases constituted by gaseous CO2, aqueous liquid phase and solid biomass. This explains why the three phase system formed by 20 bar of initial CO2 pressure allowed to obtain a pH of liquor and the concentration of XOS very similar to those obtained in the water-only reaction. This result also demonstrates the beneficial catalytic effect of CO2, which can only be achieved when CO2 is added at determined pressures.

Contrary to hemicellulose, cellulose is a very resistant polymer to hydrolysis, since it is mainly composed of a crystalline structure with just some amorphous regions.44,45 Hydrothermal technologies proved the ability to hydrolyze hydrogen-bond-linked structure of cellulose and its glycosidic bonds into glucose monomers. However, due to harsher conditions required for the cellulose hydrolysis, both GlcOS and glucose undergo quick conversion to degradation products such as 5-HMF. The conditions employed in this work are relatively mild to perform the hydrolysis of crystalline cellulose, thus it can be expected that the presence of GlcOS and glucose observed in all experiments was rather originated from the hydrolysis of amorphous cellulose than crystalline as it was also already reported in the literature.5,26

4.2. Formation of monosaccharides and furanic products

The high-pressure CO2–H2O processing of wheat straw allowed to produce C5-sugars namely xylose and arabinose. The relation between production of xylose and furfural at various initial CO2 pressures throughout the reaction time is depicted in Fig. 2. The highest concentration of xylose and furfural (5.7 and 3.4 g L−1, respectively) were found in liquors produced from highest CO2 pressure condition, while for water-only reaction these values were 67% and 80% lower, correspondingly. In addition, the concentration of xylose increased steadily over reaction times showing that severer conditions are needed to promote the hydrolysis of XOS into monomers and later to furfural. These results are in agreement with those presented in literature.23,46,47 As presented by van Walsum it was found that carbonic acid acts as catalyst in hydrolysis of pure xylan permitting to obtain oligosaccharides with lower depolymerization degree in comparison to those obtained in water-only reaction.23 Zhang and Wu investigated the influence of subcritical CO2 in sugarcane pretreatment and found that the highest xylose yield obtained was 15.8% (g per 100 g of feedstock), among which 45.2% corresponded to XOS.46 Gurgel et al. studied the addition of high-pressure CO2 to water-only reaction in the production of D-xylose from sugarcane bagasse.47 The maximum xylose concentration (115 °C, 68 bar of initial CO2 pressure for 60 min) was only 9.8 g L−1. Thus, bearing in mind the profile of XOS and xylose as well as their C6 homologs, it can be stated that the addition of CO2 to water-only reaction promotes the hydrolysis of oligosaccharides to monomer analogs.

4.3. Formation of aliphatic acids and their influence on pH

One of important aspects examined in this work was the pH of the produced liquors. As mentioned above, due to the technical reasons the pH of liquors could only be measured after reaction ends. In the case of CO2-assisted reactions pH was also estimated according to the equation presented elsewhere.23 The estimated pH values were lower than the measured ones for shorter holding times as it is demonstrated in Tables 1 and 2. This can be explained by dissolution of CO2 in water, which promotes the in situ carbonic acid formation responsible for pH lowering. The removal of CO2 during the depressurization led to the increase of pH which is reflected in the measured values. Hence, it can be concluded that the measured pH does not demonstrate the acidity of the medium during CO2-assisted reactions. For this reason analyzing the pH listed in Tables 1 and 2, the pH values measured after depressurization at room temperature vary between 4.5 and 3.6. Therefore, after depressurization, the “acidification” effect of CO2 dissolved in liquor is minimal, hence there must be another factor influencing the acidity of the medium especially so much noticeable for longer holding times. The answer lies in the composition of liquors and it is clear that along the reaction time the organic acids, such as acetic and formic, were formed which are responsible for pH decays (Fig. 3).
image file: c5ra14632a-f3.tif
Fig. 3 Composition of liquors in terms of aliphatic acids (▲ – acetic acid, △ – formic acid) obtained from high-pressure CO2–H2O experiments performed at (a) 50 bar, (b) 35 bar, (c) and 20 bar of initial CO2 pressure and (d) water-only reaction as function of holding time.

Various literature reports show that extensive hydrolysis of hemicellulosic acetyl groups after autohydrolysis experiments guided to lower pH.5,48,49 van Walsum et al. discovered very similar behavior by founding that the pH of liquors from corn stover and aspen wood treatment were quite different (3.68 and 4.95, respectively). This difference in final pH can be explained by the autocatalytic hydrolysis effect of acetyl groups of aspen wood in comparison to those of corn stover.43 McWilliams et al. did not report any beneficial effect of CO2 addition to water-only reaction on hydrolysis of aspen wood at 180–220 °C since the formation of carbonic acid improved neither xylose nor furfural compounds yield.50 Although this work does not show any benefits in the use of CO2 it is important to understand that aspen wood contains highly acetylated hemicelluloses and these compounds are highly susceptible to autohydrolysis at temperatures above 170 °C, thus no additional of CO2 was required51 as the formed acetic acid catalyzes the hydrolysis of the hemicellulose.

4.4. Effect of high-pressure CO2–H2O on composition of processed solids

During high-pressure CO2–H2O treatments, the extension of hemicellulose hydrolysis is highly influenced by the process severity, while cellulose and lignin are retained in the processed solids. This data matches with the increasing sugar content in liquors up to a point that production of degradation products such as furfural and 5-HMF started to dominate. Tables 3 and 4 show the composition of the processed solid in function of pretreatment severity. This data is in a good agreement with literature because Morais et al.26 found a xylan content in processed material of 5.2% while in this work was found 5.8%, for similar combined severity factor (CSpCO2 = 0.19).

It is known that arabinan is one of the easiest hydrolysable fractions of hemicellulose5 and arabinan content in the processed solids decreased with the increase of the reaction severity. Similarly, the content of acetyl group in produced solids decreased accordingly to the increase of acetic acid concentration in the liquor reaching the content as low as 0.7% at CSpCO2 = 0.30 similarly to literature reports where comparable range of acetyl groups content was found in processed solids.5,25,26

At the severest condition examined (CSpCO2 = 0.30), the processed solids presented high cellulose and Klason lignin contents. Among all polysaccharides present in lignocellulosic biomass, cellulose is the least prone fraction for hydrolysis and this was also observed in liquor composition in which the concentration of GlcOS, glucose and 5-HMF were lower than products derived from hemicellulose. This cellulose characteristic is even more visible considering the relative amount of glucan in processed solids that was strongly enriched in comparison to the untreated biomass. Nevertheless, there are other parameters, such as both biomass and cellulose crystallinity that constitute a hurdle to achieve high enzymatic hydrolysis yields. To evaluate the effect of high-pressure CO2–H2O on cellulose crystallinity, native biomass and two processed solids samples (produced from high-pressure CO2–H2O performed at CSpCO2 = 0.14 and water-only reaction carried out with log[thin space (1/6-em)]R0 = 3.87), underwent the FTIR analysis. Two absorption bands were selected for analysis of cellulose-rich fraction crystallinity. A band at 1437 cm−1 is characteristic to the scissoring vibration assigned to CH2 in the crystalline cellulose and the band at 898 cm−1, assigned to C–O–C bonds of β-1,4-glycosidic bonds is typical for amorphous fractions i.e. amorphous cellulose and hemicellulose.52 To compare the cellulose-rich fraction crystallinities, the LOI index, which is the ratio between absorption bands at 1437 cm−1 and 898 cm−1, was calculated.35 The LOI results for native wheat straw and processed solids by water-only reaction and high-pressure CO2–H2O are given in Table 5.

Table 5 LOI index for native, water-only reaction and high-pressure CO2–H2O processed wheat straw samples
  A1437 A898 LOI (A1437/A898)
Native wheat straw 0.239 0.104 2.30
Water-only reaction (log[thin space (1/6-em)]R0 = 3.87) 0.217 0.061 3.56
High-pressure CO2–H2O (CSpCO2 = 0.14) 0.183 0.044 4.16


The analysis of produced data shows that LOI for the untreated biomass has lower value (LOI = 2.30) than processed biomasses from water-only reaction (3.56) and high-pressure CO2–H2O processed solid (4.16). However, close inspection of obtained data shows that water-only process removed amorphous fractions (either cellulose or hemicellulose) as the absorption of the band at 898 cm−1 was reduced by 41% in comparison to untreated wheat straw while at the same time crystalline cellulose was affected insignificantly. In the case of high-pressure CO2–H2O, both “amorphous” and “crystalline” bands were affected because both were reduced significantly. Although the LOI data does not reflect directly the reduction of crystallinity but the understanding of the vibrations resulting in creation of both bands allows to state that the water-only reaction in comparison to high-pressure CO2–H2O is less severe, reduces the crystallinity less and is more selective for hemicellulose hydrolysis.

Klason lignin is the second major component of processed solids and its content increased with the reaction progress and with the increase of exerted CO2 pressure. Analogously to cellulose, the Klason lignin content in processed solids increased due to enhancement of a xylan removal. The Klason lignin content in processed materials is typical either for autohydrolysis process or for high pressure CO2-assisted autohydrolysis as reported in literature.5,25,26,49

5. Conclusions

This work shows the potential of high-pressure CO2–H2O approach as effective and more sustainable pretreatment method of lignocellulosic biomass. The opted methodology was highly selective towards hydrolysis of wheat straw-derived hemicellulose resulting in liquors rich in XOS. A high recovery of XOS with minimal co-production of degradation products was obtained under high initial pressures of CO2 and short holding times. Besides the production of value-added XOS, the obtained processed materials rich in cellulose and can be used in saccharification and lignin conversion processes towards other value-added commodities.

Acknowledgements

This work was supported by the Fundação para a Ciência e a Tecnologia (FCT, Portugal) through Bilateral Cooperation project FCT/CAPES 2014/2015 (FCT/1909/27/2/2014/S) and grants SFRH/BD/94297/2013 (ARCM) and IF/00424/2013 (RBL). The work was also supported by CAPES (Brazil) though the Pesquisador Visitante Especial 155/2012. Authors also wish to thank Mrs Maria do Céu Penedo for help in the execution of the HPLC analysis.

References

  1. J. H. Moon, J. W. Lee and U. D. Lee, Bioresour. Technol., 2011, 102, 9550–9557 CrossRef CAS PubMed.
  2. V. L. Budarin, P. S. Shuttleworth, J. R. Dodson, A. J. Hunt, B. Lanigan, R. Marriott, K. J. Milkowski, A. J. Wilson, S. W. Breeden, J. J. Fan, E. H. K. Sin and J. H. Clark, Energy Environ. Sci., 2011, 4, 471–479 CAS.
  3. M. Galbe and G. Zacchi, Appl. Microbiol. Biotechnol., 2002, 59, 618–628 CrossRef CAS PubMed.
  4. L. C. Duarte, M. P. Esteves, F. Carvalheiro and F. M. Gírio, Biotechnol. J., 2007, 2, 1556–1563 CrossRef CAS PubMed.
  5. F. Carvalheiro, T. Silva-Fernandes, L. C. Duarte and F. M. Gírio, Appl. Biochem. Biotechnol., 2009, 153, 84–93 CrossRef CAS PubMed.
  6. S. Kumar and J. Gomes, Anim. Feed Sci. Technol., 2008, 144, 149–166 CrossRef CAS PubMed.
  7. D. Bilalis, N. Sidiras, G. Economou and C. Vakali, J. Agron. Crop Sci., 2003, 189, 233–241 CrossRef.
  8. I. Deniz, H. Kirci and S. Ates, Ind. Crops Prod., 2004, 19, 237–243 CrossRef CAS PubMed.
  9. S. Kim and B. E. Dale, Biomass Bioenergy, 2004, 26, 361–375 CrossRef PubMed.
  10. D. Montane, X. Farriol, J. Salvado, P. Jollez and E. Chornet, J. Wood Chem. Technol., 1998, 18, 171–191 CrossRef CAS PubMed.
  11. A. U. Buranov and G. Mazza, Ind. Crops Prod., 2008, 28, 237–259 CrossRef CAS PubMed.
  12. V. Menon and M. Rao, Prog. Energy Combust. Sci., 2012, 38, 522–550 CrossRef CAS PubMed.
  13. N. Mosier, C. Wyman, B. Dale, R. Elander, Y. Y. Lee, M. Holtzapple and M. Ladisch, Bioresour. Technol., 2005, 96, 673–686 CrossRef CAS PubMed.
  14. R. Alinia, S. Zabihi, F. Esmaeilzadeh and J. F. Kalajahi, Biosyst. Eng., 2010, 107, 61–66 CrossRef PubMed.
  15. V. Ferreira-Leitao, C. C. Perrone, J. Rodrigues, A. P. M. Franke, S. Macrelli and G. Zacchi, Biotechnol. Biofuels, 2010, 3, 7 CrossRef PubMed.
  16. K. Gairola and I. Smirnova, Bioresour. Technol., 2012, 123, 592–598 CrossRef CAS PubMed.
  17. J. S. Luterbacher, J. W. Tester and L. P. Walker, Biotechnol. Bioeng., 2010, 107, 451–460 CrossRef CAS PubMed.
  18. R. L. Orozco, M. D. Redwood, G. A. Leeke, A. Bahari, R. C. D. Santos and L. E. Macaskie, Int. J. Hydrogen Energy, 2012, 37, 6545–6553 CrossRef CAS PubMed.
  19. A. R. C. Morais, A. M. da Costa Lopes and R. Bogel-Lukasik, Chem. Rev., 2015, 115, 3–27 CrossRef CAS PubMed.
  20. S. X. Wu, H. L. Fan, Y. Xie, Y. Cheng, Q. A. Wang, Z. F. Zhang and B. X. Han, Green Chem., 2010, 12, 1215–1219 RSC.
  21. N. Narayanaswamy, A. Faik, D. J. Goetz and T. Y. Gu, Bioresour. Technol., 2011, 102, 6995–7000 CrossRef CAS PubMed.
  22. Y. Sun and J. Cheng, Bioresour. Technol., 2002, 83, 1–11 CrossRef CAS.
  23. G. P. van Walsum, Appl. Biochem. Biotechnol., 2001, 91–93, 317–329 CrossRef CAS.
  24. T. Miyazawa and T. Funazukuri, Biotechnol. Prog., 2005, 21, 1782–1785 CrossRef CAS PubMed.
  25. S. P. Magalhães da Silva, A. R. C. Morais and R. Bogel-Lukasik, Green Chem., 2014, 16, 238–246 RSC.
  26. A. R. C. Morais, A. C. Mata and R. Bogel-Lukasik, Green Chem., 2014, 16, 4312–4322 RSC.
  27. F. M. Relvas, A. R. C. Morais and R. Bogel-Lukasik, J. Supercrit. Fluids, 2015, 99, 95–102 CrossRef CAS PubMed.
  28. R. P. Overend, E. Chornet and J. A. Gascoigne, Philos. Trans. R. Soc., A, 1987, 321, 523–536 CrossRef CAS.
  29. D. Peng and D. B. Robinson, Ind. Eng. Chem., 1976, 15, 59–64 CAS.
  30. Z. H. Duan and R. Sun, Chem. Geol., 2003, 193, 257–271 CrossRef CAS.
  31. O. Pfohl, S. Petkov and G. Brunner, PE V2.9.9a – Software for Phase Equilibria Calculations, Technische Universitat Hamburg-Harburg, Hamburg, Germany, 1998 Search PubMed.
  32. L. C. Duarte, F. Carvalheiro, S. Lopes, S. Marques, J. C. Parajo and F. M. Girio, Appl. Biochem. Biotechnol., 2004, 113, 1041–1058 CrossRef.
  33. B. L. Browning, in Methods in Wood Chemistry, ed. K. V. Sarkanen and C. H. Ludwig, John Wiley & Sons, New York, 1967, pp. 795–798 Search PubMed.
  34. A. Sluiter, B. Hames, R. Ruiz, C. Scarlata, J. Sluiter and D. Templeton, Determination of Sugars, Byproducts, and Degradation Products in Liquid Fraction Process Samples - Laboratory Analytical Procedure (LAP), National Renewable Energy Laboratory – NREL, Colorado 80401–3393, 2006, http://www.nrel.gov/biomass/analytical_procedures.html Search PubMed.
  35. F. G. Hurtubise and H. Krässig, Anal. Chem., 1960, 32, 177–181 CrossRef CAS.
  36. T. M. C. Hoang, E. R. H. van Eck, W. P. Bula, J. G. E. Gardeniers, L. Lefferts and K. Seshan, Green Chem., 2015, 17, 959–972 RSC.
  37. S. Peleteiro, A. M. da Costa Lopes, G. Garrote, J. C. Parajo and R. Bogel-Lukasik, Ind. Eng. Chem. Res., 2015 DOI:10.1020/acs.iecr.1025b01771.
  38. H. Rasmussen, H. R. Sorensen and A. S. Meyer, Carbohydr. Res., 2014, 385, 45–57 CrossRef CAS PubMed.
  39. A. V. Carvalho, A. M. da Costa Lopes and R. Bogel-Lukasik, RSC Adv., 2015, 5, 47153–47164 RSC.
  40. D. Fengel and G. Wegener, Wood: chemistry, ultrastructure, reactions, de Gruyter, New York, NY, USA, 1983 Search PubMed.
  41. C. G. Liu and C. E. Wyman, Ind. Eng. Chem. Res., 2003, 42, 5409–5416 CrossRef CAS.
  42. M. H. Sipponen, V. Pihlajaniemi, S. Sipponen, O. Pastinen and S. Laakso, RSC Adv., 2014, 4, 23177–23184 RSC.
  43. G. P. van Walsum and H. Shi, Bioresour. Technol., 2004, 93, 217–226 CrossRef CAS PubMed.
  44. J. Bian, F. Peng, X. P. Peng, X. Xiao, P. Peng, F. Xu and R. C. Sun, Carbohydr. Polym., 2014, 100, 211–217 CrossRef CAS PubMed.
  45. G. Cheng, P. Varanasi, C. L. Li, H. B. Liu, Y. B. Menichenko, B. A. Simmons, M. S. Kent and S. Singh, Biomacromolecules, 2011, 12, 933–941 CrossRef CAS PubMed.
  46. H. D. Zhang and S. B. Wu, Bioresour. Technol., 2013, 149, 546–550 CrossRef CAS PubMed.
  47. L. V. A. Gurgel, M. T. B. Pimenta and A. A. da Silva Curvelo, Ind. Crops Prod., 2014, 57, 141–149 CrossRef CAS PubMed.
  48. P. Moniz, H. Pereira, T. Quilho and F. Carvalheiro, Ind. Crops Prod., 2013, 50, 145–153 CrossRef CAS PubMed.
  49. F. Carvalheiro, M. P. Esteves, J. C. Parajo, H. Pereira and F. M. Girio, Bioresour. Technol., 2004, 91, 93–100 CrossRef CAS.
  50. R. C. McWilliams and G. P. van Walsum, Appl. Biochem. Biotechnol., 2002, 98, 109–121 CrossRef.
  51. A. Guenther, Atmos. Chem. Phys., 2007, 7, 4327 CrossRef CAS.
  52. D. Ciolacu, F. Ciolacu and V. I. Popa, Cellul. Chem. Technol., 2011, 45, 13–21 CAS.

Footnote

The authors wish it to be known that the first two authors should be regarded as joint first authors.

This journal is © The Royal Society of Chemistry 2015
Click here to see how this site uses Cookies. View our privacy policy here.