Corrosion inhibition of mild steel by an imidazolium ionic liquid compound: the effect of pH and surface pre-corrosion

Dongrui Yanga, Mingzhen Zhanga, Jie Zhenga and Homero Castaneda*b
aDepartment of Chemical and Biomolecular Engineering, The University of Akron, Ohio 44325, USA
bDepartment of Materials Science & Engineering, Texas A & M University, Texas 77843, USA. E-mail: hcastaneda@tamu.edu; Tel: +1 979 458 9844

Received 22nd July 2015 , Accepted 29th October 2015

First published on 29th October 2015


Abstract

The corrosion inhibition performance of 1-decyl-3-methylimidazolium chloride (DMICL) on mild steel was investigated in a carbon dioxide-saturated NaCl solution at pH 3.8 and 6.8. Electrochemical and surface analysis techniques were used to characterize the corrosion process in blank and inhibiting solutions. Open circuit potential, polarization curves and impedance spectroscopy were recorded to analyze the inhibition behavior of DMICL for specimens with a well-polished surface and a pre-corroded surface. Scanning electron microscopy images showed that the specimen surfaces were well protected from uniform corrosion in the inhibition solution. The energy dispersive spectroscopy and X-ray photoelectron spectroscopy data indicated the presence of specific elements following a dissolution mechanism under different pH conditions. The electrochemical fitting data facilitated calculations of inhibition efficiency and accounted for the interfacial changes.

1. Introduction

Chemical inhibition is widely used for corrosion prevention in the oil and gas industry.1 The efficiency of imidazolium derivatives as corrosion inhibitors – especially in response to carbon dioxide corrosion – is well known; these heterocyclic compounds can be adsorbed onto a metallic surface to form a barrier that inhibits the transport of species between the surface and the corrosive environment. This increases the charge transfer resistance and most likely changes the interface reaction process.2–8 Imidazolium ionic liquids with a carbon chain are typical examples of these compounds; the aromatic ring is generally believed to provide bonding between molecules and the metallic surfaces, while the carbon chain tail forms a hydrophobic film that heightens the effect of surface coverage and protection.8–16

Ionic liquids are traditionally well known as environmentally friendly solvents, and are representative component of green chemistry and clean industrial technology. They can be used for chemical synthesis, reaction catalytic processes, gas handling, electrochemistry, fuel cells, etc. Ionic liquids with heteroatoms and/or aromatic rings are potentially attractive corrosion inhibitors because of unique properties such as high stability, non-toxicity and negligible vapor pressure.17–19 Ionic liquids have recently attracted considerable attention for their usage as corrosion inhibitors.8–16 Pérez-Navarrete et al. synthesized seven ionic liquids and studied their inhibition effect on carbon steel in sulphuric acid; all of these compounds showed good inhibition effects as cathodic type inhibitors, and it was suggested that these chemicals could be absorbed on the steel surface to block active sites.9 The study from Zhou et al. showed the corrosion of carbon steel in alkaline chloride solution could be reduced upon the addition of the 1-butyl-3-methylimidazolium tetrafluoroborate ionic liquid.10 Olivares-Xometl et al. studied the anticorrosion properties of three ionic liquids showing as a mixed type corrosion inhibitor in sulfuric and hydrochloric acid.11 Yousefi et al. investigated the inhibition performance of several cationic ionic liquids and their mixtures with an anionic surfactant, and it was found that the formation of a three-dimensional hydrogen bond network between imidazolium rings and their counter ions effect the corrosion of mild steel in hydrochloride solution.8 In our previous work, we reported pre-screening tests to characterize the corrosion inhibition effect of several imidazolium ionic liquids. We found that the length of the carbon chain regulates the inhibition properties, and 1-decyl-3-methylimidazolium chloride could be used as a corrosion inhibitor in carbon dioxide-saturated sodium chloride solution.12

The aim of this work is not only to conduct a detailed research on 1-decyl-3-methylimidazolium chloride ionic liquid as corrosion inhibitor, but also to investigate the influence of pH values on the inhibition performance, and the behavior of the inhibitor on fresh-polished and precorroded surface. Corrosion inhibition behaviors are generally investigated using electrochemical techniques and surface analysis methods. DC-based electrochemical techniques such as polarization curves have been used to study the metal corrosion and inhibition efficiencies of chemicals for many years. AC-based techniques such as electrochemical impedance spectroscopy (EIS) are most frequently used when the elements of an interface are characterized separately, and the wide frequency range allows the detection and characterization of interfacial phenomena occurring at different frequencies. An additional advantage of EIS is the physical representation of electrochemical interfaces by electrical analog elements; the concepts from electrical circuit theory can be applied in the analysis of impedance data. Therefore, the mechanisms leading to corrosion and inhibition can be characterized, quantified and monitored using these techniques.

In this study, the corrosion inhibition performance of 1-decyl-3-methylimidazolium chloride (DMICL) on API X52 carbon steel specimens in a CO2 environment at room temperature was characterized using both electrochemical and surface analysis techniques. The influence of a 12 hour pre-corrosion on the inhibitor performance at pH 3.8 and 6.8 was investigated using specimens with well-polished surface and pre-corroded surface (PCS). The interface evolution during immersion in the blank and inhibiting solutions was characterized by electrochemical techniques, and the surface morphologies and product component were studied with scanning electron microscopy (SEM), energy dispersive spectroscopy (EDS) and X-ray photoelectron spectroscopic (XPS). The electrochemical parameters obtained from the best fitting of the electrochemical data using an equivalent analog circuit helped account for the interfacial changes.

2. Experimental

2.1. Materials and experimental setup

The test materials were API 5L X52 cylindrical coupons (1.2 cm outer diameter, 0.6 cm inner diameter, and 0.8 cm height). The selected X52 steel coupons had the following composition (wt%): 0.16% C, 1.07% Mn, 0.012% P, 0.004% S, 0.23% Si, 0.14% Cu, 0.07% Cr, 0.001% Ca, 0.020% V, 0.026% Al, 0.0003% B, 0.03% Mo, 0.002% Ti, and 0.09% Ni, with the balance being Fe. The ionic liquid 1-decyl-3-methylimidazolium chloride (C14H27ClN2, 96%) was supplied by Sigma-Aldrich.

Electrochemical tests were performed in a 150 ml glass cell with a water jacket for rotating cylinder electrodes (a 12 mm outer diameter) at 500 rpm in the 3.5% sodium chloride solution. Carbon dioxide was supplied continuously into the solution to keep the electrolyte solution fully saturated. The water circulation maintained the glass cell system at 25 °C, and the desired pH 6.8 was achieved by adding sodium bicarbonate (NaHCO3). At room temperature, the CO2 saturation produced a pH of 3.8. Small pH increases to 4.00 ± 0.05 and 7.00 ± 0.05 were observed after 25 hours of immersion. The steel specimen was ground using 800-grit silicon carbide paper. The grinding products were removed with distilled water and acetone, and the specimen was then washed with ethanol and dried before immersion in the solution. At the end of each experiment, the specimen was removed from the cell and rinsed with ethanol. It was then allowed to dry and was kept in a desiccator for surface analysis.

Three approaches were used to study the corrosion process—all of which were performed in the presence and absence of DMICL. The experimental procedure for each condition is described below:

(a) Corrosion behavior of specimens in blank solutions: carbon dioxide was bubbled into the solution for one hour, and then the specimen was fitted onto the rotator shaft, immersed in the blank solution, and rotated at 500 rpm, followed by electrochemical measurements.

(b) Corrosion inhibition of specimens with a freshly polished surface (FPS): carbon dioxide was bubbled into the solution for one hour, and then DMICL was weighed and added to reach a concentration of 2 mM. After that, the specimen was immersed in the solution and rotated at 500 rpm, followed by electrochemical measurements.

(c) Corrosion inhibition of specimens with a pre-corroded surface (PCS): carbon dioxide was bubbled into the solution for one hour, and then the specimen was immersed in the solution for 12 hours rotating at 500 rpm. The DMICL was then weighed and added at a final concentration of 2 mM, followed by electrochemical measurements.

2.2. Electrochemical measurements

The electrochemical measurements were performed using a potentiostat (SI 1280B, Solartron, UK) with an Ag/AgCl/KCl (saturated) reference electrode and a graphite rod as the counter electrode. The open circuit potential (OCP) was measured for 60 minutes prior to the electrochemical tests. The EIS was performed under a sinusoidal excitation potential of 10 mV amplitude in a frequency range of 10 kHz to 10 mHz. The potentials were recorded during the immersion time, and EIS was performed every 30 min. Potentiodynamic polarization curve measurements were conducted from −400 mV to +400 mV vs. OCP at a scan rate of 0.1667 mV s−1.

2.3. Surface analysis

Scanning electron microscopy (SEM) and energy dispersive spectroscopy (EDS) were measured and recorded using a scanning electron microscope (TM3000, Hitachi, Japan). The X-ray photoelectron spectroscopic (XPS) measurements were performed with a VersaProbe II Scanning XPS Microprobe from Physical Electronics (PHI) using a monochromatic (Al Kα) X-ray beam (E = 1486.6 eV). Automated dual beam charge neutralization was used to provide more accurate data. The analyzer pass energy was 117.4 eV. All measurements were conducted under ultrahigh vacuum conditions (2 × 10⁻⁶ Pa). Atomic concentrations were calculated with PHI MultiPak software. After 12 h of immersion in the blank or inhibition solution at 298 K, the samples were rinsed with ethanol and deionized water before drying with air.

3. Results and discussion

3.1. Open circuit potential measurements

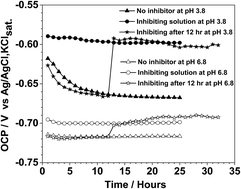
OCP measurements were used to monitor the corrosion process of the samples during immersion. In the blank testing solution, the OCP decreased during the initial stages of immersion and then remained stable, as shown in Fig. 1. At pH 3.8, the addition of the imidazolium ionic liquid caused an increase of approximately 80 mV in the OCP. Similarly, a shift of OCP to less negative values occurred at pH 6.8. The OCP at pH 6.8 were more negative than the ones at pH 3.8, which might be attributed to the formation of the Fe(OH)ads intermediate, a process that is generally believed to be the first step in the iron dissolution process and is easier at relatively high pH.20 This initial decrease has been reported to result from the dissolution process of the thin oxide film on the metal surface formed before immersion.21–23
image file: c5ra14556b-f1.tif
Fig. 1 Open circuit potential in function of time in the blank solution and in the inhibiting solution with inhibitor addition before specimen immersion and after an immersion time of 12 hours at pH 3.8 and pH 6.8.

It has been proven that a potential shift could be caused by the surface inhibitor layer.22,23 The formation of the inhibitor film has been investigated experimentally24–27 and theoretically.28–38 Tan et al. proposed that a multi-layered structure with an inhibitor-metal complex inner layer and many outer layers of inhibitor molecules is formed by imidazolium compounds with C16–C18 chains.24 Jovancicevic et al. proposed a bilayer/multilayer film model formed by imidazolines and their precursors in a carbon dioxide-containing environment.25 Zhang et al. studied an imidazolium derivative and suggested that the inhibitor film is a bilayer molecular structure on the steel surface in a CO2-saturated NaCl solution.26 Lopez et al. studied the performance of three imidazoline-like inhibitors on CO2 corrosion in a deoxygenated 5% NaCl solution, and demonstrated that inhibitors with a long hydrocarbon chain led to the formation of a molecular array structure; the bilayer model was the most thermodynamically stable under those conditions.27 Zhang et al. found that imidazoline compounds formed a self-assembled monolayer on a metallic surface in which the hydrophilic groups (–COOH, –OH, –NH2) showed different influences on the molecular reactivity and binding strength between the molecular and iron surfaces.29

3.2. Polarization curve measurements

The potentiodynamic polarization measurements for the steel specimen with different surface conditions were performed in the blank and inhibiting solutions. The corrosion current density (jcorr) was determined by extrapolation from the cathodic polarization curves and zero-current corrosion potential (Ecorr), a method that was suggested and employed in a previous study for plots with only one well-defined Tafel region.39,40 The inhibition efficiencies (IE) based on the jcorr were calculated using eqn (1):
 
image file: c5ra14556b-t1.tif(1)
where jcorr,b and jcorr,i are the corrosion current densities obtained from the blank and inhibiting solutions, respectively. The obtained results are shown in Table 1, which clearly demonstrates that DMICL inhibited the corrosion process by reducing the corrosion current densities.
Table 1 Electrochemical parameters and inhibitor efficiency obtained from the polarization curves for the steel specimen with freshly polished and precorroded surface with and without DMICL at pH 3.8 and 6.8
  Inhibiting time/hours pH 3.8 pH 6.8
Ecorr/mV jcorr/μA IE/% Ecorr/mV jcorr/μA IE/%
Freshly polished surface NA (blank) −656.5 137.4   −715.3 58.1  
2 −605.1 4.7 96.6 −679.1 10.1 82.6
12 −582.1 2.5 98.2 −666.4 9.1 84.3
Precorroded surface NA (blank) −674.4 136.1   −716.1 31.8  
2 −580.4 69.1 49.7 −663.8 10.3 67.6
12 −591.1 15.2 88.9 −649.7 4.5 85.8


At both pH 3.8 and 6.8, the presence of DMICL resulted in a significant decrease in the jcorr values. As shown in Fig. 2, both the cathodic and anodic current density plots decreased, indicating that the inhibitor affected both the anodic and cathodic processes. The same trends were observed for Ecorr and Eocp; thus, the corrosion potentials for the specimen in the inhibiting solutions were higher than those for the specimen in the blank solution at both pH 3.8 and 6.8.


image file: c5ra14556b-f2.tif
Fig. 2 Polarization curves for the specimens with freshly polished surface (FPS) and pre-corroded surface (PCS) in the blank solution and in the inhibiting solution with inhibiting time of 2 hours (a and c) and 12 hours (b and d) at pH 3.8 and pH 6.8.

As indicated by the jcorr values in Table 1, the inhibition effect of DMICL was influenced by the pre-corrosion process. Compared with PCS in the inhibiting solution at pH 3.8, a remarkably smaller corrosion current density for the FPS was detected. In other words, the pre-corrosion process significantly decreased the inhibition efficiency of DMICL under low pH conditions. For the FPS, DMICL demonstrated higher inhibition efficiency in acid solutions than under near-neutral conditions containing chloride ions. At pH 6.8, for a short inhibiting time (2 hours), the values of jcorr for FPS and PCS were similar; however, for long inhibiting time (12 hours), the pre-corrosion process at experimental conditions appeared to promote the corrosion inhibition effects of DMICL. This is in accordance with the results of the AC impedance measurements.

For a longer inhibition time (12 hours), as shown in Table 1, the corrosion potentials remained almost the same as was observed with 2 hours of inhibition; however, the current density for both the FPS and PCS decreased, most likely indicating that the inhibitor layer became denser and more effective with time. As discussed in previous studies, the inhibiting solution with a high inhibitor concentration exhibits better inhibition efficiency and a longer reaching-to-balance time than a solution with a low inhibitor concentration.12

3.3. Electrochemical impedance measurements

3.3.1. Inhibition performance at pH 3.8. Fig. 3a shows the impedance Nyquist plots of the specimen exposure in the blank solution for 25 hours at pH 3.8. These plots show well-defined semicircles in the high (HF) and medium (MF) frequency ranges, followed by an inductive loop in the low frequency (LF) range. The inductive loop has been associated with the adsorption of intermediate products on the metal surface, such as OH, HCO3, and Cl.41–43 After a slight initial increase, the magnitude of the capacitive loop in the complex diagram decreased with time. The impedance loop in the LF range is usually associated with surface preferential metallic dissolution for pipeline-grade steel samples; and the decreasing behavior might be related to the microgalvanic cells that are formed between cementite and ferrite phases, resulting in the selective dissolution of ferrite.44 The cementite contained in the pearlite could form preferential cathodic sites, causing a galvanic effect that enhances the corrosion of the ferrite phase. Additionally, over time, increased surface area is available for the cathodic reaction, and the presence of residual cementite also results in a higher corrosion rate for mild steel at room temperature.45
image file: c5ra14556b-f3.tif
Fig. 3 Impedance Nyquist plots evolution results for the specimen at pH 3.8 in the blank solution (a) and in the inhibiting solution with inhibitor addition before specimen immersion (b) and after 12 hours (c) immersion time.

The impedance spectrum for the FPS steel specimen in the inhibiting solution at pH 3.8 is presented in Fig. 3b. The first noticeable difference between the impedance plots obtained with the blank (Fig. 3a) and inhibiting solutions (Fig. 3b) is the remarkable increase in the magnitude of the diameters of the impedance Nyquist plots in the inhibiting solution. The diameter of the impedance plots loop increased with time over the entire course of the experiment. Another characteristic is the disappearance of the inductive semicircle at low frequencies. This is strong evidence for the formation of an inhibitor film on the steel surface, which isolates the specimen from various species in the electrolyte and impedes the adsorption process.

In order to study the inhibition performance of DMICL on a PCS, the inhibitor was added to the solution after 12 hours of immersion. Comparing the impedance results shown in Fig. 5b and c, it appears that the inhibitor had a greater effect on the clean surface than the PCS. This behavior is most likely to related to the accumulation of Fe3C and/or the intricate structures on a corroded surface.45,46 Mora-Mendoza45 found that cetyl trimethyl ammonium bromide showed better performance with the minimum amount of pre-corrosion time because the selective dissolution of ferrite leaves behind a Fe3C structure, causing a cathodic area increase and a potential gradient that prevents positively charged amine ions from reaching all anodic sites, consequently resulting in higher corrosion rates. Additionally, the negative effect of pre-corrosion might also be related to (a) the different adsorption properties between DMICL and surface structures/compounds and (b) the intricate structure of a corroded surface, which make it more difficult for DMICL to access the active sites and displace water molecule.46


image file: c5ra14556b-f4.tif
Fig. 4 Impedance Nyquist plots of evolution results of the specimen steel at pH 6.8 in blank solution (a) and in the inhibiting solution with inhibitor addition before specimen immersion (b) and after 12 hours (c) immersion time.

image file: c5ra14556b-f5.tif
Fig. 5 Electrochemical equivalent circuits used for simulation of impedance data obtained from the blank solution (a) and the inhibiting solution (b).
3.3.2. Inhibition performance at pH 6.8. At pH 6.8, the diameter of the impedance circles slightly increased during the immersion in the blank solution, as demonstrated in Fig. 4a, in contrast to the observations at pH 3.8. This behavior might be due to the accumulation of surface corrosion products. It has been reported that ferrous carbonate can be formed at pH 6.5, 25 °C, and 1 atm.45,47,48 The formation of iron oxides and hydroxides is also possible under these experimental conditions. As shown in Fig. 4b, the magnitude of the impedance loops for the specimen with a FPS in the inhibiting solution at pH 6.8 increased with time, but the increase was not as significant as it was at pH 3.8. These plots show depressed semicircles, which are attributed to the dispersion effect caused by surface irregularities and heterogeneities.49

In contrast to the effect at pH 3.8 that DMICL showed better anti-corrosion property on the FPS than the PCS, the experimental results for the specimen at pH 6.8 showed an opposite pattern. The diameter of the impedance semicircle for the specimen with a PCS increased at a faster rate and had a much larger magnitude than that of the FPS specimen, as shown in Fig. 6b and c. This indicates that the interaction between DMICL and the corrosion products (or surface metal structure) at pH 6.8 helped inhibit the charge transfer process, which is in agreement with the conclusion obtained from the polarization curve results. It has been proposed that the interaction of the imidazole ring on ferrous carbonate is stronger than its interaction on a steel surface due to the different polarities and adsorption energies of Fe and FeCO3.50,51 More imidazolium molecules might remain at the surface and inside the corrosion products film, contributing to a more effective inhibitor layer. Malik48 also reported that in a CO2-saturated brine at pH 6.5 and 23 °C, FeCO3 forms on a steel surface; with the C16 quaternary amine, an improved inhibition property was obtained with increasing pre-corrosion.


image file: c5ra14556b-f6.tif
Fig. 6 The Rct values obtained from EIS data fitting for the specimen with fresh polished surface (FPS) and pre-corroded surface (PCS) in blank solution and in the inhibiting solution at pH 3.8 and pH 6.8.
3.3.3. Equivalent circuits analogs. The impedance data were analyzed using the equivalent circuit analog shown in Fig. 5, which was previously explained and applied by Zhang and Cheng et al.26,41 In this representation of the interface, Rs is the solution resistance, whereas Rct is the charge transfer resistance; the inductive resistance (RL) and inductance (L) were introduced, as shown in Fig. 5a, to simulate the inductive loop that arose from the adsorbed intermediate products in the absence of inhibitor. In the equivalent circuit for the inhibiting solution shown in Fig. 5b, Cf describes the capacitance of the inhibitor film, and Rpore is the solution resistance in the pore of the inhibitor film.

In both circuits, a constant phase element (CPE) was employed to describe the interfacial characteristics due to the influence of the double layer capacitance; its impedance is described by the following expression:

 
image file: c5ra14556b-t2.tif(2)

The double layer capacitance (Cdl) associated with CPE was calculated according to eqn (3).52

 
image file: c5ra14556b-t3.tif(3)

When n = 1, Qdl has units of capacitance. In actual experimental conditions, the values of n are between 0 and 1 due to the influence of different factors such as electrode roughness, surface heterogeneity, and the dielectric constant.53

The inhibitor efficiency (Eff) was calculated based on the charge transfer resistance, as shown below:

 
image file: c5ra14556b-t4.tif(4)
where Rct,i and R′′ct,b are the fitted Rct values for the specimen in the inhibiting solution and the blank solution, respectively.

The electrochemical parameters and inhibition efficiencies obtained from the fitting of the experimental impedance data in the blank and inhibiting solutions at pH 3.8 and pH 6.8 are listed in Table 2. In the inhibiting solution, the Rct values increased with time, as shown in Table 2, indicating that higher inhibition efficiencies were obtained with time. Our previous studies demonstrated that Rct values can show different changing trends with inhibiting time during specimen immersion in different inhibitor concentrations.12 While Rct increases with time, the values for capacitance (Cdl and Cf) decrease. The decreasing behavior of Qdl values, which corresponds to each specific surface condition, would be more obvious if we consider the influence from the roughness parameter n. The decrease of capacitance may be due to several reasons. In a process where an increasing number of inhibitor molecules are adsorbed on the specimen surface, the active area decreased. Furthermore, the water molecules on the steel surface are replaced by inhibitors, and the latter have a lower dielectric constant. Additionally, the decrement of Cdl might also indicate a change in the thickness of the evolving layer.49

Table 2 Parameters obtained from the best fitting of the experimental data for the specimen in the blank solution and in the inhibiting solution at pH 3.8 and pH 6.8
pH Conc./mM Time/h Rs/Ω cm2 Rct/Ω cm2 Rpore/Ω cm2 Cf/μF cm−2 CPE Eff/%
Cdl/μF cm−2 n
3.8 0 2 7.08 202     209.0 0.840  
2 2 7.03 2500 14.3 8.1 22.3 0.780 91.9
5 6.91 5799 14.5 6.5 22.0 0.811 96.5
10 6.82 8376 15.8 6.0 21.6 0.814 97.6
15 6.71 9927 16.5 5.8 21.0 0.820 98.0
20 6.12 11[thin space (1/6-em)]751 14.1 5.8 21.1 0.824 98.3
25 6.05 13[thin space (1/6-em)]235 13.8 5.7 21.0 0.830 98.5
6.8 0 2 6.41 213     171.3 0.810  
2 2 6.12 1725 1.8 23.4 24.9 0.644 87.7
5 6.12 1806 2.1 33.2 24.7 0.649 88.2
10 6.18 2036 2.3 34.7 24.1 0.649 89.5
15 6.26 2407 2.6 33.8 22.2 0.649 91.2
20 6.23 2641 2.7 32.7 21.0 0.649 91.9
25 6.30 2822 2.7 32.3 20.7 0.651 92.5


For the inhibiting solution, the increase of Rct at pH 3.8 was remarkably larger than that observed at pH 6.8, as shown in Fig. 6. These differences might be related to the molecular properties of the imidazolium structure under different pH conditions, such as the molecular stability and charge distributions on the aromatic ring. In view of the acidic hydrogen and nitrogen heteroatom in the imidazolium ring, it is possible that the hydrogen ions influence the charge distribution or the molecule existent conformation.54–56 It appears that the inhibitor film formed at pH 3.8 is higher in quality than the one formed at pH 6.8. The smaller Cf and larger Rpore for the specimen with a FPS at pH 3.8 compared with that found at pH 6.8 might indicate that the inhibitor film formed at pH 3.8 is thicker and more compact than the one formed at pH 6.8.

As shown in Fig. 6, the surface conditions clearly influenced the Rct values, which demonstrated different patterns at pH 3.8 compared with pH 6.8. At pH 3.8, Rct for the FPS showed the largest increase, whereas Rct was smaller in the case for PCS with 12 hours of pre-corrosion time. However, at pH 6.8, Rct for the PCS specimen was larger than the values for the specimen with a FPS.

The calculated inhibitor efficiencies for the specimens with different surface conditions at pH 3.8 and pH 6.8 are shown in Fig. 7. At pH 3.8, the inhibiting efficiency was higher for the specimen with the FPS, whereas at pH 6.8, the efficiency was higher for the specimen with the PCS. At pH 3.8, the Eff values for the FPS specimen, which increased from 91.9% to 98.5% in 25 hours, were much higher than that of the PCS specimen. In contrast, at pH 6.8, the specimen with a PCS showed a much higher final Eff (97.6%) than the specimen with a FPS (92.5%). At pH 6.8, corrosion products were present on the surface and caused an increase of the resistance in the blank solution, as shown in Fig. 6. The accumulated surface species at pH 6.8 could likely enhance the interaction between the substrate and inhibitor film, whereas the existence of the surface inhibitor film could impede this accumulation. It has been proposed that inhibitors could delay the precipitation of corrosion products due to the mass transfer barrier caused by the surface film.48 This explanation is probably the reason that at pH 6.8, Eff for the specimen with a PCS was higher than that for the specimen with a FPS.


image file: c5ra14556b-f7.tif
Fig. 7 The calculated inhibitor efficiency for the specimen with fresh polished surface (FPS) and pre-corroded surface (PCS) in the inhibiting solution at pH 3.8 and pH 6.8.

Corrosion inhibitors are highly-selective to materials and environments; the adsorption of corrosion inhibitors on metal surface in practical applications can be complex. The interactions between inhibition and metal in aqueous environment may include: (1) the chemical adsorption of inhibitor molecules on a metal surface through p-electron interactions between the conjugated structure and metal surface enables the formation of feedback coordinate bonds; (2) the cooperative effect of anions and inhibitors could improve the adsorption process and anticorrosion effect, and (3) the repulsion between water and the hydrophobic carbon chain tail facilitates the adsorption of the hydrophilic head.

3.4. Surface analysis

Fig. 8 shows the SEM images of the well-polished specimens after immersion for 24 hours in the blank solution or a solution with 2 mM DMICL at both pH 3.8 and pH 6.8. The steel specimens in the blank solution were uniformly corroded at both pH 3.8 and 6.8. However, it should be noted that the corrosion morphologies at pH 3.8 and 6.8 were different, as shown in Fig. 1a and c. This is most likely due to the fact that corrosion under low pH conditions is mainly a dissolution process of the iron matrix, whereas at high pH, the Fe dissolution process is accompanied by the accumulation of complex corrosion products. For the specimens in the blank solution, the polishing lines on the metal surface disappeared due to the corrosion process. However, in sharp contrast, the specimens in the DMICL inhibiting solution were well protected from uniform corrosion.
image file: c5ra14556b-f8.tif
Fig. 8 SEM photos of the steel specimen surface with immersion time of 24 hours: in blank solution at pH 3.8 (a); in the inhibiting solution at pH 3.8 (b);12 in the blank solution at pH 6.8 (c); in the inhibiting solution at pH 6.8 (d).

Fig. 9 presents the XPS survey spectra for the steel specimens with different treatments. The survey spectrum in Fig. 9 for the fresh-polished metal surface shows only peaks from Fe, O and C. The N1s signals are present on the surfaces of specimens treated in both the blank and the inhibiting solution. It is quite possible that the nitrogen could be introduced to surface layer from the immersion corrosion process and specimen storage in atmosphere. It should be noted that for some of the duplicate experiments for 3.8-b and 6.8-b specimens, the nitric signal is not present. The spectrum with nitric signal for 3.8-b and 6.8-b are presented here to illustrate the difference in nitric signals for specimens in blank and inhibiting tests. As shown in the enlarged view of spectrum for N1s in Fig. 9, the nitric signal for specimens treated with the inhibitor is 0.6 eV higher than the signal for samples in blank testing; the former spectrums are also wider than the latter. This observation indicated that the nitric signal of the 3.8-i and 6.8-i are from – or partly from – the imidazolium compound.


image file: c5ra14556b-f9.tif
Fig. 9 The XPS survey spectra of a fresh-polished surface (FP) and the ones exposed in the blank (3.8-b and 6.8-b) and inhibition (3.8-i and 6.8-i) solution at pH 3.8 and 6.8 for 12 hours.

Another noticeable differences of spectrums for 3.8-b, 6.8-b and FP is the existence of the signal for copper: 932.6 eV for Cu 2p3/2 and 952.5 eV for Cu 2p1/2. Similarly, in the EDS spectra in Fig. 10, the signal of copper appeared in the data from 3.8-b and 6.8-b specimens, and this is in sharp contrast to those for FP, 3.8-i and 6.8-i. These signals provided strong evidence that some elements from the carbon steel such as copper and manganese could be exposed and perhaps enriched on the metal surface during corrosion. This process as well as other effects, such as corrosion products accumulation, could give rise to the different inhibition effects for the inhibitors on fresh-polished and pre-corroded surface. Meanwhile, in both XPS and EDS spectrums, the plots for the specimens in inhibiting solution are more similar to the fresh-polished one than the ones in blank testing solution. This demonstrates the effectiveness of DMICL as a corrosion inhibitor.


image file: c5ra14556b-f10.tif
Fig. 10 The EDS spectra of the fresh-polished (FP) surface and the ones exposed in the blank (3.8-b and 6.8-b) and inhibiting (3.8-i and 6.8-i) solution at pH 3.8 and 6.8 for 12 hours.

The depth of investigation for EDS is in the micrometer magnitude; XPS is on the nanometer. It is interesting and significant to discuss the differences between the two techniques. In contrast to a firm and visible coating, the inhibitor film formed on metal surface in aqueous phase is generally believed to be no thicker than several molecular layer, i.e. nanometer-scale thickness. Therefore, XPS could be properly used to get the surface inhibitor layer information, and the EDS could provide the information regarding the surface oxidation and corrosion product layer.

For instance, compared to the XPS results, the EDS data show more Fe and less O. The atomic ratio (at%) of Fe in the EDS testing is 71.72 (FP), 42.25 (3.8-i), 69.7 (3.8-b), 45.07 (6.8-i) and 54.61 (6.8-b), while the corresponding values from XPS are 32.2, 14.9, 17.9, 16.7 and 10.9, respectively. The atomic ratio of O from EDS are 3.08 (FP), 3.17 (3.8-i), 5.45 (3.8-b), 10.13 (6.8-i) and 8.76 (6.8-b), while the values from XPS are 46.4, 36.1, 46.3, 33.9 and 45.2. Additionally, for the FP specimen, the EDS results clearly show the signal of manganese (0.97 at% in our test and 1.07 wt% in substrate), but no signal was found in XPS. This observation indicated the existence of the surface thin iron oxide layer covering the carbon steel substrate. This concurs with our conclusion about the initial OCP decrease resulting from the dissolution of the thin oxide film.

4. Conclusion

The DMICL ionic liquid showed good corrosion inhibition properties for the carbon steel specimen in the carbon dioxide-saturated NaCl solution at 25 °C. The microscope and surface analysis results demonstrated that the specimen could be well protected from uniform corrosion. The highest inhibition efficiency of DMICL on the specimen in the testing solution at pH 3.8 could reach 99% at 25 hours of inhibition. The calculated inhibition efficiency showed that the inhibitor film formed on fresh-polished surface at pH 3.8 had a higher inhibition performance than that formed at pH 6.8.

DMICL influences both the anodic and cathodic processes during corrosion, and significantly decreases the corrosion current density at both pH 3.8 and 6.8. The corrosion potential shifted to the noble direction in the inhibiting solution at both pH values.

The charge transfer resistance for the specimen in inhibiting solution obtained from the fitting of impedance significantly increased due to the imidazolium inhibitors. The fitting results using equivalent analogs agreed well with the experimental data and helped account for the interfacial evolution. The parameters found via the model showed that at higher pH, the formation of corrosion products on the surface compromised the electronic transfer and increased the resistance.

The corrosion inhibition performance of DMICL was influenced by the surface conditions and pre-corrosion process of carbon steel. At pH 3.8, DMICL showed better inhibition effect for the specimen with a FPS than the PCS one. At pH 6.8, the inhibition efficiency (∼97.6%) at 25 hours of inhibition time for the specimen with PCS was higher than the one with FPS. This finding could be attributed to the exposure of other elements such as copper and manganese from the substrate and the accumulation of corrosion products at different pH values.

Acknowledgements

The authors would like to thank the SENER-CONACyT – hydrocarbons program for the financial support through project No. 159913.

References

  1. M. Finšgar and J. Jackson, Corros. Sci., 2014, 86, 17–41 CrossRef.
  2. D. A. López, W. H. Schreiner, S. R. de Sánchez and S. N. Simison, Appl. Surf. Sci., 2004, 236, 77–97 CrossRef.
  3. D. M. Ortega-Sotelo, J. G. Gonzalez-Rodriguez, M. A. Neri-Flores, M. Casales, L. Martinez and A. Martinez-Villafañe, J. Solid State Electrochem., 2011, 15, 1997–2004 CrossRef CAS.
  4. M. Heydari and M. Javidi, Corros. Sci., 2012, 61, 148–155 CrossRef CAS.
  5. P. C. Okafor, C. B. Liu, Y. J. Zhu and Y. G. Zheng, Ind. Eng. Chem. Res., 2011, 50, 7273–7281 CrossRef CAS.
  6. L. D. Paolinelli, B. Brown, S. N. Simison and S. Nesic, Mater. Chem. Phys., 2012, 136, 1092–1102 CrossRef CAS.
  7. I. Jevremović, M. Singer, S. Nešić and V. Miskovic-Stanković, Corros. Sci., 2013, 77, 265–272 CrossRef.
  8. A. Yousefi, S. Javadian, N. Dalir, J. Kakemam and J. Akbari, RSC Adv., 2015, 5, 11697–11713 RSC.
  9. J.-B. Pérez-Navarrete, C. O. Olivares-Xometl and N. V. Likhanova, J. Appl. Electrochem., 2010, 40, 1605–1617 CrossRef.
  10. X. Zhou, H. Yang and F. Wang, Electrochim. Acta, 2011, 56, 4268–4275 CrossRef CAS.
  11. O. Olivares-Xometl, C. López-Aguilar, P. Herrastí-González, N. V. Likhanova, I. Lijanova, R. Martínez-Palou and J. A. Rivera-Márquez, Ind. Eng. Chem. Res., 2014, 53, 9534–9543 CrossRef CAS.
  12. D. Yang, O. Rosas and H. Castaneda, in Corrosion 2014, San Antonio, TX, 2014, pp. 1–14 Search PubMed.
  13. T. Tüken, F. Demir, N. Kicir, G. Siĝircik and M. Erbil, Corros. Sci., 2012, 59, 110–118 CrossRef.
  14. H. Ashassi-Sorkhabi and M. Es'haghi, Mater. Chem. Phys., 2009, 114, 267–271 CrossRef CAS.
  15. X. Zheng, S. Zhang, W. Li, M. Gong and L. Yin, Corros. Sci., 2015, 95, 168–179 CrossRef CAS.
  16. Q. B. Zhang and Y. X. Hua, Electrochim. Acta, 2009, 54, 1881–1887 CrossRef CAS.
  17. U. Domańska, E. Bogel-Łukasik and R. Bogel-Łukasik, Chem.–Eur. J., 2003, 9, 3033–3041 CrossRef.
  18. H. L. Ngo, K. LeCompte, L. Hargens and A. B. McEwen, Thermochim. Acta, 2000, 357–358, 97–102 CrossRef CAS.
  19. C. P. Fredlake, J. M. Crosthwaite, D. G. Hert, S. N. V. K. Aki and J. F. Brennecke, J. Chem. Eng. Data, 2004, 49, 954–964 CrossRef CAS.
  20. L. Pikna, Z. Kovacova, M. Hezelova and L. Trnkova, J. Solid State Electrochem., 2013, 2687–2696 CrossRef CAS.
  21. J. M. Abd El Kader, A. A. El Warraky and A. M. Abd El Aziz, Br. Corros. J., 1998, 33, 139–144 CrossRef CAS.
  22. E. S. Ferreira, C. Giacomelli, F. C. Giacomelli and A. Spinelli, Mater. Chem. Phys., 2004, 83, 129–134 CrossRef CAS.
  23. M. A. Migahed, M. Abd-El-Raouf, A. M. Al-Sabagh and H. M. Abd-El-Bary, Electrochim. Acta, 2005, 50, 4683–4689 CrossRef CAS.
  24. Y. J. Tan, S. Bailey and B. Kinsella, Corros. Sci., 1996, 38, 1545–1561 CrossRef CAS.
  25. V. Jovancicevic, S. Ramachandran and P. Prince, Corrosion, 1999, 55, 449–455 CrossRef CAS.
  26. G. Zhang, C. Chen, M. Lu, C. Chai and Y. Wu, Mater. Chem. Phys., 2007, 105, 331–340 CrossRef CAS.
  27. D. A. López, S. N. Simison and S. R. de Sánchez, Corros. Sci., 2005, 47, 735–755 CrossRef.
  28. M. Mousavi, M. Mohammadalizadeh and A. Khosravan, Corros. Sci., 2011, 53, 3086–3091 CrossRef CAS.
  29. J. Zhang, G. Qiao, S. Hu, Y. Yan, Z. Ren and L. Yu, Corros. Sci., 2011, 53, 147–152 CrossRef CAS.
  30. L. M. Rodríguez-Valdez, W. Villamisar, M. Casales, J. G. González-Rodriguez, A. Martínez-Villafañe, L. Martinez and D. Glossman-Mitnik, Corros. Sci., 2006, 48, 4053–4064 CrossRef.
  31. M. Yadav, D. Behera and S. Kumar, Surf. Interface Anal., 2014, 46, 640–652 CrossRef CAS.
  32. E. E. Oguzie, Y. Li, S. G. Wang and F. Wang, RSC Adv., 2011, 1, 866–873 RSC.
  33. N. Soltani, M. Behpour, E. E. Oguzie, M. Mahluji and M. A. Ghasemzadeh, RSC Adv., 2015, 5, 11145–11162 RSC.
  34. S. John and A. Joseph, RSC Adv., 2012, 2, 9944–9951 RSC.
  35. L. C. Murulana, M. M. Kabanda and E. E. Ebenso, RSC Adv., 2015, 5, 28743–28761 RSC.
  36. B. Xu, Y. Ji, X. Zhang, X. Jin, W. Yang and Y. Chen, RSC Adv., 2015, 5, 56049–56059 RSC.
  37. A. Ehsani, M. G. Mahjani, R. Moshrefi, H. Mostaanzadeh and J. S. Shayeh, RSC Adv., 2014, 4, 20031–20037 RSC.
  38. S. Banerjee, A. Mishra, M. M. Singh, B. Maiti, B. Ray and P. Maiti, RSC Adv., 2011, 1, 199–210 RSC.
  39. E. McCafferty, Corros. Sci., 2005, 47, 3202–3215 CrossRef CAS.
  40. X. Liu, P. C. Okafor and Y. G. Zheng, Corros. Sci., 2009, 51, 744–751 CrossRef CAS.
  41. G. A. Zhang and Y. F. Cheng, Corros. Sci., 2009, 51, 1589–1595 CrossRef CAS.
  42. G. A. Zhang and Y. F. Cheng, Corros. Sci., 2009, 51, 87–94 CrossRef CAS.
  43. M. B. Valcarce and M. Vázquez, Electrochim. Acta, 2008, 53, 5007–5015 CrossRef CAS.
  44. H. Castaneda and M. Galicia, J. Solid State Electrochem., 2012, 16, 3045–3058 CrossRef CAS.
  45. J. L. Mora-mendoza and S. Turgoose, Corros. Sci., 2002, 44, 1223–1246 CrossRef CAS.
  46. L. D. Paolinelli, T. Pérez and S. N. Simison, Corros. Sci., 2008, 50, 2456–2464 CrossRef CAS.
  47. G. I. Ogundele and W. E. White, Corrosion, 1986, 42, 71–78 CrossRef CAS.
  48. H. Malik, Corrosion, 1995, 51, 321–328 CrossRef CAS.
  49. M. Özcan, J. Solid State Electrochem., 2008, 12, 1653–1661 CrossRef.
  50. J. Zhang, J. Liu, W. Yu, Y. Yan, L. You and L. Liu, Corros. Sci., 2010, 52, 2059–2065 CrossRef CAS.
  51. D. Yang, O. Rosas and H. Castaneda, Corros. Sci., 2014, 87, 40–50 CrossRef CAS.
  52. B. Hirschorn, M. E. Orazem, B. Tribollet, V. Vivier, I. Frateur and M. Musiani, Electrochim. Acta, 2010, 55, 6218–6227 CrossRef CAS.
  53. Z. Lukacs, J. Electroanal. Chem., 1999, 464, 68–75 CrossRef CAS.
  54. H. Walba and R. W. Isensee, J. Org. Chem., 1961, 26, 2789–2791 CrossRef CAS.
  55. J. O. Mendes, E. C. Da Silva and A. B. Rocha, Corros. Sci., 2012, 57, 254–259 CrossRef CAS.
  56. A. Kokalj, Corros. Sci., 2013, 68, 195–203 CrossRef CAS.

This journal is © The Royal Society of Chemistry 2015