
Compatibilizing action and localization of clay in a polypropylene/natural rubber (PP/NR) blend
Nithin Chandrana,
Sarath Chandrana,
Hanna J. Mariab and
Sabu Thomas*ab
aSchool of Chemical Sciences, Mahatma Gandhi University, Kottayam, Kerala, India. E-mail: sabuchathukulam@yahoo.co.uk; sabupolymer@yahoo.com
bInternational and Inter University Centre for Nanoscience and Nanotechnology, Mahatma Gandhi University, Kottayam, Kerala, India
First published on 30th September 2015
Abstract
The compatibilizing action of clay in polypropylene (PP)/natural rubber (NR) blends and its effect on mechanical properties have been investigated. PP/NR blend containing organically modified nanoclay, Cloisite 20A, was prepared by melt mixing method, using Haake rheocord-90. The blend composition was fixed at the ratio of 70/30 (PP/NR). By varying the filler loading, Cloisite 20A, mechanical properties (i.e.: tensile strength, elongation at break, Young's modulus and impact strength) showed a dramatic increase as compared to the unfilled 70/30 (PP/NR) reference blend, which is in agreement with morphological analysis carried out using transmission electron microscopy (TEM), scanning electron microscopy (SEM) and X-ray diffraction (XRD). The dispersed NR domain size was decreased linearly up to 3 μm with the addition of 5 phr of Cloisite 20A to PP/NR blend followed by a levelling off at higher concentrations of the clay addition indicating interfacial saturation. X-ray diffraction analysis and TEM images reveal an intercalated structure for all the compositions of PP/NR/clay nanocomposites. From high resolution TEM we have found that the clay predominantly localizes at the PP continuous phase and at the interface. This preferential localization of the clay has three important effects: (1) suppression of coalescence of the NR domains on account of the physical barrier exerted by the clay platelets, (2) decreased domain size of the dispersed NR phase due to the increased viscosity of the continuous PP phase on account of the localization of the clay in the PP phase (rheological reason). (3) Decrease of interfacial tension between PP an NR on account of the preferential localization of the clay at the blend interface. In fact the behaviour of the clay was analogous to the action of compatibilizers in binary polymer blends.
Introduction
There have been a large number of reports on the use of polymer blends and thermoplastic elastomers as matrices for the manufacture of nanocomposites in recent years.1 Thermoplastic elastomers (TPEs) belong to a class of material that combine the physical properties of thermoplastics and elastomers; they exhibit properties typical of rubbery materials and can be processed like thermoplastics. There are several articles reporting TPEs prepared from polymer blends such as LLDPE/NR2 PP/EPDM.3,4 Among them, polypropylene (PP)/natural rubber (NR) blends have prominence due to the high melting PP attaining dimensional stability at elevated temperatures and the low cost and abundant supply of NR. The traditional reinforcements and fillers must be used at high loading levels,5 which often increase the weight and cause an adverse effect in the automotive applications area, because 90% of the total energy used by an automobile during its life cycle is from fuel consumed due to its own weight. A small amount of nanofiller (2–5%) is generally sufficient to increase the stiffness of the material, and is thus cost-effective for automotive6 and packaging applications.7It is well known that nanofillers like clay can reduce particle sizes by lowering the interfacial tension, preventing particles from coalescing, and promoting adhesion between the two homopolymer phases, resulting in improved mechanical properties.8–10 Its presence refines the droplet size of the dispersed minor phase, stabilizes it against coalescence during melt-mixing, and ensures strong interfacial adhesion between the phases in the solid state, thus improving the final mechanical properties.
The use of organically modified layered silicate (OMLS) as an additive to improve the performance of pure polymers has been well established. The main reason for these improved properties in polymer/OMLS composites is the high surface area of the OMLS, which ensures high levels of interfacial interaction between the matrix and the OMLS as opposed to conventional composites.11 Recently, lot of attention has been focused on the possibility of using OMLS as a compatibilizer and as nanofiller for immiscible polymer blends.12–16
However the procedure of preparing polymer blend-clay nanocomposites, using polymer blend as a matrix, both unmodified and modified nanoclay has been successfully applied to only polar polymers (either, both of the polymer or at least one polymer polar in nature).17–19 Reports show that the localization of nanoclay depends on the relative polarity of the polymer matrix and the clay.20 Only very few works are found to be reported on the action of nanoclay in polymer blends where both the polymer components are non-polar in nature.21 Polypropylene is the best choice for blending with natural rubber due to its high softening temperature and crystalline nature which makes it versatile for a wide range of temperatures. One of the major challenges of blending NR with PP is the incompatibility of the system due to the non-polar nature of the individual components. Even though the chemical structure of NR and PP is nearly the same, the blends are incompatible and immiscible and this may be due to the high molecular weight of NR (Mw) as compared to PP as well as the high viscosity difference between NR and PP. Due to the non-polar characteristic, NR should be blended with PP in the presence of a compatibilizer because of the immiscible nature of this blend on account of the high viscosity difference between the polymer pairs. Incompatibility between NR and PP can be overcome by the introduction of compatibilizer that can induce interactions across the interface during blending. Compatibility is extremely important as it affects very strongly the morphology, mechanical and thermal properties of the blends.22,23
In this article we evaluate the effect of surface modified nanoclay, Cloisite 20A, on the morphology and ultimate properties of PP/NR blend. In particular we investigate the localization of the clay in the binary blend (PP, NR or at the interphase) and its effect on the morphology and mechanical properties. Earlier we had optimised 70/30 (PP/NR) system as the most suitable formulation for the manufacture of high performance automotive bumpers where PP forms the continuous phase in which the NR is dispersed as domains.
Experimental
Materials
The polypropylene (PP), isotactic homopolymer with the grade name of repol (H350FG) used in this study was supplied by Reliance Industries Limited, India, with a MFI of 38 g min−1 (230 °C/2.16 kg) and weight average molecular weight ∼530![[thin space (1/6-em)]](https://www.rsc.org/images/entities/char_2009.gif) 000 g mol−1. The natural rubber (NR) ISNR-5 with a density of 0.97 g cm−3, weight average molecular weight ∼780000 g mol−1, was supplied by Rubber Research Institute India (RRII) Kottayam, Kerala, India. The organically modified (2M2HT) nanoclay was Cloisite (20A), have modifier concentration of 95 meq./100 g clay with d spacing value of 24.2 Å was obtained from Southern Clay Products. Where HT is Hydrogenated Tallow (∼65% C18; ∼30% C16; ∼5% C14). The blend ratio used in this work is 70/30 PP/NR (wt/wt). The concentration of the clay was varied.
000 g mol−1. The natural rubber (NR) ISNR-5 with a density of 0.97 g cm−3, weight average molecular weight ∼780000 g mol−1, was supplied by Rubber Research Institute India (RRII) Kottayam, Kerala, India. The organically modified (2M2HT) nanoclay was Cloisite (20A), have modifier concentration of 95 meq./100 g clay with d spacing value of 24.2 Å was obtained from Southern Clay Products. Where HT is Hydrogenated Tallow (∼65% C18; ∼30% C16; ∼5% C14). The blend ratio used in this work is 70/30 PP/NR (wt/wt). The concentration of the clay was varied.
Preparation of nanocomposites
The PP/NR/clay nanocomposites were prepared by melt mixing in a Brabender Plasticorder. Prior to the mixing, the PP and the nanoclay were dried in vacuum at 80 °C for 6 h. For efficient mixing of the blend components, the high viscosity of NR was reduced by masticating NR for a period of 5 minutes in a two-roll mill with a nip clearance of 3 mm and a friction ratio of 1.25:1 (20/15 rpm, back roll/front roll). Then PP/NR was blended for 10 minutes. Subsequently the nanoclay was added and mixed for 5 more minutes. The processing parameters were fixed as the following: temperature of mixing 180 °C, screw speed at 50 rpm and mixing time 15 minutes. The processed materials were granulated and the samples for testing were stamped out from 2 mm thick sheets prepared by compression molding at 180 °C for 15 minutes.
Characterization
sinθ). Data were recorded between 2θ ranges of 0 to 20°. The scanning rate was fixed at 2 s per step. The composite specimens were analysed by X-ray diffraction using films of 2 mm thickness that were obtained by compression moulding at 180 °C.| Number-average domain diameter: Dn = ∑niDi/∑ni | (1) |
| Weight-average domain diameter: Dw = ∑niDi2/∑niDi. | (2) |
In these equations, ni is the number of domains having diameter Di.
The distribution of dispersed phase and its changes with filler loading was calculated using polydispersity index (PDI), which is the ratio of number average diameter and weight average diameter,25 interfacial area per unit volume and interparticle distance (IPD) using the following eqn (3)–(5) respectively and is tabulated in Table 1.
| Polydispersity index: PDI = Dw/Dn | (3) |
 | (4) |
 | (5) |
Results and discussion
Rheology
The complex viscosities of neat PP and their blends with and without clay are given in Fig. 1a and b.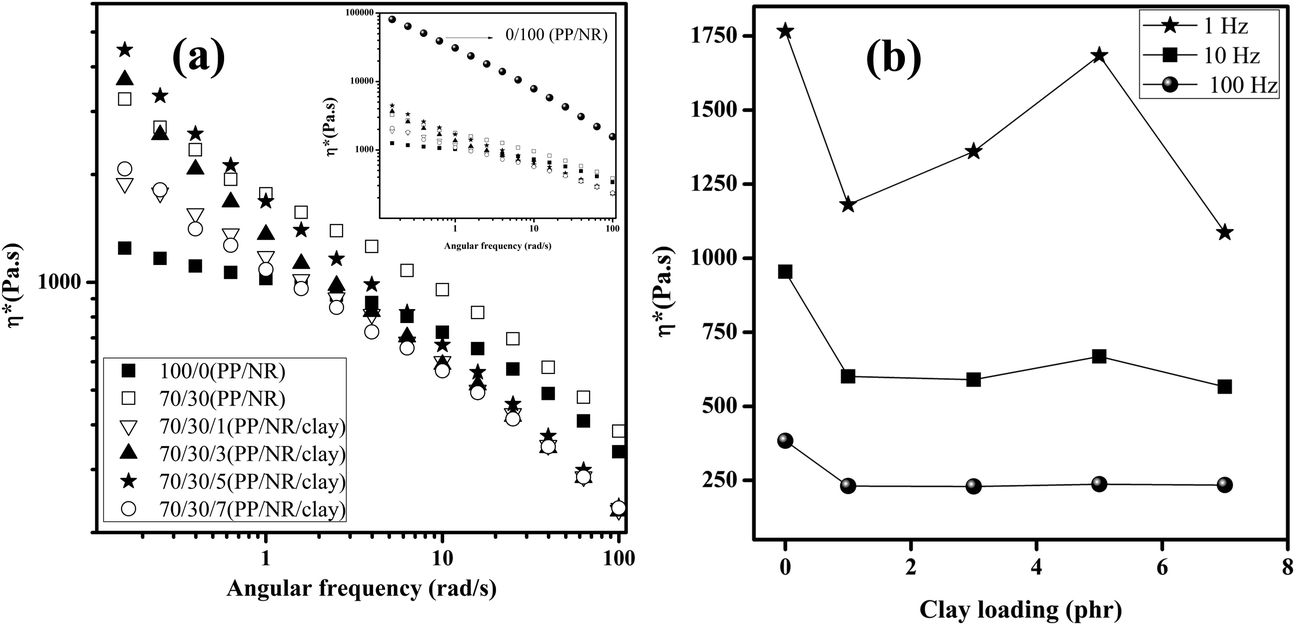 | ||
| Fig. 1 (a) Complex viscosity of PP/NR blend and nanocomposites. (b) The variation of complex viscosity with frequency. | ||
It can be seen that complex viscosity of NR is much higher than PP over the entire range of shear rate, Fig. 1a (inset). This is due to the high molar mass of NR (Mw ∼ 820000) as compared to PP. As expected, both polymers show pseudoplastic behaviour due to the orientation of the polymer chains in the direction of extrusion. When the viscous force becomes stronger, it is known that the domain size of a blend becomes smaller.26 With the addition of 30 wt% of NR to the PP, the viscosity increases drastically and the increase is very much predominant at low frequency region. This can be explained as being due to the build-up of a structure formation between the natural rubber particles in the PP matrix. A similar model was proposed by Münstedt et al.27 and later by Thomas et al.28 where they suggested the formation of a cell wall like structure through the interconnection of rubber particles. They proposed that this intact structure immobilize the rubber to a great extent. However, this structural formation is destroyed on applying stress. Here also, the tremendous increase in viscosity for the 70/30 PP/NR blend and it subsequent decrease on applying high shear can be explained to be due to the formation of a cell wall like structure and its breakage on applying shear. High shear rate separates the rubber particles from each other resulting in the decrease of complex viscosity. A schematic representation of this phenomenon is given in Fig. 2a.
 | ||
| Fig. 2 Schematic representation showing effect of clay loading on the 70/30 PP/NR blend nanocomposites: (a) NR clusters at low and high shear rate and (b) effect of clay layers as breakage of clusters at lower loading, formation of network structure and agglomeration at higher loading. | ||
Here in PP/NR clay nanocomposites, a further modification of this model is being proposed. On incorporating nanoclay into the PP/NR matrix, by the presence of the nanoclay layers the rubber particles are separated from each other resulting in the distortion of the cell wall like structure. The lower viscosity of the clay nanocomposites compared to the pure 70/30 PP/NR blend can be explained to be due to this structural alteration.
On increasing the clay loading to 3 phr, the clay tends to form a network throughout the matrix which causes an increase in the complex viscosity. The complex viscosity was further increased to a maximum value for the blend nanocomposites due to the strong network formation at 5 phr filler loading. Further addition of clay to 7 phr results in a decrease in the complex viscosity as the clay particles get agglomerated at higher concentrations. A schematic explanation for the suggested mechanism is represented in Fig. 2b, where it explains the separation of rubber particles by the presence of nanoclay and network formation at higher clay loading.
Morphological studies
The morphological features of the PP/NR (70/30) blend and their nanocomposites were studied using scanning electron microscopy and transmission electron microscopy. The ultimate properties of the blends can be controlled by tuning the morphology.29,30 The SEM images of PP/NR blend (70/30) and their nanocomposites are displayed in Fig. 3. The images reveal droplet morphology for the uniformly distributed NR particles. The holes indicate the position of the toluene extracted NR phase in the PP matrix. Similar results were reported by B. Kuriakose et al.31 and Nithin et al.32 It is obvious from the images that the size of the dispersed NR domains reduced systematically upon the addition of Cloisite 20A loading (Fig. 3a–e). Fig. 4 shows the domain size reduction of dispersed NR as a function of clay loading. On the increasing concentration of the nanoclay, up to 5 phr, the domain size of the dispersed NR phase decreased dramatically. Further addition showed a levelling off of the domain size. This curve is very similar to the emulsification graphs reported for the compatibilizing action of graft and block copolymers in immiscible polymer blends.33 | ||
| Fig. 3 SEM micrographs of PP/NR/Cloisite 20A nanocomposites where NR phase has been preferentially extracted by toluene: (a) 70/30/0, (b) 70/30/1, (c) 70/30/3, (d) 70/30/5 and (e) 70/30/7. | ||
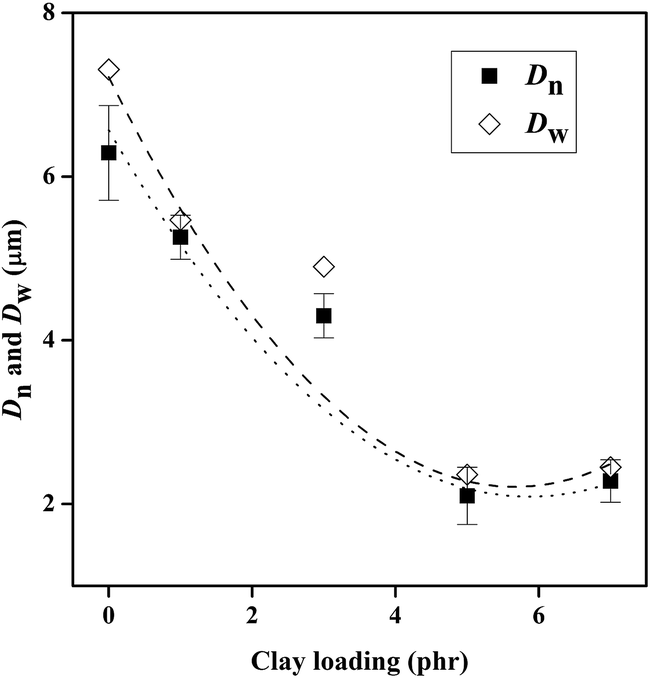 | ||
| Fig. 4 Graph showing the variation of Dn and Dw vs. clay loading. | ||
The process of the domain break-up and the equilibration process have been schematically shown in a cartoon as indicated in Fig. 2.
From the SEM results, it was confirmed that as the clay loading is increased the domain size decreases. The remarkable change in the size reduction reveals that organoclay plays a major role in reducing the size of dispersed NR phase in PP/NR blend. Similar phenomena were reported by Wang and Zhang et al.10 The PDI value was found to be decreased and finally levels off at high clay loading. The interfacial area was also increased, showing the increased surface area due to the decrease in domain size. These remarkable changes show the effect of organoclay in compatibilizing 70/30 PP/NR blend systems.
To further investigate the mechanism involved, TEM images were taken and are reported in Fig. 5. The dark phases represent high absorption, and light areas represent lower absorption.34 The intensity of the directed beam that solely contributes to the image contrast is reduced and such crystals appear relatively dark. The PP phase appears to be dark because of the high cohesive energy density and crystallinity which allows comparatively lower number of electrons to transmit through it, while the amorphous NR phase having comparatively lower cohesive energy density transmits more number of electrons which makes it lighter in color.
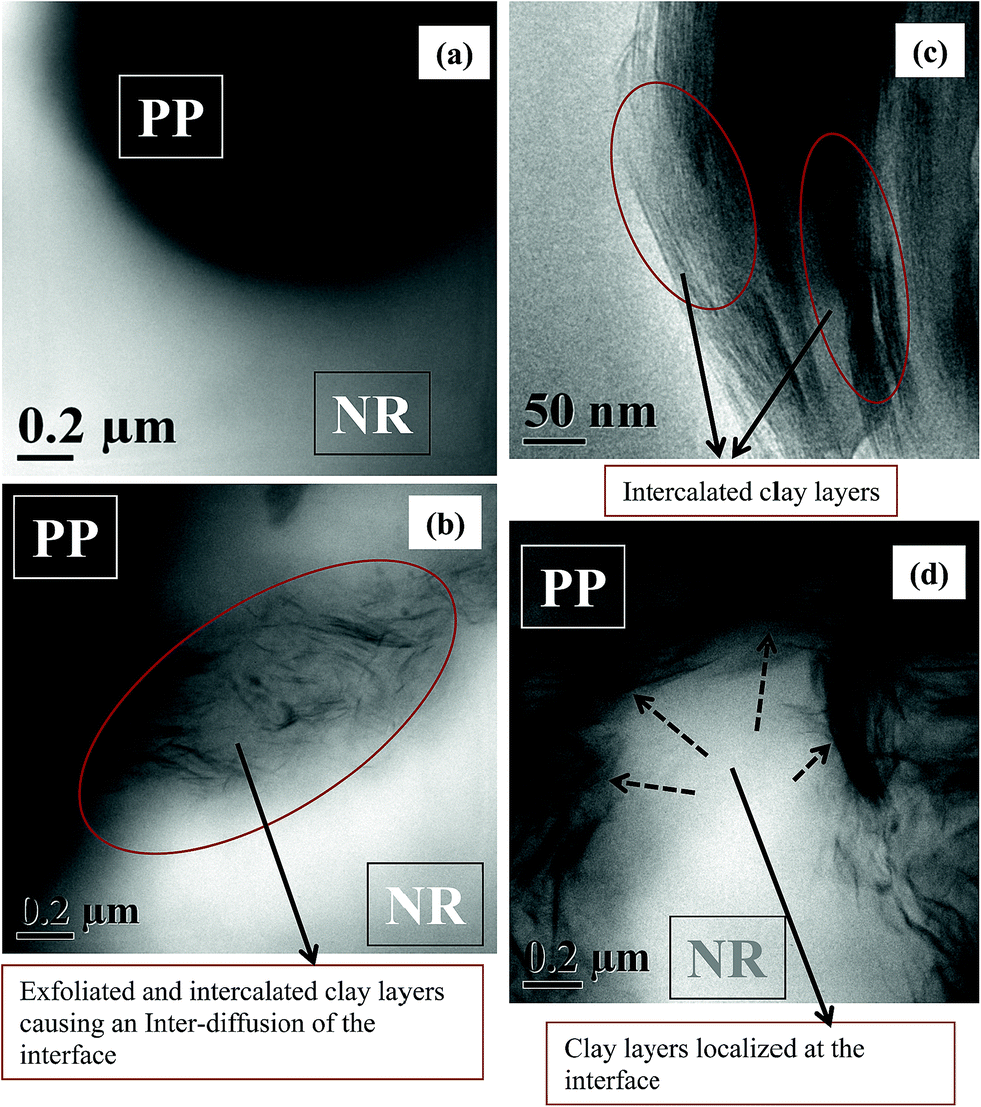 | ||
| Fig. 5 TEM micrographs of PP/NR/Cloisite 20-A nanocomposites: (a) PP/NR (70/30) blend; (b) exfoliated and intercalated clay layers causing an inter-diffusion of the interface; (c) intercalated clay layer structure and (d) localization of clay layers at the PP/NR interface. | ||
High resolution TEM studies indicate that clay is predominantly localized in the PP phase and a minor portion is localized at the interphase. The clay was found to be partially exfoliated and intercalated in the PP phase. This could have helped in the formation of a network like structure in the PP phase which acts as a physical cross linking leading to the increase in the PP matrix viscosity as explained earlier. A schematic representation showing the dispersed clay layers in the PP matrix is shown in Fig. 6.
 | ||
| Fig. 6 Schematic representation for dispersed clay structure. | ||
The interface saturation up on the addition of clay can be further explained based on Weber equation,35 which explains the change in dispersed domain size as function of shear rate, viscosity of the matrix and interfacial tension.
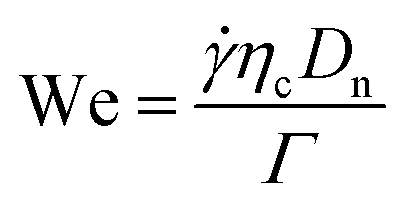 | (6) |
![[small gamma, Greek, dot above]](https://www.rsc.org/images/entities/i_char_e0a2.gif) is the shear rate, “ηc” is the matrix phase melt viscosity, Dn is the equilibrium dispersed phase droplet size and “Γ” is the interfacial tension between the two components. The equation explains that a high shear rate, higher melt viscosity of the matrix and a low interfacial tension can cause a reduction in the droplet size of the dispersed phase. The increased viscosity of the PP matrix due to the localization of nanoclay and its network formation, as confirmed from the TEM images (Fig. 5b) leads to the reduction of droplet size. The presence of clay at the interface contributes to the decrease in interfacial tension and a consequent decrease in domain size. From the TEM images it is clear that part of the clay particles get localized at the PP/NR interface (Fig. 5c), and the rest are intercalated and exfoliated in the PP matrix (Fig. 5d). Similar results have been observed by Martín et al.36,37 The inter diffusion of the interface as a result of this can be observed clearly from the TEM images (Fig. 5b). The prevention of coalescence by the physical network of the nanoclay also aids in compatibilizing the blends. This network makes a barrier around the dispersed phase and thus suppresses the coalescence of the NR domains.
is the shear rate, “ηc” is the matrix phase melt viscosity, Dn is the equilibrium dispersed phase droplet size and “Γ” is the interfacial tension between the two components. The equation explains that a high shear rate, higher melt viscosity of the matrix and a low interfacial tension can cause a reduction in the droplet size of the dispersed phase. The increased viscosity of the PP matrix due to the localization of nanoclay and its network formation, as confirmed from the TEM images (Fig. 5b) leads to the reduction of droplet size. The presence of clay at the interface contributes to the decrease in interfacial tension and a consequent decrease in domain size. From the TEM images it is clear that part of the clay particles get localized at the PP/NR interface (Fig. 5c), and the rest are intercalated and exfoliated in the PP matrix (Fig. 5d). Similar results have been observed by Martín et al.36,37 The inter diffusion of the interface as a result of this can be observed clearly from the TEM images (Fig. 5b). The prevention of coalescence by the physical network of the nanoclay also aids in compatibilizing the blends. This network makes a barrier around the dispersed phase and thus suppresses the coalescence of the NR domains.
A further explanation on the mechanism of clay localization and its effect on filler loadings are explained through a schematic diagram Fig. 7. Here, the change in correlation length (ξclay) and the average length of the dispersed clay (Lclay) layers are analyzed from the TEM images using image j software and is tabulated in Table 2. The correlation length of the dispersed nanoclay was found to be maximum for 1 phr of nanoclay loading (44 nm). This suggests that the nanocomposite with 1 phr of clay has maximum dispersion with partially exfoliated structure in the blend matrix. With the increase of clay loading, for 3, 5, and 7 phr, the correlation distance decreases to 33, 27 and 18 nm respectively. The increase in the average length of the dispersed clay layers show that as the clay loading is increased the clay particle gets aligned over so as to increase the effective length of the clay, (Fig. 7a). However, at higher loading due to the stacking of clay layers the correlation length decreases, Fig. 7b. In a similar study Okamoto et al.38 reported that the clay particles are located in the amorphous region of polypropylene. Here also from the XRD data (as discussed in next section), the d spacing of the PP phase is not affected by the clay loading which points out that localization of clay particles may have taken place in the amorphous region of the polypropylene.
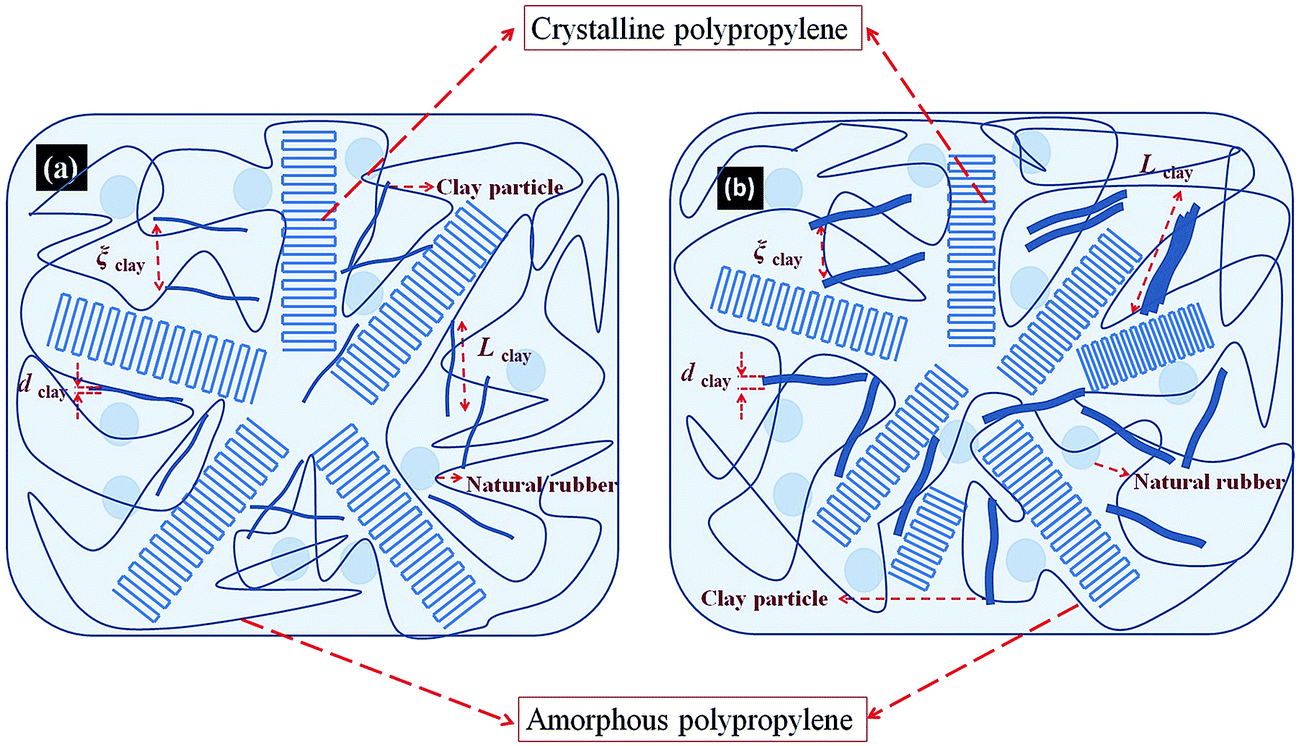 | ||
| Fig. 7 Schematic representation of the dispersion and localization of nanoclay (a) PP/NR/clay (70/30/3) and (b) PP/NR/clay (70/30/7). | ||
X-ray diffraction analysis (XRD)
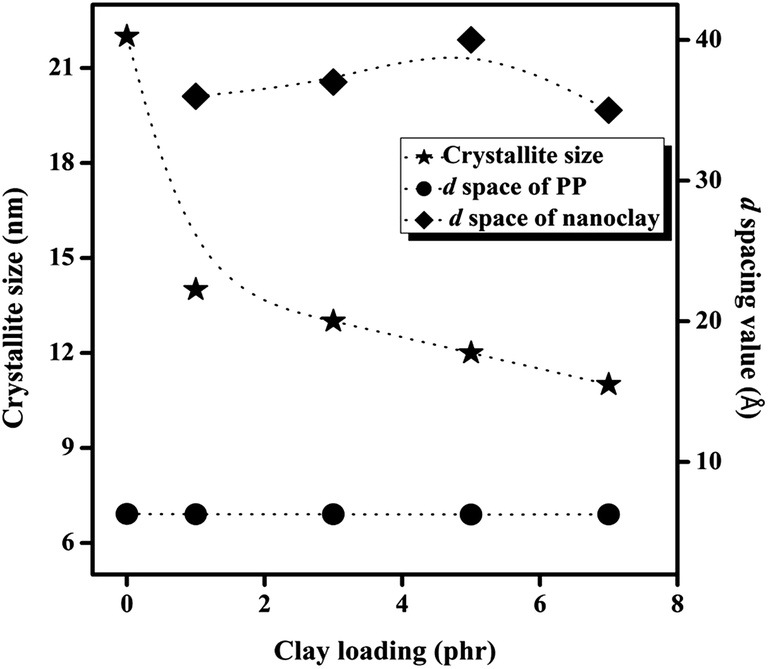
X-ray diffraction analysis was used to examine the type of dispersion of nanoclay in the blend matrix as well as the changes in crystal form of polypropylene with the presence of nanoclay. The XRD patterns of the nanocomposites and the neat clay are shown in Fig. 8. In the case of pure organoclay, a prominent peak appears at 2θ ≈ 5 which corresponds to a d-spacing value of 17.66 Å. The presence of four peaks between 14 and 20° can be explained by the crystalline structure of PP phase.39 The peaks at 14.09, 16.88, and 18.60 due to the (110), (040), and (130) planes are characteristics of α-type monoclinic crystal structures of PP chains. In all the nanocomposites, the clay diffraction peaks are shifted to lower angles suggesting intercalated structure. The shift to lower value of 2θ indicates an expansion of basal spacing, which suggests penetration of polymer chains within the gallery space. In the case of PP/NR blend filled with 1, 3, 5 & 7 phr clay, peak obtained at 2θ ≈ 2.44 (36.17 Å), 2θ ≈ 2.34 (37.68 Å), 2θ ≈ 2.18 (40.49 Å) and 2θ ≈ 2.46 (35.95 Å) respectively corresponding to the (001) plane of the stacked and intercalated sheets of clay which is accompanied by the appearance of very small peak at 2θ ≈ 7 due to the (002) plane of the stacked clay dispersed in the PP/NR matrix. The characteristic peak of Cloisite 20A was shifted towards the smaller angle which gives a clear picture of the partially exfoliated structure. It is very important to note that the d spacing of the clay layers increases upto 5 phr of clay followed by an increase at higher clay content. This indicates that clay agglomerates at higher loading as observed from rheology and microscopic studies. Fig. 9 illustrates the change in crystallite size of polypropylene on adding nanoclay, which is calculated using Scherrer equation
 | (7) |
 | ||
| Fig. 8 XRD analysis of PP/NR/Cloisite 20A nanocomposites. | ||
 | ||
| Fig. 9 Crystallite size and d-spacing value of PP/NR/clay nanocomposites. | ||
The effect of clay loading on the d spacing values of polypropylene and nanoclay are also represented in the figure. From the it is obvious that the crystallite size of the PP dramatically decreased from 22 nm to 14 nm. This may due to the nucleating effect of nanoclay, which act as a barrier and block to the growth of PP crystallites. However, it is noticeable that with the addition of nanoclay, there is no such variation in the d spacing value of polypropylene. The d spacing value of nanoclay was found to be increasing systematically up to 5 phr of clay loading and shows the intercalation of clay layers.
Mechanical properties
The stress–strain curve of PP/NR/clay nanocomposites is given in Fig. 10. As can be seen, both the yield stress and elastic modulus of the PP/NR blend were increased with the incorporation of nanoclay. This endorses the reinforcement effect of nanoclay in the blend matrix. The reinforcing effectiveness of nanoclay in PP/NR is mainly dependent on its dispersion state in the matrix, as well as the interfacial interactions between the clay and the matrix. A greater extent of clay delamination increases the aspect ratio as well as the interfacial area of the dispersed clay phase, which allows the stress transfer from the matrix to the clay to be more effective. It is very clear from Fig. 10 that the addition of clay not only increased tensile strength and Young's modulus, but also increased elongation at break considerably. The tensile strength, elongation at break, and Young's modulus of the prepared PP/NR/Cloisite 20A nanocomposites were tabulated in Table 3.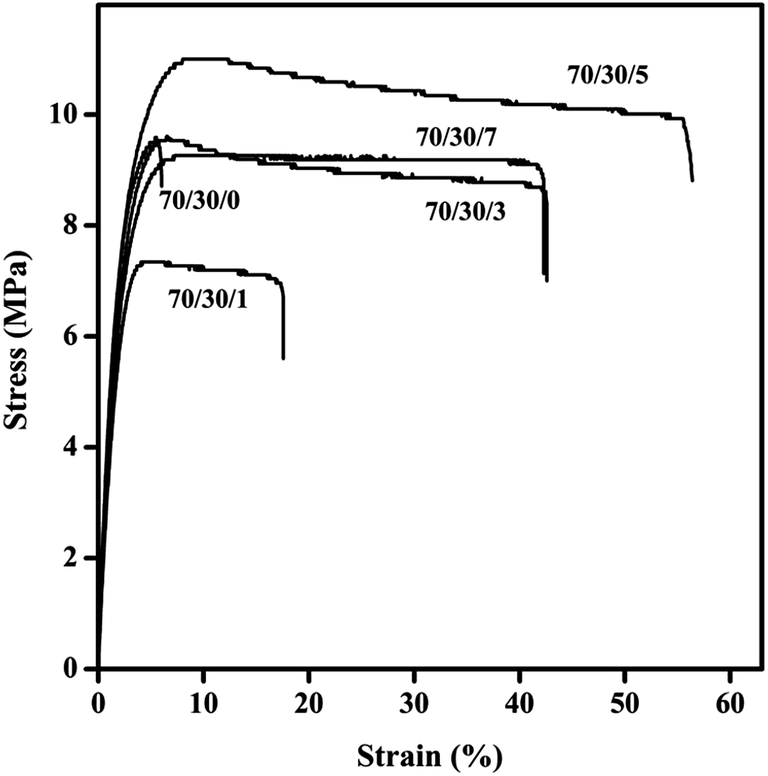 | ||
| Fig. 10 Stress–strain curves of PP/NR/clay nanocomposites. | ||
| Blend composition PP/NR | Cloisite 20A (phr) | Tensile strength (MPa) | Elongation at break (%) | Young's modulus (MPa) | Toughness (N m m−3) | Impact strength (J m−1) |
|---|---|---|---|---|---|---|
| 70/30 | 0 | 9.49 ± 0 0.01 | 6 ± 1.18 | 510 ± 26.89 | 29 | 75 |
| 70/30 | 1 | 7.34 ± 0.13 | 18 ± 0.65 | 424 ± 43.08 | 117 | 277 |
| 70/30 | 3 | 9.60 ± 1.15 | 43 ± 0.72 | 520 ± 82.73 | 365 | 361 |
| 70/30 | 5 | 11.00 ± 0.19 | 57 ± 0.52 | 604 ± 62.93 | 560 | 403 |
| 70/30 | 7 | 9.26 ± 0.33 | 42 ± 13.97 | 523 ± 41.72 | 363 | 319 |
The tensile strength of the nanocomposite depends on several factors, such as the dispersion of organoclay inside the PP/NR matrix, interaction of the clay with the matrix, compatibility of the PP phase and the NR phase of the PP/NR, and the filler–filler interactions. The increased tensile strength of the nanocomposite originates from the interaction of the polymer matrix and fillers. Intercalation of the polymer matrix inside the clay layers facilitates the polymer filler interaction. The high aspect ratio of organoclay also enhances the tensile strength of the nanocomposite by increasing the nanofiller contact surface area with the polymer matrix. It is also observed that the tensile strength of PP/NR/Cloisite 20A nanocomposites decreases with increased organoclay loading after attaining an optimum level, (up to 5 phr). This is because of the fact that as the filler concentration increases agglomeration among filler particles inside the polymer matrix also increases. This agglomeration results in a reduction of the organoclay aspect ratio, thereby decreasing the contact surface of the organoclay and the matrix polymer. However, the agglomeration of organoclay also induces a local stress concentration inside the nanocomposite; thus, during tensile deformation nanocomposites containing higher amounts of organoclay, deform in a brittle manner and show relatively lower tensile strength. The elongation at break of nanocomposites was found to be increasing with the clay loading. This result is contrary to much of the literature reports. Generally the addition of nanoclay enhances the tensile strength but decreases the elongation at break. We assume that the unusual increase in elongation at break with increasing clay content is due to the favourable interaction between NR and clay filler. The increasing the concentration of nanoclay up to 5 phr might lead to the breakdown of platelets and stacks and subsequent dispersion up on shearing action. Also alignment of the nanoclay during flow and some plasticizing action due to the presence of the long chain organic modifier in the clay might have contributed to an increase in elongation at break. Addition of nanoclay to the 70/30 blend shows significant change in impact strength. Impact strength and toughness are increasing with the clay loading systematically up to 5 phr clay loading followed by a decrease. The increase in impact strength may due to the presence of clay platelets, which allows the absorption of more energy during fracture, so the material impact strength rises. Additionally, the clay can induce cavitation of the rubber particles more effectively leading to an increase in impact strength. Other mechanisms such as crack stoppage, crack bifurcation, crack bridging and crack pinning by the clay platelets might be contributing to the increase in impact strength and toughness. We should also consider the contribution coming from the compatibilizing action of clay at the PP/NR interface. The compatibilizer, nanoclay localized in the blend matrix and at the interface improves the interfacial adhesion between PP and NR. This modified interface (thick, diffusive and strong) may undergo debonding cavitation to relieve the triaxial stress imposed by the plane strain constraint at the crack tip. The relaxation of the interface can prevent the matrix from premature brittle fracture during impact loading.40,41 The decrease in impact strength and toughness at higher clay content levels (>5 phr) is probably due to the formation of clay agglomeration and the presence of unexfoliated aggregates.42
Conclusion
The morphology and mechanical properties of the 70/30 PP/NR blend and its nanocomposites have been carefully investigated. It was found that the localization of intercalated clay platelets in the PP phase and at the interface could help in compatibilizing the polymer blend very effectively. There are three important factors which contribute to the compatibilization process: (1) localisation of the major part of the clay at the PP matrix phase contributes to the reduction rubber particles size due to the increased viscosity of the PP matrix phase (rheological reason). (2) Shielding effectiveness of clay platelets to suppress the coalescence of the NR rubber domains by acting as physical barriers. (3) Reduction of the interfacial tension due to the localisation of the clay at the interface between the NR and PP phase. The SEM results very clearly showed that the presence of nanoclay in the polymer blend could suppress the coalescences of NR domains. The size of the NR domains in the PP/NR/Cloisite 20A nanocomposites decreased with an increase in the nanoclay content upto 5 phr and levelling off at higher loading, which is a clear indication of interfacial saturation process which is very similar to the compatiblization of block copolymers in polymer blend interface. High resolution TEM images also revealed that nanocomposite with 5 phr of clay showed a good dispersion of clay particles. The TEM images further gave insight into the localisation of the clay at the PP phase and at the interface. We could also quantify the correlation distance and the length of the clay platelets as a function of clay loading which showed good agreement with the ultimate properties. The XRD results further supported the TEM results as the d spacing of the clay was maximum for 5 phr of clay loading showing a highly intercalated structure. Mechanical analysis of PP/NR/Cloisite 20A nanocomposites also showed substantial improvements in tensile strength, modulus toughness and impact properties with 5 phr clay loading followed by a decrease. The dramatic improvements in impact strength, toughness and elongation at break are associated with the increase cavitation of the rubber particles induced by the localised clay platelets at the blend interface; crack bridging, crack bifurcation and crack pinning by the clay platelets and also due to the orientation of the clay platelets. Finally, it is important to add that NR/PP/clay formulations are very good candidates of high impact applications where strength, modulus, elongation and toughness match very well.Acknowledgements
Thanks are due to KSCSTE, Trivandrum, India for the project funding and Nanomisison, DST, New Delhi for the TEM facilities.References
- Polymers in Confined Environments, ed. S. Granick, K. Binder, P.-G. Gennes, E. P. Giannelis, G. S. Grest, H. Hervet, R. Krishnamoorti, L. Léger, E. Manias, E. Raphaël and S.-Q. Wang, Springer Berlin Heidelberg, Berlin, Heidelberg, 1999, vol. 138 Search PubMed.
- S. Utara and P. Boochathum, Polym.–Plast. Technol. Eng., 2011, 50, 1019–1026 CrossRef CAS PubMed.
- A. V. Rane and V. K. Abitha, J. Mater. Environ. Sci., 2015, 6, 60–69 Search PubMed.
- P. Lima, J. Oliveira and V. Costa, J. Appl. Polym. Sci., 2014, 131, 40160 CrossRef PubMed.
- A. M. Youssef, A. El-Gendy and S. Kamel, Mater. Chem. Phys., 2015, 152, 26–33 CrossRef CAS PubMed.
- J. M. Garcés, D. J. Moll, J. Bicerano, R. Fibiger and D. G. McLeod, Adv. Mater., 2000, 12, 1835–1839 CrossRef.
- A. M. Youssef, Polym.–Plast. Technol. Eng., 2013, 52, 635–660 CrossRef CAS PubMed.
- B. B. Khatua, D. J. Lee, H. Y. Kim and J. K. Kim, Macromolecules, 2004, 37, 2454–2459 CrossRef CAS.
- J. S. Hong, Y. K. Kim, K. H. Ahn, S. J. Lee and C. Kim, Rheol. Acta, 2006, 46, 469–478 CrossRef.
- Y. Wang, Q. Zhang and Q. Fu, Macromol. Rapid Commun., 2003, 24, 231–235 CrossRef CAS PubMed.
- S. Sinha Ray and M. Okamoto, Prog. Polym. Sci., 2003, 28, 1539–1641 CrossRef PubMed.
- S. Sinha Ray, S. Pouliot, M. Bousmina and L. A. Utracki, Polymer, 2004, 45, 8403–8413 CrossRef PubMed.
- S. Wang, Y. Hu, L. Song, J. Liu, Z. Chen and W. Fan, J. Appl. Polym. Sci., 2004, 9, 1457–1462 CrossRef PubMed.
- M. Y. Gelfer, H. H. Song, L. Liu, B. S. Hsiao, B. Chu, M. Rafailovich, M. Si and V. Zaitsev, J. Polym. Sci., Part B: Polym. Phys., 2003, 41, 44–54 CrossRef CAS PubMed.
- D. Voulgaris and D. Petridis, Polymer, 2002, 43, 2213–2218 CrossRef CAS.
- H. Wang, C. Zeng, M. Elkovitch, L. J. Lee and K. W. Koelling, Polym. Eng. Sci., 2001, 41, 2036–2046 CAS.
- H. Zhao, Z. Cui, X. Wang, L.-S. Turng and X. Peng, Composites, Part B, 2013, 51, 79–91 CrossRef CAS PubMed.
- I. Labaume, J. Huitric, P. Médéric and T. Aubry, Polymer, 2013, 54, 3671–3679 CrossRef CAS PubMed.
- R. Iyer, S. Suin, N. K. Shrivastava, S. Maiti and B. B. Khatua, Polym.–Plast. Technol. Eng., 2013, 52, 514–524 CrossRef CAS PubMed.
- L. As'habi, S. H. Jafari, H. A. Khonakdar, B. Kretzschmar, U. Wagenknecht and G. Heinrich, J. Appl. Polym. Sci., 2013, 130, 749–758 CrossRef PubMed.
- C. Bendjaouahdou and S. Bensaad, Energy Procedia, 2013, 36, 574–590 CrossRef CAS PubMed.
- X. Xie, W. Bai, A. Wu, D. Chen, C. Xiong, C. Tang and X. Pang, J. Appl. Polym. Sci., 2015, 132, 41323 Search PubMed.
- M. Yousfi, S. Livi, A. Dumas, J. Crépin-Leblond, M. Greenhill-Hooper and J. Duchet-Rumeau, J. Appl. Polym. Sci., 2014, 131, 1–12 Search PubMed.
- M. R. Shahsavari, H. Mohammadian, A. Namjoo, Y. Saadat, S. Hosseinzadeh and S. Abdolbaghi, Colloid J., 2015, 77, 99–107 CrossRef CAS.
- Z. Li, C. Wu, K. Zhao, B. Peng and Z. Deng, Colloids Surf., A, 2015, 470, 80–91 CrossRef CAS PubMed.
- Y. Son, K. H. Ahn and K. Char, Polym. Eng. Sci., 2000, 40, 1376–1384 CAS.
- H. Münstedt, Polym. Eng. Sci., 1981, 21, 259–270 Search PubMed.
- A. T. Koshy, B. Kuriakose, S. Thomas, C. K. Premalatha and S. Varghese, J. Appl. Polym. Sci., 1993, 49, 901–912 CrossRef CAS PubMed.
- J. W. Lim, A. Hassan, A. R. Rahmat and M. U. Wahit, Polym.–Plast. Technol. Eng., 2008, 47, 411–419 CrossRef CAS PubMed.
- S. Jose, A. Aprem, B. Francis, M. Chandy, P. Werner, V. Alstaedt and S. Thomas, Eur. Polym. J., 2004, 40, 2105–2115 CrossRef CAS PubMed.
- B. Kuriakose, S. K. Chakraborty and S. K. De, Mater. Chem. Phys., 1985, 12, 157–170 CrossRef CAS.
- N. Chandran, R. Wilson and S. Thomas, Kautsch. Gummi Kunstst., 2013, 66, 18–22 CAS.
- C. L. Zhang, L. F. Feng, X. P. Gu, S. Hoppe and G. H. Hu, Polymer, 2007, 48, 5940–5949 CrossRef CAS PubMed.
- M. Si, T. Araki, H. Ade, A. L. D. Kilcoyne, R. Fisher, J. C. Sokolov and M. H. Rafailovich, Macromolecules, 2006, 39, 4793–4801 CrossRef CAS.
- S. Joseph, W. W. Focke and S. Thomas, Compos. Interfaces, 2010, 17, 175–196 CrossRef CAS PubMed.
- Z. Martín, I. Jim, A. G. Marian, M. West and A. P. Hitchcock, Macromolecules, 2011, 44, 2179–2189 CrossRef.
- Z. Martín, I. Jiménez, M. A. Gómez, H. Ade and D. A. Kilcoyne, Macromolecules, 2010, 43, 448–453 CrossRef.
- P. H. Nam, P. Maiti, M. Okamoto, T. Kotaka, N. Hasegawa and A. Usuki, Polymer, 2001, 42, 9633–9640 CrossRef CAS.
- W. L. IJdo and T. J. Pinnavaia, J. Solid State Chem., 1998, 139, 281–289 CrossRef CAS.
- Y. Li, G. X. Wei and H. J. Sue, J. Mater. Sci., 2002, 37, 2447–2459 CrossRef CAS.
- S. Wu, Polymer, 1985, 26, 1855–1863 CrossRef CAS.
- S. Shahbikian, P. J. Carreau, M.-C. Heuzey, M. D. Ellul, J. Cheng, P. Shirodkar and H. P. Nadella, Polym. Eng. Sci., 2012, 52, 309–322 CAS.
| This journal is © The Royal Society of Chemistry 2015 |