DOI:
10.1039/C5RA14148F
(Paper)
RSC Adv., 2015,
5, 104563-104573
A glowing antioxidant from tasar silk cocoon†
Received
17th July 2015
, Accepted 19th November 2015
First published on 23rd November 2015
Abstract
Oxidative stress is associated with a variety of disorders, diseases as well as the natural aging process thus making antioxidant discovery of medical relevance. In the present study, we report the simultaneous antioxidant as well as bio-imaging activities of a fluorescent extract (fluorophore) obtained from the tasar silk cocoons of the silk moth Antheraea mylitta. Using a nanocarrier-based strategy, we were able to localize the fluorophore in the cytosol of cardiomyoblast cell line H9c2 without any alterations to cellular morphology. In search of additional uses of the fluorophore beyond bio-imaging, we evaluated the antioxidant efficacies of the fluorophore against hydrogen peroxide-induced oxidative stress. Using microscopic, flow-cytometry and ELISA based studies; we observed that the silk fluorophore ameliorated hydrogen peroxide-induced reactive oxygen species (ROS) levels and oxidative stress. Moreover, enhanced levels of endogenous antioxidant enzymes were also observed in fluorophore pre-treated cells during oxidative stress. This resulted in significant reduction of oxidative stress-induced cell death. Our cumulative results suggest concomitant antioxidant and bio-imaging activities of the naturally occurring silk fluorophore. Given that a tasar silk fluorophore has never been isolated from cocoons in the silk textile industry, further commercial exploration will provide economic support to silk farmers.
Introduction
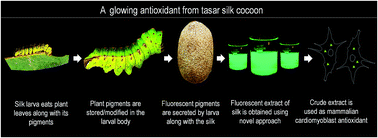
Over the years silkworm silk has obtained a prestigious position in the textile industry and recently in biomedical research.1,2 Apart from these sectors, this biomaterial possesses properties like carbon dioxide gating, thermo-regulation, a humidity barrier, photo-protection and bioelectricity generation.3–7 More recently a heavily nitrogen doped graphene material has been derived from the silk cocoon shell, which finds applications in bio-imaging and supercapacitor development.8,9 One interesting and commercially less explored feature of a silk cocoon is its inherent fluorescence rendered due to the presence of flavonoid and carotenoid compounds.10 These fluorescent compounds (Fig. 1) are believed to be silkworm gut modified products of the precursor compounds found in the leaf diet of silkworms.11–15 Recent studies have shown that these flavonoid derivatives provide UV shielding abilities to the cocoon.16 At present, these fluorophores are being wasted during silk processing in silk textile industry. The scientific and commercial exploitation of such natural compounds could open up new business avenues for this ancient industry.
 |
| Fig. 1 Silk fluorophore extracted from cocoons is the larval gut stored/modified version of plant pigments. Quercetin is found in the leaves of plants which are diet of wild silk larvae, such as Antheraea mylitta. | |
Recently, we reported a novel protocol for extraction of fluorophore from tasar silk cocoons of silk moth Antheraea mylitta.10 Previously, similar fluorescent compounds have been extracted from cocoons of Bombyx mori. Based on the reports these fluorophores consists higher concentrations of flavonoid quercetin and/or its glycoside derivatives.17–19 Quercetin and glycosylated quercetin are major representatives of flavonol subclass of flavonoids and represent 60–75% of dietary flavonoid intake of silkworm.20 Quercetin (3,3′,4′,5,7-pentahydroxyflavone) is a member of the bioflavonoids family and one of the most widely distributed dietary polyphenolic compounds in foods including red wine, apple, onion, grapefruit, tea, broccoli, spinach and beans.20,21 Several animal and human studies have provided evidence that quercetin possesses antioxidant, anti-atherogenic, anti-inflammatory, anti-coagulative, and anti-hypertensive properties.22–27 In general, an antioxidant works with either or combination of following mechanisms in order to reduce the oxidative stress. These three mechanisms are reduction of free radical, chelation of metal ion and stimulation of cellular endogenous antioxidants.28–30 Interestingly, there are reports that suggest quercetin has potential to follow all these mechanisms making it a very potent antioxidant.31–33 Extensive research is being carried upon several systems to understand the molecular mechanism underlying its cellular action.34–39 But all of the studies focus only one aspect of this potentially multi-purpose molecule. No records were fetched on the simultaneous dual use of fluorescent extract of silk cocoons for bioimaging and antioxidant activity. In this study, we decided to explore the mammalian cell antioxidant activity of tasar silk cocoon fluorophore.
Mammalian heart is highly an oxidative organ.40 Therefore oxidative stress is believed to be the major cause of many cardiac dysfunctions such as myocardial hypertrophy, atherosclerosis and even in heart failure.41–44 Being so, in the near past, extensive attempts were made to localize various antioxidants inside the mammalian cells. Few most common strategies include liposome mediated and nanoparticles mediated delivery.45–47 But the most common problems faced by all these strategies were tedious sample preparation, toxicity due to residual organic molecule and cellular endosomal degradation of antioxidants resulting in demolished antioxidant activity.48–50 In the current study using a nanocarrier-based strategy, N-TER™, we report the enduring localization of this fluorophore in the cytosol of mammalian cardiomyoblast cell line H9c2. This localization resulted in efficient fluorescent bio-imaging of cytosol similar to commercial available dyes. Since the fluorophore is rich in flavonoids, we also assessed the antioxidant potential of the cytosol localized fluoropore against H2O2-induced oxidative stress. The tasar silk cocoon fluorophore significantly ameliorated hydrogen peroxide-induced ROS (reactive oxygen species) levels and apoptotic cell death. Interestingly, tasar silk cocoon fluorophore also enhanced endogenous antioxidant levels. These results highlight the dual properties of bio-imaging and antioxidant capacities of naturally occurring tasar silk cocoon fluorophore in mammalian cells. To our knowledge, tasar silk cocoon fluorophore is the first naturally isolated extract to be used for simultaneous bio-imaging and antioxidant activities.
Results and discussion
Extraction and qualitative analysis of tasar silk cocoon fluorophore
We were able to extract 5 mg fluorophore per gram of tasar silk cocoon. There was no change in the color of aqueous fluorophore solution after addition of concentrated H2SO4 however after addition of 20% NaOH, the sample turned to dark yellow and this color disappeared after addition of concentrated HCl. These experiments states that tasar silk cocoon fluorophore extract has higher flavonoid concentration.51
Determination of the major component of the fluorophore
We compared the properties of pure quercetin and extracted fluorophore since quercetin is abundant in diet of tasar silk larva. UV-Vis spectra demonstrated a strong absorption in the region 220–250 nm (Fig. 2A). Most of the phenolic compounds absorb light in this range.52 Based on this absorption maxima, we measured the emission spectra of both fluorophore and quercetin. In comparison to quercetin, extracted fluorophore showed very high fluorescence intensity (Fig. 2B). Also when we exposed both the solutions to UV-A light, we observed very intense yellowish-green fluorescence of fluorophore while quercetin had a very less orange fluorescence (Fig. 2C). Previously researchers have reported similar yellowish-green fluorescence of quercetin 5-O-glucoside.16 Further FPLC studies revealed presence of more than one compounds in the fluorophore. According to the chromatogram of pure quercetin, it is possible that extracted fluorophore may contain quercetin along with other components (Fig. 2D). Several studies in the past demonstrate similar results where silk larvae consumes quercetin rich diet and secretes silk along with quercetin and/or quercetin derivative per s.53–55 The peaks p, q, r, s observed in chromatogram of fluorophore were collected separately and later used for mass spectrometry (Fig. 2D).
 |
| Fig. 2 Comparative analytical studies between standard quercetin and tasar silk cocoon fluorophore. (A) UV-Vis absorption spectra showing a common peak at 230 nm. (B) Fluorescence emission spectra of both quercetin and fluorophore excited at 230 nm. (C) Optical fluorescence in UV-A light. (D) FPLC chromatogram showing presence of more than one compounds in the fluorophore. | |
Fourier transform infrared (FT-IR) spectroscopy of both quercetin and fluorophore showed similar absorbance pattern (refer ESI†). This analysis supported the presence of aromatic compounds in the fluorophore (Fig. S1†). In addition to this we observed similar peaks at m/z 111 and 301 in all the mass spectra representing fragmented catechol and quercetin moiety (Fig. 3).56–58 This fluorophore is isolated from silk cocoons of moth Antheraea mylitta. The primary host plant for this silk moth is Terminalia arjuna which is enriched with flavonoid, quercetin.59,60 According to a recent study, quercetin fluoresce yellowish green color only when it is O-glycosylated at C5 position.16 The silk cocoon fluorophore which we extracted also showed similar fluorescence properties. With support of these evidences and spectrometry data, we predict that this fluorophore has higher concentration of quercetin and/or quercetin derivative per s with a possibility of presence of other fluorescent compounds.
 |
| Fig. 3 Mass spectra of pure quercetin and peaks obtained from FPLC showing similar peaks at 301. | |
Silk fluorophore localized in the cytoplasm
Silk fluorophore is not directly taken up by the mammalian cells. To overcome this, we have used N-TER™ based strategy to facilitate fluorophore uptake by H9c2 cells. It is a nanoparticle siRNA transfection system based on a peptide transfection reagent specifically designed for efficient delivery of siRNAs into a variety of cell types including primary, neuronal, differentiated, and non-dividing cells. Using 2
:
1 mixture of fluorophore with N-TER™, we could successfully localize fluorophore inside H9c2 cells. Intense green fluorescence was observed significantly in the cytoplasm of H9c2 cells (Fig. 4A–F). Two control cell groups were used in this experiment, one with only N-TER™ (no fluorophore, control 1) and other with only fluorophore (no N-TER™, control 2) while the test cells were treated with both N-TER™ and fluorophore. No significant fluorescence was observed in both the control groups. Fluorescence was observed only in the test cells treated with both N-TER™ and fluorophore. Random distribution of silk fluorophore was observed in the cytoplasm and non-specific to any organelle. Microscopic examinations revealed that cytosolic localization of fluorophore does not alter in cell morphology and cell death (Fig. 4C and F). The commercially available live cell cytosol staining dyes such as calcein-AM, BCECF-AM, carboxyfluoresceinsuccinimidyl ester (CFSE), and fluorescein diacetate (FDA) are dependent on intracellular esterases for conversion into fluorescein analogs with green fluorescence. These fluoroscein ester dyes have disadvantages of rapid cellular efflux, dependent on intracellular pH and interfering with cellular functions.61,62 In contrast, the silk fluorophore efficiently stained H9c2 cells and did not alter any cellular morphology. Owing to endogenous fluorescence activity, silk derived protein biomaterial matrices including hydrogels, foams, ropes and films are biocompatible and have found widespread use in tissue engineering and restoration applications.2 In this regard, the cocoon-derived silk fluorophore represents a green chemistry-derived biocompatible natural product with extended fluorescence suitable for studying several cellular events. In corroboration, our present results also demonstrate that silk fluorophore can be efficiently used as a cytosol staining dye without any side effect.
 |
| Fig. 4 Glowing antioxidant, N-TER™ mediated cellular uptake of silk fluorophore into the cytosol of H9c2 cells. Upper panel (A, B, C) representative phase contrast images while lower panel (D, E, F) represents fluorescent microscopic images. No fluorescence was observed in cells treated with either only N-TER™ (D) or only fluorophore (E). Fluorescence was observed only in cells treated with both N-TER™ and fluorophore (F). Red colored arrows indicate cytosolic localization of fluorophore (inset: magnified image showing localization of silk fluorophore in cells). Scale bar 50 μm. | |
Silk fluorophore scavenged ROS and ameliorated oxidative stress
In order to find out the optimal effective dose for antioxidant activity of the fluorophore, we pretreated with 10, 20, 50, 100, 200 and 500 ng ml−1 fluorophore respectively. Subsequently, cells were challenged with 50 μM H2O2 which reportedly generates oxidative stress63 and ROS levels were measured with DCF-DA. This dye passively diffuses into cell and is cleaved into 2,7-dichlorofluorescein by intracellular esterase enzymes in the presence of intracellular ROS, and produces fluorescence. The fluorescence is directly proportional to ROS levels. We observed that fluorophore concentrations of 100 ng ml−1 and above concentrations significantly (p < 0.001) scavenged ROS levels (Fig. 5). Hence silk fluorophore at 100 ng ml−1 concentration was used in all the further studies.
 |
| Fig. 5 Optimization of silk fluorophore dosage for optimal ROS scavenging in H9c2 cells. The H9c2 cells were pretreated with fluorophore dosage ranging from 10 ng ml−1 to 500 ng ml−1. Total ROS levels in cell lysates were estimated using DCFH-DA method after 50 μM H2O2 challenge for 6 hour. The dose of 100 ng ml−1 showed optimal ROS scavenging and hence selected as minimum effective dose for further experiments (* = p < 0.05), (** = p < 0.001). | |
We next evaluated nonspecific ROS levels with CM-DCFH-DA fluorescent probe using flow cytometry after H2O2-induced oxidative stress. Fluorophore pretreatment resulted in 1.7-fold (p < 0.05) decrease in DCF-mean fluorescence in comparison to samples treated with H2O2 alone which otherwise showed 25 fold higher fluorescence in comparison to control cells. Similarly, cells pretreated with fluorophore alone showed near threshold level of ROS. There were two populations one with diminished ROS, which had higher number of cells than control and second with higher DCF-fluorescence, which was 1.5 fold higher than control cells. This could possibly be associated with the auto-fluorescence of silk fluorophore in the same excitation range (Fig. 6A).
 |
| Fig. 6 Estimation of ROS parameters in fluorophore pretreated H9c2 cells post H2O2 challenge. H2O2 stress results in elevated ROS levels while silk fluorophore pretreatment ameliorates ROS levels. (A) Representative histogram overlay of DCF-DA. (B) Spectrophotometric determination of reactive oxygen species in cells using DCF-DA. (C) Fluorescence micrographs (20×) of cells loaded with DCF-DA showing relative ROS in live cells. (D) Fluorescence micrographs (20×) with Mitosox™ showing levels of mitochondrial superoxide (scale bar – 50 μm). (E) Hydrogen peroxide estimation in cells using OxiRed™ colorimetric probe (* = p < 0.05), (# = p < 0.01). | |
Further, the ROS levels were also confirmed using spectrophotometry and fluorescence microscopy. Spectrophotometric measurements of DCF-fluorescence showed 6.5 fold (p < 0.01) elevation in H2O2 treated cells in comparison to the control, while silk fluorophore pretreatment during H2O2 stress reduced the fluorescence to 3.8-fold (p < 0.01) below the levels of H2O2 treated cells. Silk fluorophore alone showed insignificant difference in comparison to control cells (Fig. 6B). Microscopic examination revealed that H2O2 challenged cells exhibited higher DCF-fluorescence in comparison to control while silk fluorophore pretreated cells exhibited significantly reduced levels of fluoroscence (Fig. 6C). Furthermore, we have also evaluated the specific reactive oxygen species such as hydrogen peroxide and mitochondrial superoxide. We determined the concentration of superoxide radicals in live cells using Mitosox™. Microscopy results suggest that, H2O2 treated cells had significantly higher fluorescence in comparison to control cells. In contrast, silk fluorophore pretreated cells challenged with H2O2 exhibited reduced fluorescence and thus reduced superoxide levels (Fig. 6D). Using OxiRed™ probe based method for estimation of H2O2, we observed that control and silk fluorophore pretreated cells possessed 3.12 nM H2O2, while H2O2 challenged cells possessed 4.8 nM H2O2. This was significantly reduced to 3.84 nM (p < 0.05) upon pretreatment with silk fluorophore during H2O2 stress (Fig. 6E).
Similar to quercetin, it is possible that silk cocoon fluorophore can also directly react with cellular ROS to neutralize its effect. Our present results suggest that silk fluorophore effectively counteracted oxidative stress and associated cell death during H2O2 insult. We observed normal growth in silk fluorophore pretreated cells similar to control cells. As mentioned earlier silk fluorophore pretreatment also promoted cell viability during H2O2-induced oxidative cell death. It is assumed that the observed antioxidant activity is responsible for ameliorating H2O2-induced oxidative cell death. This warrants future molecular studies to shed light on the observed effect.
Silk fluorophore prevented H2O2-induced cell death
Since the silk fluorophore efficiently ameliorated H2O2 induced oxidative stress, we next evaluated the efficacy of silk fluorophore in protecting cell viability against H2O2-induced cell death. We used propidium iodide (PI)-based flow-cytometry assay along with microscopic examination to check the cell viability. Our flow-cytometry studies revealed that silk fluorophore pretreatment reduced the proportion of PI+ (dead) cells by 6.5 fold in comparison to H2O2 treated cells. Interestingly fluorophore pretreatment alone did not induce any cell death (Fig. 7A). Further, these observations were also confirmed by direct evaluation of cellular morphology under phase contrast microscope. Our results indicate that cells treated with H2O2 showed distorted morphology and decreased number of cells attached to the surface. This suggests that a significant fraction of H2O2 treated cells were dead. Interestingly, silk fluorophore pretreatment resulted in the normal morphology suggesting higher cell viability during H2O2 treatment (Fig. 7B). All these results suggest that the silk fluorophore promotes cell viability during oxidative stress.
 |
| Fig. 7 Silk fluorophore significantly reduced cells death caused by H2O2 induced oxidative stress. Cell death was assessed by PI staining of H9c2 cells after H2O2-induced oxidative stress. Silk fluorophore pretreated confers protection to cells against oxidative stress mediated cell death. (A) Histogram overlays of PI fluorescence in cells after hypoxia insult or pretreatment with silk fluorophore. (B) Phase contrast photomicrographs (20×) revealing the altered morphology and cell death after H2O2 treatment (Scale bar – 50 μm). | |
Silk fluorophore promote endogenous cellular antioxidant defense
In order to evaluate the role of fluorophore on intracellular antioxidant enzyme levels during H2O2 challenge, we evaluated cellular glutathione status, superoxide dismutase (SOD) and catalase levels. We observed that total glutathione content of the cell was elevated to 1.2 fold in cells exposed to H2O2. Usually, this is observed as an adaptive response of cells against the oxidative stress. Interestingly, silk fluorophore pretreatment resulted in 2-fold (p < 0.01) increased glutathione content in comparison to control cells (Fig. 8A). Glutathione is non-enzymatic antioxidant that maintains the cellular protein in the reduced states, thus protecting them from endogenous oxidative stress. Also, it helps in detoxification of hydrogen peroxide in presence of glutathione peroxidase. Increased concentration of glutathione is therefore beneficial for cells as a primary defense against cellular stress. Further, we estimated the activity of catalase using colorimetric method and observed a 7-fold (p < 0.01) increase in the catalase activity in H2O2 treated cells with respect to control. This was reduced to 4.5 fold (p < 0.05) when the cells were pretreated with silk fluorophore during H2O2 induced stress. Fluorophore alone did not cause any change in the catalase activity (Fig. 8B). Catalase is an enzyme that catalyzes the conversion of hydrogen peroxide to water, the expression of catalase is stimulated by its substrate, reactive oxygen species, and therefore higher ROS elevates the concentration of catalase. Silk fluorophore pretreatment prevented the ROS en source and therefore prevented the elevation of catalase activity. Finally, the activity of superoxide dismutase was measured using colorimetric method and we observed that there was no significant change in either of the groups in comparison to the control group (Fig. 8C).
 |
| Fig. 8 Status of key antioxidants in vitro. (A) Total glutathione content in cell lysate was significantly increased in silk fluorophore pretreated cells exposed to H2O2. (B) Catalase activity assay showed increased activity in cells exposed to H2O2 while no effect was observed in silk fluorophore alone, but silk fluorophore pretreated cells exposed to H2O2 showed 1.5 decreased activity compared to H2O2 alone. (C) Superoxide dismutase activity was not altered significantly during silk fluorophore intervention or H2O2 insult (* = p < 0.05), (# = p < 0.01). | |
Visualization of cell with fluorescent compounds provides a wide variety of cellular structural and functional information, but the major concerns are cytotoxicity, cellular efflux and cost-effectiveness. The commercially available fluorogenic dyes are esterase substrates that are passively loaded into live cells with DMSO (dimethyl sulfoxide). These dyes are dependent on intracellular esterases to be converted into fluoroscein analogs which can be effectively detected. Moreover, these dyes also harbor chemical modifications to be retained inside the cells making them expensive.60,63,65 In contrast, silk fluorophore has the advantages of natural endogenous fluoroscence and thus does not dependent on cellular esterases. Interestingly no chemical modifications are also required for silk fluorophore for cellular retention. Furthermore, the isolation of silk fluorophore using water-glass is a simple green-chemistry based method.7 An in-house cost analysis revealed that silk fluorophore is at least 4 times cheaper than the commercial available dyes. Being rich in flavonoids, fluorophore also exhibited strong antioxidant effects during hydrogen peroxide challenge.64,65 The dietary flavonoids can chelate metals, scavenge oxygen free radicals and prevent the oxidation of low density lipoprotein (LDL).66 Several studies have reported antioxidant effects of flavonoids in animal model of diseases.67,68 In corroboration, our present studies also report the antioxidant effects of flavonoid rich tasar silk cocoon fluorophore in H9c2 cells against hydrogen peroxide challenge. The silk fluorophore also augmented endogenous antioxidant defense thus providing enhanced cell survival during oxidative stress.
The present study suffers from limitations of using only rat cardiomyoblast cell line H9c2 for both imaging and antioxidant studies. Since flavonoids have been extensively used in cancer research it is worth studying the use of silk fluorophore to human cancer cell lines. Moreover, the present study provides evidences for in vitro imaging and antioxidant activities of the silk fluorophore. It will be interesting to study the in vivo imaging potentials as well as antioxidant activities in animal models of diseases.
Materials and methods
Extraction of fluorophore from tasar silk cocoon
Here we have slightly modified the previously published extraction and purification method for fluorophore.7 Briefly, tasar cocoons of silkworm Antheraea mylitta were cut into small pieces, 1% w/v cocoon pieces were immersed in 0.125 M sodium silicate solution for an hour and the filtrate was collected after passing through Whatman's filter paper. The filtrate was evaporated and the obtained powder was mixed in methanol, followed by brief centrifugation to obtain the fluorescent supernatant. This supernatant was then further evaporated and the powder was mixed in acetone, followed by brief centrifugation to obtain pure fluorophore in acetone. The supernatant was hot air-dried and the resulting powder was dissolved in suitable polar solvents as per the experiment.
Qualitative estimation of tasar silk cocoon fluorophore
Preparation of sample. Small cocoon pieces were boiled for 5 minutes in deionized water at concentration of 10% (w/v). The extract was then filtered while it was hot using Whatman filter paper with pore size 11 μm.51,69,70 This filtrate was used for qualitative estimation of carotenoids and flavonoids.
For carotenoids. The filtrate was mixed with 85% H2SO4 in equal ratio. The final colour of the solution was observed for analysis.
For flavonoids. To the filtrate, few drops of 20% NaOH were added. Sudden color change to dark yellow was observed, which disappeared after addition of concentrated HCl.
Comparative analytical studies between tasar silk cocoon fluorophore and quercetin
Uniform solutions of concentration 2 mg ml−1 in methanol, of both tasar silk cocoon fluorophore and quercetin were used for following analytical experiments.
UV-Vis spectroscopy. Spectra were obtained using Molecular devices SpectraMax M3. The absorption maxima of this fluorophore was at 230 nm while quercetin showed absorption at 230 nm and 370 nm.
Optical fluorescence. In order to observe the color of fluorescence, both the samples were exposed to UV-A light.
Fluorescence spectrometry. Spectra were recorded using excitation wavelength of 230 nm. Spectra were obtained using Perkin-Elmer L5 55 fluorescence spectrophotometer.
Fourier transform infrared spectroscopy. Lyophilized samples were used for this study. Infrared spectra were recorded at 4 cm−1 resolution using a Zn–Se MIR ATR (Bruker Tensor 27) equipped with MCT detector. The instrument was continuously purged with nitrogen gas while recording.
FPLC purification. Fluorophore powder was dissolved in water–acetonitrile (1
:
1, v/v) and loaded on reverse phase C-3 column (Agilent ZORBAX SB-C3). Purification were done on BIO-RAD biologic – duo flow FPLC system, mobile phase was composed of water and acetonitrile. Purifications were done by eluting samples with a linear gradient of acetonitrile for 45 ml at flow rate of 2 ml min−1. The effluent was monitored at 254 nm and peak fractions were collected as per chromatogram profile.
Mass spectrometry. Fractions corresponding to peaks p, q and r were subjected separately from mass spectroscopy using Agilent Technologies 1260 Infinity and 6120 Quadrupole LCMS. Methanol was used as a solvent and method was operated at positive mode.
Cell culture and experimental groups
Rat cardiomyoblast cell line H9c2 were obtained from American type culture collection and cultured in Dulbecco's modified Eagles media (cat# AL007A, HiMedia), supplemented with 10% fetal bovine serum (cat# F9665, Sigma) and antibacterial antimycotic solution (cat# A002, HiMedia) and incubated at 37 °C in a humidified atmosphere of 5% CO2. Culture media was changed after each 24 hours of subculture. In this study, we have used H9c2 cells after 5 passage and 2.5 million cells (70–75% confluent cells, approx. 2.5 days after subculture) per group was used for experimental groups. Four experimental groups namely control (with no treatment), silk fluorophore (cells supplemented with 100 ng ml−1 silk fluorophore in culture media), H2O2 (cells treated with 50 μM H2O2 for 6 hours) and silk fluorophore + H2O2 (cells pretreated with silk fluorophore for 24 hours and then added with 50 μM H2O2 for 6 hours) were made. For cell culture treatment 150 ng ml−1 of silk fluorophore was added to commercial cell permeating agent N-TER™ in the ration of 2
:
1 to achieve a final concentration of 100 ng ml−1.
Fluorescence microscopy for fluorophore localization
Cells were pretreated with fluorophore, following which, the media was decanted and cells were fixed in 4% paraformaldehyde prepared in phosphate buffer saline. Cells were then observed under phase contrast microscope with epifluorescence and photomicrographs were obtained at 20× objective magnification. Representative two control cell groups, one without fluorophore (control 1) and other without N-TER™ (control 2) were also observed.
Estimation of reactive oxygen species
ROS estimation. Intracellular ROS induced by H2O2 in H9c2 cells was measured using 2′7′-carboxymethyldichlorodihydrofluorescein diacetate (CM-DCFH-DA, cat# C6827, Life Technologies) as a fluorescent probe.71 H9c2 cells were loaded with CM-DCFH-DA (20 μM) for 10 min, followed by 2 washes with Dulbecco's phosphate buffer saline (DPBS). Dichlorodihydrofluorescein (DCF) fluorescence positive cells were assessed using flow cytometer (FAScalibur, Becton Dickinson). Cells were loaded with 25 μM of the CM-DCFDH-DA for 10 min at 37 °C and collected after trypsinization. The fluorescence intensity was monitored at the FL-2 channel and 10
000 events were collected per sample. ROS estimation was further confirmed with fluorescence spectrophotometer with an excitation at 485 nm and an emission at 520 nm. In a separate set of experiments, the fluorescence was captured using epifluorescence microscope (N-Storm, Nikon).
Estimation of mitochondrial superoxide radicals. Mitochondrial superoxide radical production was semi-quantitated with fluorescence microscopy using Mitosox™ dye (cat #M36008, Life Technologies) as per the manufacturer's instructions. Briefly, the cells were washed with DPBS twice and added with 10 μl dye and incubated at 37 °C for 15 minutes. Photomicrographs were than acquired with epifluorescence microscope (N-Storm, Nikon). At least 3 different slides and 5 different fields per slide were observed.
Estimation of cellular hydrogen peroxide levels. Concentration of H2O2 in cell lysate was measured using H2O2 estimation kit (cat# ab102500, Abcam) as per the manufacturer's instructions. Briefly, cell lysate was passed through a 10 kDa cutoff filter and 50 μl standard or cell lysate were added in triplicates to a 96 well plate. Further, 50 μl reaction mix containing assay buffer, OxiRed™ probe and HRP was added to each well followed by incubation at 25 °C for 10 minutes. Optical density was measured at 570 nm. Finally the concentration of H2O2 was measured using standard curve and represented as nM (H2O2) in cell lysate.
Estimation of ROS dependent cell death. ROS dependent cell death induced by H2O2 in H9c2 cells was measured using propidium iodide (PI) fluorescent probe. Propidium iodide permeates dead cells and therefore stains dead cells (PI+), but unable to stain live cells (PI−). Cells were trypsinised and pelleted at 1500 rpm for 10 minutes. After washing with PBS, cells were incubated with 10 μM PI at 37 °C for 15 minutes. The cells were washed, re-suspended in 500 μl DPBS and transferred to FACS tubes. The fluorescence intensity was monitored at the FL-1 channel and 10
000 events were collected per sample and data was represented as histogram overlays. In a parallel experiment, cell morphology was assessed in a phase contrast microscope (20×) to determine oxidative stress induced cell death.
Effect of fluorophore on endogenous antioxidant levels
Preparation of cell lysate. Estimation of cellular antioxidants was performed in cell lysate. Cells were harvested after trypsinization and centrifuged at 1500 rpm for 10 minutes. Further, pellet was added with 200 μl RIPA buffer (cat# R0278-50ML, Sigma). The cells were incubated on ice for 15 minutes and lysed using vortex mixture. Finally the suspension was centrifuged at 10
000 rpm for 15 minutes and supernatant was collected and stored with 0.1% protease inhibitor cocktail (cat# P8340, Sigma) at −20 °C for further use.
Estimation of total glutathione content. Total glutathione estimation was performed using ELISA based Glutathione assay kit (cat# 703002, Cayman Chemicals) as per the manufacturer's instructions. Briefly, cell lysate was passed through a 10 kDa cutoff filter and 50 μl standard or cell lysate were added in duplicates to a 96 well plate. Further, 150 μl assay cocktail (prepared by adding MES buffer, reconstituted cofactor mixture, reconstituted enzyme and Ellman's reagent) was added to each well. The plate was incubated in dark on an orbital shaker for 25 minutes and absorbance was measured at 405 nm. Concentration of glutathione was calculated using the standard plot and represented as μM glutathione in cell lysate.
Estimation of catalase activity. Catalase activity was measured using Enzychrome™ catalase assay kit (cat# ECAT-100, Bioassay systems, USA) as per the manufacturer's instructions. Briefly, 10 μl cell lysate or H2O2 standards were added in duplicate to a 96 well plate. Further, 90 μl of 50 μM substrate was added to each sample well and plate was incubated at room temperature for 30 minutes. 100 μl of detection reagent mix containing assay buffer, dye and HRP enzyme was added to each well. Reagents were mixed by tapping and plate was incubated at room temperature for 10 minutes. Finally, optical density and absorbance was measured at 570 nm and concentration was calculated using H2O2 standard plot. Data was represented as catalase units per L and unit was defined as amount of catalase that decomposed 1 μM (H2O2) per minute at pH 7.0 and room temperature.
Estimation of superoxide dismutase activity. Superoxide dismutase (SOD) activity was measured using Enzychrome™ superoxide dismutase assay kit (cat# ESOD-100, Bioassay systems, USA), as per the manufacturer's instructions. Briefly, 20 μl standard or samples were added in duplicate to wells of a 96 well plate. Further, 160 μl working reagent containing assay buffer, xanthine and WST-1 was added to each well. Absorbance was measured immediately at 430 nm (OD0) and then plate was incubated at 25 °C for 60 minutes. Again, absorbance was measured at 430 nm (OD60). Finally the concentration of SOD was measured using ΔOD against SOD concentration standard curve and activity was represented as U per ml.
Statistical analysis
All the values were represented as mean ± SEM of three independent experiments. Statistical analysis was performed using ANOVA with Newman Keuls post hoc tests and a p value of <0.05 was considered significant. All analysis was performed using GraphPad Prism software version 5.0 (GraphPad Software, California, USA).
Conclusion
The fluorescent extract (fluorophore) obtained from tasar silk cocoon is rich in flavonoids. It could be localized inside mammalian cell using a novel, N-TER™ nano-carrier based strategy. This fluorophore have dual potential to be used simultaneously as a bio-imaging agent and as an antioxidant in mammalian cell culture experiments. The silk fluorophore possesses advantages of cost effective, non-toxic, independent of cellular esterases for fluorescence, no harmful chemical modifications, and extended fluorescence as compared to the commercially available dyes. The cells localized with fluorophore show remarkable tolerance to H2O2 induced oxidative stress as compared to control. According to the analysis, it is possible that fluorophore can either directly react to the cellular ROS and/or elevate the concentration of endogenous antioxidant like glutathione and catalase, hence promoting the reduction of cellular oxidative stress. At present tasar silk cocoon fluorophore is being wasted during silk processing; scientific and commercial exploitation of this natural product can boost this ancient cottage industry.
Conflict of interest
The authors declare no conflict of interest.
Acknowledgements
This work was supported by DRDO CARS grant (DIPAS/BSBE/20110112) to MD. Initial work was supported from the start up grant of MD ‘IITK start-up grant (IITK/BSBE/20100206) (2010-2011)'. TSK is funded by IITK PhD fellowship program. This work is a part of TSK's PhD thesis. AG is a recipient of DST/INSPIRE Fellowship (IF130982). KB and NS acknowledge the funding obtained from DIP-254.
References
- G. H. Altman, F. Diaz, C. Jakuba, T. Calabro, R. L. Horan, J. Chen, H. Lu, J. Richmond and D. L. Kaplan, Biomaterials, 2003, 24, 401 CrossRef CAS.
- C. Vepari and D. L. Kaplan, Prog. Polym. Sci., 2007, 32, 991 CrossRef CAS PubMed.
- M. Roy, S. K. Meena, T. S. Kusurkar, S. K. Singh, N. K. Sethy, K. Bhargava, S. Sarkar and M. Das, Biointerphases, 2012, 7, 45 CrossRef CAS PubMed.
- J. Zhang, J. Kaur, R. Rajkhowa, J. Li, X. Liu and X. Wang, Mater. Sci. Eng., C, 2013, 33, 3206 CrossRef CAS.
- N. P. Horrocks, F. Vollrath and C. Dicko, Comp. Biochem. Physiol., Part A: Mol. Integr. Physiol., 2013, 164, 645 CrossRef CAS PubMed.
- J. Kaur, R. Rajkhowa, T. Tsuzuki, K. Millington, J. Zhang and X. Wang, Biomacromolecules, 2013, 14, 3660 CrossRef CAS PubMed.
- B. Tulachan, S. K. Meena, R. K. Rai, C. Mallick, T. S. Kusurkar, A. K. Teotia, N. K. Sethy, K. Bhargava, S. Bhattacharya, A. Kumar and M. Das, Sci. Rep., 2014, 4, 5434 CAS.
- M. Roy, T. S. Kusurkar, S. K. Maurya, S. K. Meena, S. K. Singh, N. Sethy, K. Bhargava, R. K. Sharma, D. Goswami, S. Sarkar and M. Das, 3 Biotech, 2014, 4, 67, DOI:10.1007/s13205-013-0128-2.
- V. Sahu, S. Grover, B. Tulachan, M. Sharma, G. Srivastava, M. Roy, M. Saxena, N. Sethy, K. Bhargava, D. Philip and M. Das, Electrochim. Acta, 2015, 160, 244 CrossRef CAS.
- T. S. Kusurkar, I. Tandon, N. K. Sethy, K. Bhargava, S. Sarkar, S. K. Singh and M. Das, Sci. Rep., 2013, 3, 3290 Search PubMed.
- J. A. Radley and J. Grant, Fluorescence Analysis in Ultra-Violet light, 1939 Search PubMed.
- M. Oku, Bull. Agric. Chem. Soc. Jpn., 1929, 5, 81 CrossRef.
- M. Oku, Bull. Agric. Chem. Soc. Jpn., 1929, 5, 104 Search PubMed.
- M. Oku and C. L. Ayabe-mati, Bull. Agric. Chem. Soc. Jpn., 1934, 10, 164 CrossRef CAS.
- M. Oku, Bull. Agric. Chem. Soc. Jpn., 1934, 10, 158 CrossRef CAS.
- T. Daimon, C. Hirayama, M. Kanai, Y. Ruike, Y. Meng, E. Kosegawa, M. Nakamura, G. Tsujimoto, S. Katsuma and T. Shimada, Proc. Natl. Acad. Sci. U. S. A., 2010, 107, 11471 CrossRef CAS PubMed.
- A. Kurioka and M. Yamazaki, J. Insect Biotechnol. Sericol., 2002, 71, 177 CAS.
- A. Kurioka and M. Yamazaki, Biosci., Biotechnol., Biochem., 2002, 66, 1396 CrossRef CAS PubMed.
- C. Hirayama, H. Ono, Y. Tamura, K. Konno and M. Nakamura, Phytochemistry, 2008, 69, 1141 CrossRef CAS PubMed.
- J. Formica and W. Regelson, Food Chem. Toxicol., 1995, 33, 1061 CrossRef CAS PubMed.
- K. Ishizawa, M. Yoshizumi, Y. Kawai, J. Terao, Y. Kihira, Y. Ikeda, S. Tomita, K. Minakuchi, K. Tsuchiya and T. Tamaki, J. Pharmacol. Sci., 2011, 115, 466 CrossRef CAS.
- R. L. Edwards, T. Lyon, S. E. Litwin, A. Rabovsky, J. D. Symons and T. Jalili, J. Nutr., 2007, 137, 2405 CAS.
- G. Hubbard, S. Wolffram, J. Lovegrove and J. Gibbins, J. Thromb. Haemostasis, 2004, 2, 2138 CrossRef CAS PubMed.
- G. P. Hubbard, S. Wolffram, R. de Vos, A. Bovy, J. M. Gibbins and J. A. Lovegrove, Br. J. Nutr., 2006, 96, 482 CAS.
- W. M. Loke, J. M. Hodgson, J. M. Proudfoot, A. J. McKinley, I. B. Puddey and K. D. Croft, Am. J. Clin. Nutr., 2008, 88, 1018 CAS.
- F. Perez-Vizcaino, D. Bishop-Bailley, F. Lodi, J. Duarte, A. Cogolludo, L. Moreno, L. Bosca, J. A. Mitchell and T. D. Warner, Biochem. Biophys. Res. Commun., 2006, 346, 919 CrossRef CAS.
- R. Bucki, J. Pastore, F. Giraud, J. C. Sulpice and P. Janmey, J. Thromb. Haemostasis, 2003, 1, 1820 CrossRef CAS.
- R. J. Nijveldt, E. van Nood, D. E. van Hoorn, P. G. Boelens, K. van Norren and P. A. van Leeuwen, Am. J. Clin. Nutr., 2001, 74, 418 CAS.
- M. Zhang, S. G. Swarts, L. Yin, C. Liu, Y. Tian, Y. Cao, M. Swarts, S. Yang, S. B. Zhang, K. Zhang, S. Ju, D. J. Olek Jr, L. Schwartz, P. C. Keng, R. Howell, L. Zhang and P. Okunieff, Adv. Exp. Med. Biol., 2011, 701, 283 CrossRef CAS PubMed.
- S. Kumar and A. K. Pandey, Sci. World J., 2013, 2013, 162750 Search PubMed.
- Y. Hanasaki, S. Ogawa and S. Fukui, Free Radical Biol. Med., 1994, 16, 845 CrossRef CAS.
- K. E. Heim, A. R. Tagliaferro and D. J. Bobilya, J. Nutr. Biochem., 2002, 13, 572 CrossRef CAS PubMed.
- A. B. Bentz, Journal of Young Investigators, 2009, 19, 3416 Search PubMed.
- L. M. Blanco-Colio, M. Valderrama, L. A. Alvarez-Sala, C. Bustos, M. Ortego, M. A. Hernández-Presa, P. Cancelas, J. Gómez-Gerique, J. Millán and J. Egido, Circulation, 2000, 102, 1020 CrossRef CAS.
- Y. D. Min, C. H. Choi, H. Bark, H. Y. Son, H. H. Park, S. Lee, J. W. Park, E. K. Park, H. I. Shin and S. H. Kim, Inflammation Res., 2007, 56, 210 CrossRef CAS PubMed.
- I. Belinha, M. A. Amorim, P. Rodrigues, V. de Freitas, P. Moradas-Ferreira, N. Mateus and V. Costa, J. Agric. Food Chem., 2007, 55, 2446 CrossRef CAS.
- L. Rivera, R. Morón, M. Sánchez, A. Zarzuelo and M. Galisteo, Obesity, 2008, 16, 2081 CrossRef CAS PubMed.
- C. A. Warren, K. J. Paulhill, L. A. Davidson, J. R. Lupton, S. S. Taddeo, M. Y. Hong, R. J. Carroll, R. S. Chapkin and N. D. Turner, J. Nutr., 2009, 139, 101 CrossRef CAS PubMed.
- S. Bhaskar, V. Shalini and A. Helen, Immunobiology, 2011, 216, 367 CrossRef CAS PubMed.
- J. B. West, Physiologic basis of medical practice, Williams and Wilkins, Baltimore, Maryland, USA, 1991, p. 250 Search PubMed.
- T. Hayek, B. Fuhrman, J. Vaya, M. Rosenblat, P. Belinky, R. Coleman, A. Elis and M. Aviram, Arterioscler., Thromb., Vasc. Biol., 1997, 17, 2744 CrossRef CAS.
- D. B. Sawyer, D. A. Siwik, L. Xiao, D. R. Pimentel, K. Singh and W. S. Colucci, J. Mol. Cell. Cardiol., 2002, 34, 379 CrossRef CAS PubMed.
- F. J. Giordano, J. Clin. Invest., 2005, 115, 500 CrossRef CAS.
- S. V. Lakshmi, G. Padmaja, P. Kuppusamy and V. K. Kutala, Indian J. Biochem. Biophys., 2009, 46, 421 CAS.
- G. Leonarduzzi, G. Testa, B. Sottero, P. Gamba and G. Poli, Curr. Med. Chem., 2010, 17, 74 CrossRef CAS PubMed.
- J. Seguin, L. Brullé, R. Boyer, Y. M. Lu, M. R. Romano, Y. S. Touil, D. Scherman, M. Bessodes, N. Mignet and G. G. Chabot, Int. J. Pharm., 2013, 444, 146 CrossRef CAS PubMed.
- S. Wang, J. Zhang, M. Chen and Y. Wang, Expert Opin. Drug Delivery, 2013, 10, 1411 CrossRef CAS PubMed.
- Z. E. Suntres, J. Toxicol., 2011, 2011, 152474 Search PubMed.
- A. Munin and F. Edwards-Lévy, Pharmaceutics, 2011, 3, 793 CrossRef CAS PubMed.
- N. Mignet, J. Seguin and G. G. Chabot, Pharmaceutics, 2013, 5, 457 CrossRef CAS PubMed.
- I. Ajayi, O. Ajibade and R. Oderinde, Res. J. Chem. Sci., 2011, 1, 58 CAS.
- D. Tsimogiannis, M. Samiotaki, G. Panayotou and V. Oreopoulou, Molecules, 2007, 12, 593 CrossRef CAS PubMed.
- H. Y. Wang, Y. J. Wang, L. X. Zhou, L. Zhu and Y. Q. Zhang, Food Funct., 2012, 3, 150 CAS.
- C. Hirayama, H. Ono, Y. Tamura and M. Nakamura, Phytochemistry, 2006, 67, 579 CrossRef CAS PubMed.
- Y. Zhang, X. Yu, W. Shen, Y. Ma, L. Zhou, N. Xu and S. Yi, Sci. China: Life Sci., 2010, 53, 1330 CrossRef PubMed.
- F. Sánchez-Rabaneda, O. Jáuregui, I. Casals, C. Andrés-Lacueva, M. Izquierdo-Pulido and R. M. Lamuela-Raventós, J. Mass Spectrom., 2003, 38, 35 CrossRef PubMed.
- E. Hvattum and D. Ekeberg, J. Mass Spectrom., 2003, 38, 43 CrossRef CAS PubMed.
- D. Del Rio, A. J. Stewart, W. Mullen, J. Burns, M. E. Lean, F. Brighenti and A. Crozier, J. Agric. Food Chem., 2004, 52, 2807 CrossRef CAS.
- Ambika, P. P. Singh and S. Chauhan, Nat. Prod. Res., 2014, 28, 760 CrossRef PubMed.
- M. Shahriar, S. Akhter, M. I. Hossain, M. A. Haque and M. A. Bhuiyan, J. Med. Plants Res., 2012, 6, 5286 Search PubMed.
- L. S. de Clerck, C. H. Bridts, A. M. Mertens, M. M. Moens and W. J. Stevens, J. Immunol. Methods, 1994, 172, 115 CrossRef CAS PubMed.
- C. R. Parish, Immunol. Cell Biol., 1999, 77, 499 CrossRef CAS PubMed.
- S. K. Ujjain, A. Das, G. Srivastava, P. Ahuja, M. Roy, A. Arya, K. Bhargava, N. Sethy, S. K. Singh, R. K. Sharma and M. Das, Biointerphases, 2014, 9, 031011 CrossRef PubMed.
- I. Johnson, Histochem. J., 1998, 30, 123 CrossRef CAS PubMed.
- I. Morel, G. Lescoat, P. Cogrel, O. Sergent, N. Pasdeloup, P. Brissot, P. Cillard and J. Cillard, Biochem. Pharmacol., 1993, 45, 13 CrossRef CAS PubMed.
- P. C. Hollman, J. M. van Trijp, M. N. Buysman, M. S. v. d. Gaag, M. J. Mengelers, J. H. de Vries and M. B. Katan, FEBS Lett., 1997, 418, 152 CrossRef CAS PubMed.
- O. Coskun, M. Kanter, A. Korkmaz and S. Oter, Pharmacol. Res., 2005, 51, 117 CrossRef CAS PubMed.
- A. Machha, F. I. Achike, A. M. Mustafa and M. R. Mustafa, Nitric Oxide, 2007, 16, 442 CrossRef CAS PubMed.
- K. R. Khandelwal, Practical pharmacognosy, Nirali Prakashan, Pune, 2008 Search PubMed.
- S. Bhatt and S. Dhyani, Int. J. Curr. Pharm. Res., 2012, 4, 87 Search PubMed.
- H. Wang and J. A. Joseph, Free Radical Biol. Med., 1999, 27, 612 CrossRef CAS PubMed.
Footnotes |
† Electronic supplementary information (ESI) available. See DOI: 10.1039/c5ra14148f |
‡ TSK and AG has contributed equally for this work. |
|
This journal is © The Royal Society of Chemistry 2015 |
Click here to see how this site uses Cookies. View our privacy policy here.