Synthesis of phenolic amides and evaluation of their antioxidant and anti-inflammatory activity in vitro and in vivo

Ya-Ting Leea, You-Liang Hsiehb, Yen-Hung Yeh*cd and Chih-Yang Huangbef
aDepartment of Beauty Science, National Taichung University of Science and Technology, Taichung, Taiwan, Republic of China
bDepartment of Health and Nutrition Biotechnology, Asia University, Taichung, Taiwan, Republic of China
cSchool of Health Diet and Industry Management, Chung Shan Medical University, Taichung, Taiwan, Republic of China. E-mail: yhyeh@csmu.edu.tw; Tel: +886-4-24730022
dDepartment of Nutrition, Chung Shan Medical University Hospital, Taichung, Taiwan, Republic of China
eGraduate Institute of Basic Medical Science, China Medical University, Taichung, Taiwan, Republic of China
fDepartment of Chinese Medicine, China Medical University Hospital, Taichung, Taiwan, Republic of China

Received 21st July 2015 , Accepted 28th September 2015

First published on 28th September 2015


Abstract

A series of 15 phenolic amides (PAs) have been synthesized (PA1–PA15) and examined in vitro by four different tests: (1) prevention of Cu2+-induced human low-density lipoprotein oxidation, (2) scavenging of stable radicals, (3) anti-inflammatory activity, (4) scavenging of superoxide radicals. We used PA1 and α-tocopherol for an in vivo study. The overall potential of the antioxidant system was significantly enhanced by the PA1 and α-tocopherol supplements as the hepatic TBARS levels were lowered while the hepatic SOD activities and GSH concentration were elevated in PA1 fed rats. Our results support that PA1 may exert antioxidant action through inhibiting superoxide generation. PA1 decreased the level of nitric oxide (NO) production, tumor necrosis factor-alpha (TNF-α) and nuclear factor-kappa B (NF-κB). These results show that PA1 can inhibit lipid peroxidation, enhance the activities of antioxidant enzymes, and decrease the TNF-α/NF-κB level and nitric oxide production. Therefore, it was speculated that PA1 acts through its anti-inflammation capacity.

1. Introduction

Oxidative stress is a contributing factor to the pathogenesis of neurodegenerative disorders such as cerebral ischemia/reperfusion injury and trauma as well as chronic conditions such as Parkinson’s disease and Alzheimer’s disease.1 Metabolism of oxygen in living cells leads to oxygen-derived free radical production.2 These free radicals attack the unsaturated fatty acids of biomembranes, which results in the destruction of proteins and DNA and lipid peroxidation.3 Thus, the development of antioxidants, which can retard the process of lipid peroxidation by blocking the production of a free radical chain reaction, has gained importance in recent years.4

Phenolic acid derivatives are widely distributed in plants5 but there only a few phenolic amides. The pharmacological functionality of phenolic amides has attracted much attention and they have been acknowledged as having interesting medicinal properties, such as anti-inflammatory, antiviral, anti-cancer and anti-coagulant activities.6–8 Recently, we found N-trans- and N-cis-feruloyl 3-methyldopamine in Achyranthes bidentata, a famous Chinese herb used for the treatment of many diseases. Achyranthes bidentata is an erect, annual herb distributed in hilly districts of India, Java, China and Japan. The plant is used in indigenous system of medicine as emmenagogue, antiarthritic, antifertility, laxative, ecbolic, abortifacient, anthelmintic, aphrodisiac, antiviral, antispasmodic, antihypertensive, anticoagulant, diuretic and antitumour.9 Also it is useful to treat cough, renal dropsy, fistula, scrofula, skin rash, nasal infection, chronic malaria, impotence, fever, asthma, amenorrhoea, piles, abdominal cramps and snake bites. The analysis of its phytochemical profile revealed that it contains rutin, saponins, achyranthine, caffeic acid, oleanolic acid, inokosterone, ecdysterone, rubrosterone and physcion.10 This prompted us to synthesize more phenolic amides to optimize antioxidant activity. In this study, antioxidant activities were examined by four different tests: we evaluated antioxidant activity on the inhibition of Cu2+-induced human LDL oxidation as an in vitro assay system, the radical scavenging activity against stable radical 1,1-diphenyl-2-picrylhydrazyl (DPPH), the oxygen radical absorbance capacity (ORAC) assay and the inhibition of superoxide production in the xanthine/xanthine oxidase (X/XO) system as well as evaluation of the effect on the stimulus-induced superoxide generation in human neutrophils.

Activated macrophages release inflammatory mediators including tumor necrosis factor-alpha (TNF-α)/nuclear factor-kappa B (NF-κB), and nitric oxide (NO) which have been implicated in liver damage induced by a number of different toxicants.11 Hence, the present study was undertaken to investigate the antioxidant and anti-inflammatory activities of PA1 in comparison to α-tocopherol, in male Sprague-Dawley rats.

2. Materials and methods

2.1. Materials

Chemicals and reagents: 2-hydroxycinnamic acid (97%), 3-hydroxycinnamic acid (99%), 4-hydroxycinnamic acid (99%), ferulic acid (99%), isoferulic acid (97%), 3-hydroxytyramine hydrochloride, 3-methyldopamine hydrochloride and 4-methyldopamine hydrochloride, 2,2-azobis(2-methylpropionamidine) dihydrochloride (AAPH), fluorescein disodium and 6-hydroxy-2,5,7,8-tetramethylchroman-2-carboxylic acid (Trolox) were purchased from Aldrich-Sigma Chemical Co. (St Louis, MO, USA). 1,3-Dicyclohexylcarbodiimide, benzyl chloride, carbon trichlorobromide, methyl iodide, phenethyl alcohol, α-tocopherol were purchased from Riedel-de Haën Chemical Co. (St Louis, MO, USA). Copper sulfate pentahydrate, ethylenediaminetetraacetic acid (EDTA), potassium dihydrogen phosphate, sodium chloride, sodium bromide, disodium hydrogen phosphate, ethanol and cholesterol enzymatic CHOD-PAP method (code no. 1.14366.0001) were purchased from E. Merck Chemical Co. (Darmstadt, Germany). Lipofilm (code no. 4040-2) was purchased from Sebia Co. Phorbol 12-myristate 13-acetate (PMA) (99%), N-formyl-methionyl-leucyl-phenyl-alanine (fMLP) (99%), bis-N-methylacridinium nitrate (lucigenin), xanthine (99%) and xanthine oxidase were purchased from Aldrich-Sigma Chemical Co. (St Louis, MO, USA). General synthetic procedure for phenolic amides: the phenolic amides (PA1–PA15) were prepared from condensation of the corresponding phenolic acids (1.0 mmol) and phenethylamines (1.1 mmol) with the substitution by hydroxy and/or methoxy groups on the phenyl rings in the presence of DCC (4.0 mmol). The reaction mixture was stirred in THF overnight at room temperature. After removal of the solvent of the reaction mixture, water was added and extracted with EtOAc. The EtOAc layer was dried over Na2SO4 and evaporated to dryness, the residue was purified by silica gel column chromatography (CHCl3–Me2CO, 10[thin space (1/6-em)]:[thin space (1/6-em)]1) to afford the final product. The over yield was about 30–62%. Structures were confirmed with infrared, nuclear magnetic resonance and high resolution mass spectrometry (Table 1).
Table 1 Structure of phenolic amides (PA1–PA15)
Compound R1 R2 R3 R4 R5
PA1 OH H H OH OH
PA2 H OH H OH OH
PA3 H H OH OH OH
PA4 H OMe OH OH OH
PA5 H OH OMe OH OH
PA6 OH H H OMe OH
PA7 H OH H OMe OH
PA8 H H OH OMe OH
PA9 H OMe OH OMe OH
PA10 H OH OMe OMe OH
PA11 OH H H OH OMe
PA12 H OH H OH OMe
PA13 H H OH OH OMe
PA14 H OMe OH OH OMe
PA15 H OH OMe OH OMe
image file: c5ra14137k-u1.tif


2.2. Analytical and spectral equipment

Synthesized products were purified on a silica gel column and identified by thin layer chromatography (TLC), nuclear magnetic resonance (NMR), infrared spectra (IR) and GC mass analysis. Melting points (Mp) were determined with a Yanaco micromelting point apparatus. IR were obtained on a Nicolet Avatar-320 FTIR spectrophotometer. NMR spectra were recorded on a Varian INOVA-500 spectrometer. CDCl3, CD3OD and acetone-d6 were used as solvents; chemical shifts are reported in parts per million (δ) units relative to internal tetramethylsilane. Mass spectra (MS) were recorded on an EI-MS JEOL JMS-HX 100 mass spectrometer. TLC was performed on precoated silica gel F254 plates (Merck) using a 254 nm UV lamp to monitor these reactions.

2.3. Identification of the PAs (PA1–PA15)

N-trans-o-Coumaroyldopamine (PA1): colorless oil; yield 35%. IR (film)max 3400, 1650, 1600, 1510, 1200 cm−1. 1H-NMR (acetone-d6): δ 2.72 (2H, t, J = 7.0 Hz), 3.56 (2H, m), 6.56 (1H, dd, J = 2.0, 8.0 Hz), 6.74 (1H, d, J = 8.0 Hz), 6.78 (1H, d, J = 2.0 Hz), 6.79 (1H, d, J = 16.0 Hz), 6.83 (1H, m), 6.97 (1H, dd, J = 2.0, 8.0 Hz), 7.17 (1H, m), 7.46 (1H, dd, J = 2.0, 8.0 Hz), 7.63 (1H, t, –NH), 7.96 (1H, d, J = 16.0 Hz). HREIMS m/z 299.1160 (calcd for C17H17NO4, 299.1158).

N-trans-m-Coumaroyldopamine (PA2): colorless oil; yield 40%. IR (film)max 3400, 1610, 1500, 1200 cm−1. 1H-NMR (acetone-d6): δ 2.71 (2H, t, J = 7.2 Hz), 3.51 (2H, m), 6.56 (1H, dd, J = 8.0, 2.0 Hz), 6.76 (1H, dd, J = 8.0, 2.0 Hz), 6.85 (1H, m), 7.02 (1H, d, J = 15.8 Hz), 7.03 (1H, d, J = 2.0 Hz), 7.19 (1H, t, –NH), 7.51 (1H, d, J = 15.8 Hz). HREIMS m/z 299.1166 (calcd for C17H17NO4, 299.1158).

N-trans-Feruloyldopamine (PA3): colorless oil; yield 48%. IR (film)max 3400, 1650, 1600, 1515, 1200 cm−1. 1H-NMR (acetone-d6): δ 2.69 (2H, t, J = 7.0 Hz), 3.48 (2H, q, J = 7.0 Hz), 3.85 (3H, s, –OCH3), 6.51 (1H, d, J = 15.5 Hz), 6.55 (1H, dd, J = 8.0, 2.0 Hz), 6.73 (1H, d, J = 8.0 Hz), 6.73 (1H, d, J = 2.0 Hz), 6.82 (1H, d, J = 8.0 Hz), 7.02 (1H, dd, J = 8.0, 2.0 Hz), 7.14 (1H, d, J = 2.0 Hz), 7.28 (t, br, –NH), 7.45 (1H, d, J = 15.5 Hz). HREIMS m/z 329.1261 (calcd for C18H19NO5, 329.1263).

N-trans-p-Coumaroyldopamine (PA4): colorless oil; yield 31%. IR (film)max 3400, 1650, 1600, 1515, 1210 cm−1. 1H-NMR (acetone-d6): δ 2.69 (1H, t, J = 7.3 Hz), 3.49 (3H, m), 6.50 (1H, d, J = 15.7 Hz), 6.55 (2H, dd, J = 8.0, 2.0 Hz), 6.85 (2H, dd, J = 8.0, 2.0 Hz), 7.40 (2H, m), 7.49 (1H, d, J = 15.7 Hz). HREIMS m/z 299.1154 (calcd for C17H17NO4, 299.1158).

N-trans-Feruloyl-3-methyldopamine (PA5): white solid; Mp 154–157 °C; yield 58%. IR (KBr)max 3400, 1650, 1520, 1210, 1100 cm−1. 1H-NMR (acetone-d6): δ 2.75 (2H, t, J = 7.0 Hz), 3.50 (2H, q, J = 7.0 Hz), 3.81 (3H, s), 3.87 (3H, s), 6.49 (1H, d, J = 15.5 Hz), 6.67 (1H, dd, J = 8.0, 2.0 Hz), 6.73 (1H, d, J = 8.0 Hz), 6.82 (1H, d, J = 8.0 Hz), 6.84 (1H, d, J = 2.0 Hz), 7.03 (1H, dd, J = 8.0, 2.0 Hz),7.13 (1H, t, br), 7.15 (1H, d, J = 2.0 Hz), 7.43 (1H, d, J = 15.5 Hz). HREIMS m/z 343.1417 (calcd for C19H21NO5, 343.1420).

N-trans-Feruloyl-4-methyldopamine (PA6): colorless oil; yield 43%. IR (film)max 3400, 1600, 1510, 1210, 1200 cm−1. 1H-NMR (acetone-d6): δ 2.72 (2H, t, J = 7.0 Hz), 3.49 (2H, q, J = 7.0 Hz), 3.80 (3H, s), 3.87 (3H, s), 6.49 (1H, d, J = 15.5 Hz), 6.65 (1H, dd, J = 8.0, 2.0 Hz), 6.73 (1H, d, J = 2.0 Hz), 6.82 (1H, d, J = 8.0 Hz), 6.84 (1H, d, J = 8.0 Hz), 7.03 (1H, dd, J = 8.0, 2.0 Hz), 7.15 (1H, d, J = 2.0 Hz), 7.16 (1H, t, br), 7.43 (1H, d, J = 15.5 Hz). HREIMS m/z 343.1417 (calcd for C19H21NO5, 343.1420).

N-trans-Isoferuloyl-dopamine (PA7): yellow oil; yield 37%. IR (film)max 3400, 1650, 1510, 1270 cm−1. 1H-NMR (acetone-d6): δ 2.69 (2H, t, J = 7.0 Hz), 3.48 (2H, q, J = 7.0 Hz), 3.85 (3H, s, –OCH3), 6.49 (1H, d, J = 15.5 Hz), 6.55 (1H, dd, J = 8.0, 2.0 Hz), 6.73 (1H, d, J = 8.0 Hz), 6.72 (1H, d, J = 2.0 Hz), 6.92 (1H, d, J = 8.5 Hz), 6.98 (1H, dd, J = 8.5, 2.0 Hz), 7.06 (1H, d, J = 2.0 Hz), 7.34 (1H, t, –NH), 7.43 (1H, d, J = 15.5 Hz). HREIMS m/z 329.1284 (calcd for C18H19NO5, 329.1263).

N-trans-Isoferuloyl-3-methyldopamine (PA8): white solid; Mp 176–178 °C; yield 62%. IR (KBr)max 3400, 1650, 1600, 1550, 1200 cm−1. 1H-NMR (CD3OD): δ 2.76 (2H, t, J = 7.5 Hz), 3.47 (2H, t, J = 7.5 Hz), 3.82 (3H, s), 3.87 (3H, s), 6.38 (1H, d, J = 16.0 Hz), 6.66 (1H, dd, J = 8.0, 2.0 Hz), 6.71 (1H, d, J = 8.0 Hz), 6.81 (1H, d, J = 2.0 Hz), 6.91 (1H, d, J = 8.5 Hz), 6.98 (1H, dd, J = 8.5, 2.0 Hz), 7.02 (1H, d, J = 2.0 Hz), 7.40 (1H, d, J = 16.0 Hz). HREIMS m/z 343.1429 (calcd for C19H21NO5, 343.1420).

N-trans-Isoferuloyl-4-methyldopamine (PA9): white solid; Mp 163–165 °C; yield 56%. IR (KBr)max 3300, 1650, 1515, 1250, 1200 cm−1. 1H-NMR (acetone-d6): δ 2.72 (2H, t, J = 7.0 Hz), 3.49 (2H, q, J = 7.0 Hz), 3.80 (3H, s), 3.85 (3H, s), 6.47 (1H, d, J = 16.0 Hz), 6.65 (1H, dd, J = 8.5, 2.0 Hz), 6.83 (1H, d, J = 8.5 Hz), 6.93 (1H, d, J = 8.5 Hz), 6.99 (1H, dd, J = 8.5, 2.0 Hz), 7.03 (1H, d, J = 2.0 Hz), 7.22 (1H, t, –NH), 7.41 (1H, d, J = 16.0 Hz). HREIMS m/z 343.1430 (calcd for C19H21NO5, 343.1420).

N-trans-O-Coumaroyl-3-methyldopamine (PA10): colorless oil; yield 48%. IR (film)max 3400, 1655, 1600, 1510, 1250, 1200 cm−1. 1H-NMR (acetone-d6): δ 2.78 (2H, t, J = 7.3 Hz), 3.54 (1H, m), 3.78 (3H, s, –OCH3), 6.66 (1H, d, J = 8.0 Hz), 6.67 (1H, d, J = 8.0 Hz), 6.76 (1H, d, J = 8.0 Hz), 6.81 (1H, d, J = 16.0 Hz), 7.01 (1H, d, J = 8.0 Hz), 7.14 (1H, dd, J = 8.0, 2.0 Hz), 7.46 (1H, d, J = 8.0 Hz), 7.66 (1H, t, –NH), 7.93 (1H, d, J = 16.0 Hz). HREIMS m/z 313.1334 (calcd for C18H19NO4, 313.1314).

N-trans-m-Coumaroyl-3-methyldopamine (PA11): colorless oil; yield 35%. IR (film)max 3400, 1655, 1610, 1510, 1250, 1200 cm−1. 1H-NMR (acetone-d6): δ 2.76 (2H, t, J = 7.3 Hz), 3.52 (2H, m), 3.79 (3H, s, –OCH3), 6.61 (1H, –NH), 6.65 (1H, d, J = 8.0 Hz), 6.66 (1H, d, J = 8.0 Hz), 6.74 (1H, d, J = 8.0 Hz), 6.85 (2H, m), 7.01 (2H, m), 7.19 (1H, d, J = 8.0 Hz), 7.48 (1H, d, J = 16.0 Hz). HREIMS m/z 313.1324 (calcd for C18H19NO4, 313.1314).

N-trans-p-Coumaroyl-3-methyldopamine (PA12): colorless oil; yield 40%. IR (film)max 3400, 1650, 1600, 1510, 1270, 1210 cm−1. 1H-NMR (acetone-d6): δ 2.75 (2H, t, J = 7.2 Hz), 3.51 (2H, m), 3.80 (3H, s, –OCH3), 6.49 (1H, d, J = 15.5 Hz), 6.64 (1H, d, J = 2.0 Hz), 6.69 (1H, dd, J = 8.0, 2.0 Hz), 6.76 (1H, d, J = 2.0 Hz), 6.82 (3H, m), 7.32 (1H, t, –NH), 7.41 (2H, m), 7.52 (1H, d, J = 15.5 Hz). HREIMS m/z 313.1332 (calcd for C18H19NO4, 313.1314).

N-trans-o-Coumaroyl-4-methyldopamine (PA13): yellow oil; yield 30%. IR (film)max 3400, 1650, 1600, 1500, 1210 cm−1. 1H-NMR (acetone-d6): δ 2.74 (2H, t, J = 7.3 Hz), 3.51 (2H, m), 3.79 (3H, s, –OCH3), 6.66 (1H, dd, J = 8.0, 2.0 Hz), 6.73 (1H, d, J = 15.8 Hz), 6.75 (1H, d, J = 2.0 Hz), 6.82 (1H, d, J = 15.8 Hz), 6.83 (1H, d, J = 8.0 Hz), 6.95 (1H, dd, J = 8.0, 2.0 Hz), 7.17 (1H, m), 7.40 (1H, t, –NH), 7.46 (1H, dd, J = 8.0, 2.0 Hz), 7.89 (1H, d, J = 15.8 Hz). HREIMS m/z 313.1318 (calcd for C18H19NO4, 313.1314).

N-trans-m-Coumaroyl-4-methyldopamine (PA14): colorless oil; yield 33%. IR (film)max 3400, 1650, 1610, 1500, 1250, 1210 cm−1. 1H-NMR (acetone-d6): δ 2.73 (2H, t, J = 7.3 Hz), 3.50 (2H, m), 3.78 (3H, s, –OCH3), 6.63 (1H, d, J = 2.0 Hz), 6.64 (1H, d, J = 15.7 Hz), 6.75 (1H, d, J = 2.0 Hz), 6.85 (1H, m), 7.00 (1H, d, J = 8.0 Hz), 7.04 (1H, d, J = 8.0 Hz), 7.19 (1H, t, J = 8.0 Hz), 7.43 (1H, d, J = 15.7 Hz). HREIMS m/z 313.1307 (calcd for C18H19NO4, 313.1314).

N-trans-p-Coumaroyl-3-methyldopamine (PA15): white solid; Mp 188–190 °C; yield 40%. IR (film)max 3400, 1600, 1510, 1500, 1215 cm−1. 1H-NMR (acetone-d6): δ 2.71 (2H, t, J = 7.3 Hz), 3.48 (2H, m), 3.79 (3H, s), 6.47 (1H, d, J = 15.7 Hz), 6.65 (1H, dd, J = 8.0, 2.0 Hz), 6.73 (1H, d, J = 2.0 Hz), 6.81 (1H, d, J = 2.0 Hz), 6.86 (1H, m), 7.28 (1H, –NH), 7.43 (1H, d, J = 8.0 Hz), 7.55 (1H, d, J = 15.7 Hz). HREIMS m/z 313.1318 (calcd for C18H19NO4, 313.1314).

2.4. In vitro assays

2.4.1. LDL lipid peroxidation assay. Blood samples were collected from healthy male adults after a 12 h overnight fasting. Sera were fractionated by ultracentrifugation (Beckman L8-80 M; R50 rotor) with the density adjusted by NaBr, to give LDL fractions (1.019 < d < 1.063 g mL−1). To remove water-soluble antioxidants and NaBr, LDL (1.5 mg mL−1) containing fractions (3–5 mL) were dialyzed extensively (at 4 °C/N2) against phosphate buffer saline (PBS, 50 mM; pH 7.4) in darkness. Dialyzed LDL was used for the assay as soon as possible.12 After dialysis, LDL was diluted with PBS to 0.9 mg cholesterol per mL. 50 μL aliquots of LDL in each well of a 96-well microtiter plate were incubated with CuSO4 (final conc. 10 μM) at 37 °C to induce lipid peroxidation. In a routine assay, incubation was carried out in the atmosphere at 37 °C for 2 h (in a gyro-rotary incubator shaker at 120 × g). For screening, LDL was pre-incubated with the test compounds at 37 °C for 1 h before adding Cu2+. After the test compounds were added, the mixture was incubated at 37 °C for another 1 h. LDL oxidation was started by adding Cu2+. Probucol (10 μM) was used as a positive control.13 Routinely, the time course of conjugated diene formation was also determined by following the increase of the UV absorption at 232 nm. Prolongation of the lag phase was present in LDL oxidation with Cu2+. The lag phase and rate of oxidation of LDL are dependent on the lipophilic antioxidant content, particularly α-tocopherol and polyunsaturated fatty acids in LDL which may vary among individual donors.
2.4.2. Determination of DPPH free radical scavenging activity. Scavenging radical potency was evaluated using the DPPH test.14 The different test compounds were dissolved in ethanol. DPPH in ethanol (40 mg L−1, 750 μL) was added to 750 μL of the test compounds at different concentrations in ethanol. Each mixture was then shaken vigorously and held for 30 min at room temperature and in the dark. The reaction mixture was taken in 96-well microtiter plates (Molecular Devices, USA). The decrease in absorbance of DPPH at 517 nm was measured. A blank is realized in the same conditions with 750 μL of ethanol. α-Tocopherol were used as a positive control. All tests were performed in triplicate. Percent radical scavenging activity by compound treatment was determined by comparison with a deionized water-treated control group. IC50 values denote the concentration of compound which is required to scavenge 50% DPPH free radicals. The percentage of DPPH decolouration is calculated as follows: inhibition DPPH (%) = 1 − (absorbance with compound/absorbance of the blank) × 100. A plot of absorbance vs. concentration was made to establish the standard curve and to calculate IC50 (range from 0.001 to 0.000001 M).
2.4.3. ORAC assay. The ORAC assay was conducted as reported previously15 with slight modifications. Briefly, a microplate equipped with an incubator and wavelength-adjustable fluorescence filters was used to monitor the reaction. The temperature of the incubator was set at 37 °C, and fluorescence filters with excitation wavelength of 480 nm and emission wavelength of 525 nm were used. AAPH was used as peroxyl generator and Trolox was used as a antioxidant standard. Twenty microliters of suitably diluted samples, blank, and Trolox calibration solutions were loaded to clear polystyrene 96-well microplates in triplicate based on a randomized layout. The plate reader was programmed to record the fluorescence of fluorescein every cycle. Kinetic readings were recorded for 60 cycles with 40 s per cycle setting. Trolox standards were prepared with PBS (75 mM, pH 7.0), which was used as blank. The samples were diluted with PBS (75 mM, pH 7.0) to the proper concentration range to fit the linearity range of the standard curve. After loading 20 μL of sample, standard and blank, and 200 μL of the fluorescein solution into appointed wells according to the layout, the microplate (sealed with film) was incubated for at least 30 min in the plate reader, then 20 μL of peroxyl generator AAPH (3.2 μM) was added to initiate the oxidation reaction. The final ORAC values were calculated using a linear equation between the Trolox standards or sample concentration and net area under the fluorescence decay curve. The data were analyzed using Microsoft Excel (Microsoft, Roselle, U.S.A.). The area under the curve (AUC) was calculated as AUC = 0.5 + (R2/R1 + R3/R1 + … + 0.5 Rn/R1), where R1 was the fluorescence reading at the initiation of the reaction and Rn was the last measurement. The net AUC was obtained by subtracting the AUC of the blank from that of a sample or standard. The ORAC value was expressed as micro moles of Trolox equivalent per gram sample (μmol TE g−1) using the calibration curve of Trolox. The linearity range of the calibration curve was 0 to 100 μM (r = 0.99). For each specific sample, triplicate extractions were performed.
2.4.4. Evaluation of O2 release by polymorphonuclear leukocytes (PMNs). PMNs were isolated from the venous blood16 of consenting healthy volunteers (20–35 years) by double-gradient Ficoll-Hypaque centrifugation and hypotonic lysis of contaminating red blood cells as previously described.17 The cells were counted on a hemocytometer. PMN cells (1 × 10⁶ cells per mL) pretreated with the various test agents (100 μM L−1) at 37 °C for 5 min were stimulated with fMLP (1 μM) or PMA (0.16 μM) in the presence of lucigenin (0.48 mM). The reaction mixtures were then transferred to 96-well microplates and incubated at 37 °C for 15 min. Extracellular O2 production was assessed with a luminometer. Chemiluminescence generated by PMA and fMLP alone respectively served as the reference controls. The percentage of superoxide inhibition of the test compound was calculated as the percentage of inhibition = {(control − resting) − (compound − resting)} ÷ (control − resting) × 100.
2.4.5. Chemiluminescence with X/XO system. The reaction was carried out in a reaction mixture of 200 μL containing 120 μL of 50 mM Tris (pH 7.4), 48 μL of 2 mM lucigenin, and the various test compounds (100 μM). Subsequently, 8 μL of XO (0.02 U mL−1) was added. The reaction was immediately started by the auto-injection of 24 μL of X (0.17 M). The superoxide-induced lucigenin chemiluminescence was measured using a luminometer (victor3; Perkin Elmer). Activities of test compounds were calculated using the xanthine-inhibiting part of the chemiluminescence signal.18 The results were expressed as percentages of inhibition enzyme activity.

2.5. In vivo assays

2.5.1. Animals. Male Sprague-Dawley rats, weighing 260–270 g, were purchased from the National Laboratory Animal Center. They were kept in an air-conditioned room (23 ± 1 °C, 50–60% humidity) light for 12 h per day (7 AM to 7 PM). Our Institutional Animal Care and Use Committee approved the protocols for the animal study, and the animals were cared for in accordance with the institutional ethical guideline. After acclimatizing for 2 weeks with a commercial non-purified diet (rodent Laboratory Chow 5001, Purina Co., USA), 40 rats were divided into five groups of eight rats each. The diets were synthesized as described previously19 and included: control diet, PA1 diet (1% PA1 in diet), PA1 diet (2% PA1), α-tocopherol diet (1% α-tocopherol) and α-tocopherol diet (2% α-tocopherol) for 8 weeks. On week 8, the rats were weighed and anesthetized with diethyl ether. Blood was obtained by heart puncture with syringes.

Plasma was collected by centrifugation (1000g × 15 min) from the blood and analyzed using a Merck VITALAB Selectra Biochemical Autoanalyzer (Merck, Germany) to determine aspartate transferase (AST), alanine transferase (ALT) and alkaline phosphatase (ALP). The livers of the rats were quickly excised and weighed. Relative ratios of liver weight to body weight were obtained. The liver was stored at −40 °C for glutathione peroxidase (GSH-Px) and thiobarbituric acid reactive substance (TBARS) determinations.

2.5.2. Antioxidant activities. A 0.5 g sample of liver tissue was dissected, weighed, immersed in liquid N2 for 60 s, and kept frozen at −70 °C. Prior to enzyme determinations, thawed tissue samples were homogenized on ice in 50 mM phosphate buffer (pH 7.4) and centrifuged at 3200 × 3g for 20 min at 5 °C. The supernatant was collected for antioxidant enzyme determinations.
I Determination of CAT activity. The liver homogenate was dissolved in 1.0 mL of a 0.25 M sucrose buffer. Ten microliters of the liver homogenate solution was added to a cuvette containing 2.89 mL of a 50 mM potassium phosphate buffer (pH 7.4), then the reaction was initiated by adding 0.1 mL of 30 mM H2O2 to make a final volume of 3.0 mL at 25 °C. The decomposition rate of H2O2 was measured at 240 nm for 5 min to measure CAT activity. The activity was defined as the μmol min−1 mg−1 weight liver.20
II Determination of SOD activity. One hundred microliters of the cytosol supernatant was mixed with 1.5 mL of a Tris-EDTA–HCl buffer (pH 8.5) and 100 μL of 15 mM pyrogallol, and then incubated at 25 °C for 10 min. The reaction was terminated by adding 50 μL of 1 N HCl and the absorbance at 440 nm. One unit was determined as the amount of enzyme that inhibited the oxidation of pyrogallol by 50%. Hepatic SOD activity was expressed as units per mg protein.21
III Determination of GSH-Px. Glutathione peroxidase (GSH-Px) levels were measured using glutathione peroxidase assay kits (Calbiochem, Inc., San Diego, CA, USA). An equal volume of ice cold 10% metaphosphoric acid was added to the liver preparations. Supernatants were collected after centrifugation at 1000 rpm for 10 min and analyzed for GSH-Px as per manufacturer’s instruction and expressed as unit per mg protein.22
IV TBARS concentration. The liver tissue was homogenized, the subcellular fractions and thiobarbituric acid (TBA) were incubated in boiling water for 30 min, centrifuged at 1000 × g for 25 min, and the supernatant was subsequently measured with a spectrophotometer (Hitachi, Japan) at 532 nm. TBARS concentration was expressed as nmol malondialdehyde (MDA) g−1 liver or mL−1 serum.23
2.5.3. Determination total protein. Protein content in each sample was determined by a bicinchoninic acid (BCA) protein assay kit (Pierce).
I Determination of serum TNF-α and NF-κB level by ELISA. Serum levels of TNF-α and NF-κB were determined using a commercially available enzyme linked immunosorbent assay (ELISA) kit (Biosource International Inc., Camarillo, CA) according to the manufacturer’s instruction. The concentrations of TNF-α and NF-κB were determined by using a standard curve. The concentrations were both expressed by pg mg−1 protein.
II Determination of nitric oxide/nitrite level. NO concentrations were indirectly assessed by measuring the nitrite levels in serum determined by a calorimetric method based on the Griess reaction. Serum samples were diluted four times with distilled water and deproteinized by adding 1/20 volume of zinc sulphate (300 g L−1) to a final concentration of 15 g L−1. After centrifugation at 10[thin space (1/6-em)]000g for 5 min at room temperature, 100 μL supernatant was applied to a microtiter plate well, followed by 100 μL of Griess reagent (1% sulphanilamide and 0.1% N-1-naphthylethylenediamine dihydrochloride in 2.5% polyphosphoric acid). After 10 min of colour development at room temperature, the absorbance was determined at 540 nm with a Micro-Reader (Molecular Devices, Orleans Drive, Sunnyvale, CA). By using sodium nitrite to generate a standard curve, the concentration of nitrite was determined at 540 nm.

2.6. Statistical analysis

All values in the text and figures are given as means ± S.E.M. Data are analyzed by one-way analyses of variance (ANOVA) depending on the number of experimental variables followed by post hoc Dunnett’s t-test for multiple comparisons. Concentration dependence was analyzed by simple linear regression analysis of response levels against concentrations of compounds and testing the slope of the regression line against 0 by Student’s t-test. Values of human neutrophils p < 0.05 were considered significant.

3. Results and discussion

3.1. In vitro evaluations

3.1.1. Inhibition of LDL oxidation activity. An elevated concentration of plasma LDL is a major risk factor for atherosclerosis. LDL oxidation can be studied in vitro by following the generation of oxidation products during Cu2+ catalysed oxidation.24 The in vitro oxidation may reflect in vivo oxidation as the resistance of LDL towards in vitro oxidation has been found to be correlated with the extent of coronary atherosclerosis.25 Antioxidant activity was based on the inhibition of conjugated diene formation. It has been documented that Cu2+ induced Ox-LDL exhibits biological and immunological properties similar to those in vivo. Cu2+-induced Ox-LDL is recognizable by scavenger receptors and causes cholesterol ester accumulation in macrophages.26 In screening for antioxidants to inhibit LDL oxidation, this method is simple and commonly used. Antioxidants able to inhibit LDL oxidation may reduce early atherogenesis and slow down the progression to advanced stages. Probucol is a lipid-lowering drug which can inhibit LDL oxidation and reduce atherosclerosis in experimental animals and was used as a reference antioxidant on inhibition of LDL oxidation.27

The IC50 values of PA1–PA15 in the inhibition of Cu2+-induced LDL lipid oxidation are shown in Table 2. Compounds PA1, PA3, PA5, PA7, PA9 and PA10 showed higher activities for inhibition of Cu2+-induced LDL oxidation than the control antioxidant of probucol. When phenolics function as antioxidants by direct radical scavenging mechanisms, they are univalently oxidized to their respective phenoxyl radicals.28 However, until recently, these radicals had been difficult to detect by static electron spin resonance (ESR) because they rapidly change to non-radical products.

Table 2 The IC50 valuea of phenolic amides (PA1–PA15) in the inhibition of Cu2+-induced LDL lipid oxidation
Compound LDL oxidation IC50a (μM) Rel. potency to probucolc
a Results of inhibition LDL oxidation are expressed as mean ± S.E.M. from three experiments with duplicated determination, where human blood samples were taken as the test sources. Each IC50 value indicated the concentration of compounds required to inhibit the formation of conjugated diene in Cu2+-induced LDL oxidation by 50%.b Probucol was used as a positive control drug.c The relative potency of each compound was expressed as IC50 (probucol)/IC50 (compound). For a compound exhibiting equal relative potency the value was set as 1.0. Since the IC50 values are LDL dependent, the IC50 of probucol in the same LDL preparation used for the assay is also included.
PA1 3.2 ± 0.3 1.3 ± 0.2
PA2 3.7 ± 0.2 1.0 ± 0.1
PA3 5.0 ± 0.8 1.1 ± 0.1
PA4 3.6 ± 0.1 0.8 ± 0.1
PA5 3.3 ± 0.4 1.4 ± 0.0
PA6 7.1 ± 0.5 0.5 ± 0.3
PA7 4.0 ± 0.7 1.2 ± 0.1
PA8 9.9 ± 1.0 0.4 ± 0.2
PA9 2.9 ± 0.1 1.4 ± 0.2
PA10 3.1 ± 0.4 1.3 ± 0.1
PA11 5.9 ± 1.1 1.0 ± 0.1
PA12 5.8 ± 1.2 0.4 ± 0.1
PA13 4.1 ± 0.6 0.7 ± 0.1
PA14 3.0 ± 0.3 0.7 ± 0.1
PA15 2.8 ± 0.3 1.0 ± 0.1
Probucolb 3.9 ± 0.2 1.0


3.1.2. Effect of DPPH and ORAC activity. The DPPH assay is one of the strategies used to evaluate the antioxidant properties of plant extracts; this method has been shown to be rapid and simple and it measures the capacity of plant extract to scavenge the DPPH radical, a nitrogen-centred free radical.29 The structural changes that this radical provoke on plant principles as well as the involved mechanism are not clear yet.30

Oxidative stress represents an imbalance between the production and manifestation of reactive oxygen species and a biological system’s ability to readily detoxify the reactive intermediates or to repair the resulting damage. Disturbances in the normal redox state of tissues can cause toxic effects through the production of peroxides and free radicals that damage all components of the cell, including proteins, lipids, and DNA. Some reactive oxidative species can even act as messengers through a phenomenon called redox signaling.

The effect of the PA derivatives scavenging activity on the DPPH radicals was investigated. To perform the DPPH assay, a solution of the purple coloured DPPH radical was mixed with the test compound and the decrease of the absorption was determined photometrically until a steady state was reached. The concentration of phenolic acids and DPPH ethanolic solutions were 1.0 × 10⁻⁴ (Table 3). The ORAC assay has been used to study the antioxidant capacity of many compounds and food samples.15 ORAC antioxidant capacity of PAs ranged from 21.57 μmol TE g−1 to 49.23 μmol TE g−1, the values obtained are shown in Table 3.

Table 3 Scavenging activity of antioxidants for DPPH radicala and ORAC; data are shown asb IC50 (μM) and percentage inhibition at 0.1 M of antioxidantsc
Compound Inhibition, % (±S.E.M.) IC50 (M) Relative potencyd Antioxidant capacity (μmol TE g−1)
a The final concentration of DPPH ethanolic solution was 1.0 × 10⁻⁴ M.b The IC50 (M) values were calculated from the slope equations of the dose–response curves.c Values are expressed as mean ± S.E.M. from three independent experiments. Values with different superscripts are significant difference (p < 0.05).d The relative potency of each compound was expressed as IC50 (α-tocopherol)/IC50 (compound). α-Tocopherol, relative potency value was set as 1.0.
α-Tocopherol 51.0 ± 0.1 9.68 × 10⁻⁵ 1.0 32.56 ± 1.16
PA1 78.3 ± 0.1 2.78 × 10⁻⁵ 3.48 49.23 ± 2.26
PA2 73.8 ± 0.1 3.64 × 10⁻⁵ 2.66 41.52 ± 0.32
PA3 72.8 ± 0.1 4.54 × 10⁻⁵ 2.13 42.21 ± 0.15
PA4 24.1 ± 0.3 4.06 × 10⁻⁴ 0.24 23.21 ± 0.23
PA5 63.9 ± 0.1 6.98 × 10⁻⁵ 1.39 35.78 ± 1.16
PA6 42.7 ± 0.1 1.65 × 10⁻⁴ 0.59 26.62 ± 0.21
PA7 76.0 ± 0.5 3.45 × 10⁻⁵ 2.81 45.58 ± 0.23
PA8 45.4 ± 0.2 1.55 × 10⁻⁴ 0.63 22.32 ± 0.23
PA9 33.5 ± 0.4 2.88 × 10⁻⁴ 0.34 23.52 ± 1.26
PA10 38.9 ± 0.4 2.17 × 10⁻⁴ 0.45 27.63 ± 0.21
PA11 31.5 ± 1.1 8.74 × 10⁻⁴ 0.11 26.23 ± 0.15
PA12 33.7 ± 0.6 2.79 × 10⁻⁴ 0.35 22.32 ± 0.13
PA13 28.4 ± 1.2 3.48 × 10⁻⁴ 0.28 21.57 ± 0.20
PA14 33.8 ± 0.3 2.79 × 10⁻⁴ 0.35 25.65 ± 1.13
PA15 38.0 ± 0.3 2.25 × 10⁻⁴ 0.43 23.78 ± 0.22


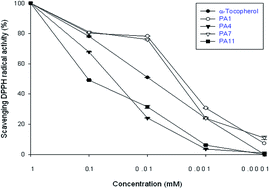
These compounds also possess a direct scavenger effect on trapping DPPH radicals. α-Tocopherol (the lipid soluble vitamin E analogue) was used as a positive control in the study. We also found that some of the PAs (compounds PA1–PA3, PA5 and PA7) were better than α-tocopherol. PA1 was the most potent compound, nearly 3.5 times as potent as α-tocopherol, compounds PA2, PA3 and PA7 also reduced DPPH radicals and are efficient radical scavengers and antioxidants and more effective as radical scavengers when compared with the standard α-tocopherol than compounds PA4 and PA11 (Fig. 1). The investigated amides are equal or more potent antioxidants for soybean and evening primrose oil with respect to α-tocopherol. They are able to protect squalene against oxidation fairly well, but are inferior to classic antioxidants like α-tocopherol. From these results we observe that the radical scavenging activity increased with increasing numbers of hydroxy groups on the catechol moiety in this series of phenolic amides.


image file: c5ra14137k-f1.tif
Fig. 1 Selected compounds PA1, PA4, PA7 and PA11 showed a dose-dependent manner in scavenging activity of DPPH radical. Each point is expressed as mean ± S.E.M. of triplicate.

Catechol is a polyhydroxy organic compound, which is widely used in industry. It is able to form adjacent hydrogen bonds with proton acceptors that can significantly affect its reactivity and antioxidant capacity. The UV light had a synergistic effect on decomposing H2O2 to produce reactive species for catechol oxidation. In catechol oxidation under initial pH of 7.0, formic acid, acetic acid, oxalic acid, and maleic acid were produced and caused solution pH decrease to acidic condition favorable for high oxidation performance.31,32

3.1.3. Evaluation of superoxide anion release by human neutrophils and scavenger of superoxide radicals in the X/XO system. The effect of the PA derivatives on superoxide generation in human neutrophils was investigated. Superoxide anion production was induced by PMA or fMLP, respectively and detected by lucigenin chemiluminescence. Neutrophilic superoxide generation has been linked to various types of inflammation. Superoxide generation in human neutrophils is stimulated during phagocytosis or exposure to various stimuli.33 Superoxide anion production induced by PMA or fMLP with different mechanisms and detected by lucigenin chemiluminescence is carried in this study.34

In our recent results, we found phenolic acids and their ester derivatives display potent anti-inflammatory activity against PMA and fMLP-induced superoxide anion production.35 Here we also determined the activity of PAs in human neutrophil superoxide anion production. The inhibitory effect on the PMA-induced superoxide generation by PAs was PA8 (35.4%) > PA12 (33.9%) > PA10 (25%) and the fMLP-induced was PA2 (74.3%) > PA9 (70.1%) > PA8 (55.3%) (Table 4). Compounds PA3, PA5 and PA9 gave no effect and others showed only a slight effect on PMA-induced response. Most of these phenolic amides were able to affect fMLP-induced superoxide generation. Therefore, we assume that these PAs preferentially inhibited fMLP-induced superoxide generation indicating a calcium-dependent signaling pathway rather than a PKC-dependent mechanism.

Table 4 Inhibition (%) of phenolic amides (PA1–PA15) on PMA- or fMLP-induced superoxide generation in human neutrophils and scavenging superoxide by xanthine/xanthine oxidase systema
Compound PMA fMLP Xanthine/xanthine oxidase
a The cells were preincubated with 100 μmmol L−1 of compounds for 5 min prior to the addition of PMA (0.16 μmmol L−1) or fMLP (1.0 μmmol L−1). Results are expressed as mean ± S.E.M. from six independent experiments.
PA1 15.2 ± 4.9 52.4 ± 14.1 41.6 ± 1.7
PA2 16.2 ± 7.1 74.3 ± 10.6 27.6 ± 1.3
PA3 No effect 43.0 ± 8.6 14.4 ± 7.2
PA4 8.3 ± 4.1 13.9 ± 7.2 36.2 ± 1.9
PA5 No effect 9.2 ± 5.2 36.7 ± 2.5
PA6 15.7 ± 4.5 33.1 ± 1.3 8.5 ± 2.6
PA7 11.3 ± 6.3 23.7 ± 8.9 No effect
PA8 35.4 ± 7.4 55.3 ± 3.4 No effect
PA9 No effect 70.1 ± 1.1 2.3 ± 0.2
PA10 25.0 ± 2.2 47.7 ± 13.0 No effect
PA11 15.8 ± 7.8 48.2 ± 3.9 No effect
PA12 33.9 ± 8.2 50.7 ± 2.2 2.0 ± 0.5
PA13 8.9 ± 3.9 32.5 ± 3.6 9.7 ± 0.1
PA14 7.7 ± 2.1 14.8 ± 1.3 6.0 ± 0.5
PA15 21.9 ± 1.9 17.2 ± 5.0 17.9 ± 0.9


Superoxide is generated in vivo by several mechanisms including the activation of neutrophils and by the action of X/XO, the XO enzyme is a physiological source of superoxide anions in eukaryotic cells.

Using the X/XO system, the superoxide scavenging capacity was evaluated by chemiluminescence. In an earlier study, we found phenolic acids slightly inhibited superoxide in the X/XO system. Compounds PA1 (41.6%), PA4 (36.2%) and PA5 (36.7%) showed efficient inhibitory action on scavenging superoxide production by the X/XO system, but PA7, PA8, PA10 and PA11 did not show a direct quenching effect on the lucigenin signals (Table 4).

3.2. Antioxidant and anti-inflammatory effect in rats

The hepatic antioxidant enzyme activities of SOD and CAT were increased in the liver of rats treated with PA1 and the α-tocopherol treated model group, however, the activities of SOD and CAT of PA1 (2%) group were better than PA1 (1%), α-tocopherol (1%) and α-tocopherol (2%) groups. As shown in Table 5, the hepatic GSH-Px level was significantly (p < 0.05) increased in the PA1 (2%) treatment group when compared with the PA1 (1%), α-tocopherol (1%) and α-tocopherol (2%) groups.
Table 5 Effect of PA1 and α-tocopherol on SOD, CAT, GPx, GR, TNF-α, NF-κB and NO levels in SD rats
Levela Controlb PA1dcd (1%) PA1 (2%) α-Tocopherol (1%) α-Tocopherol (2%)
a SOD: superoxide dismutase, CAT: catalase, GSH-Px: glutathione peroxidase, TBARS: thiobarbituric acid reactive substances, TNF-α: tumor necrosis factor-alpha, NF-κB: nuclear factor-kappa B, NO: nitric oxide.b Different letters (a–c) in the same group denote a significant difference between the control and the treated groups (p < 0.05).c 1% at doses of 16.67 mg kg−1, 2% at doses of 33.34 mg kg−1.d Synthesis of PA1.image file: c5ra14137k-u2.tif
SOD (unit per mg weight liver) 1.15 ± 0.08a 1.69 ± 0.05b 1.83 ± 0.06c 1.46 ± 0.07b 1.57 ± 0.06b
CAT (μmol min−1 mg−1 weight liver) 125 ± 11a 157 ± 16b 188 ± 15c 146 ± 13b 153 ± 15b
GSH-Px (μM g−1 weight liver) 36.5 ± 6.7a 65.5 ± 55.2b 89.5 ± 7.2c 68.5 ± 5.6b 73.6 ± 6.5b
TBARS (nM mL−1 weight liver) 0.027 ± 0.001a 0.022 ± 0.02b 0.018 ± 0.001c 0.022 ± 0.001b 0.021 ± 0.002b
TBARS (nM mL−1 weight plasma) 1.92 ± 0.06a 1.58 ± 0.05b 1.23 ± 0.03c 1.52 ± 0.05b 1.47 ± 0.06b
TNF-α (pg mL−1) 88 ± 2c 77 ± 6b 66 ± 5a 75 ± 3b 69 ± 7b
NF-κB (pg mL−1) 95 ± 5c 76 ± 2b 69 ± 3a 73 ± 6b 61 ± 2b
NO (μm) 5.3 ± 0.1b 4.6 ± 0.2a 4.3 ± 0.3a 4.3 ± 0.5a 4.2 ± 0.3a


SOD, CAT and GSH-Px play the role of eliminating free radicals in vivo. A great deal of research has indicated that when organism suffers from oxidative damage, its antioxidant mechanism would be activated because of the oxidation pressure, causing considerable expression of antioxidant enzymes.

The effect of anti-inflammatory action of PA1 and α-tocopherol on the serum levels of TNF-α, NF-κB and NO in rats was studied. As shown in Table 5, the PA1 and α-tocopherol treatment group caused a significant (p < 0.05) decrease in the level of TNF-α/NF-κB in the serum when compared with the control group. Mice treated with PA1 (2%) also showed a significant (p < 0.05) decrease of NO production in serum compared with the PA1 (1%), α-tocopherol (1%) and α-tocopherol (2%) groups, the production of NO in the model group serum was significantly decreased in the PA1 and α-tocopherol treated model group compared to the control group.

Pro-inflammatory cytokine (TNF-α and NO), is rapidly produced by macrophages in response to tissue damage. Whereas low levels of TNF-α may play a role in cell protection, excessive amounts cause cell impairment. TNF-α also stimulates the release of cytokines from macrophages and induces phagocyte oxidative metabolism and nitric oxide production.36 Activated macrophages result in increased of NF-κB-dependent inflammatory mediators.37 NF-κB activation and other inflammatory factors are well-known biological markers for inflammatory responses.

In conclusion, we prepared a series of 15 PAs and demonstrated that PA5 and PA9 were better inhibitors of LDL oxidation but PA1 was the most potent compound for scavenging DPPH, superoxide generation induced by fMLP (1.0 μM) and PMA (0.16 μM) was inhibited to various degrees by compounds PA8 and PA12. In human neutrophils and scavenging superoxide by X/XO system as detected by lucigenin chemiluminescence is worth noting that PA1, PA2, PA4 and PA5 exhibit more efficient inhibitory action on XO activity. Our results clearly showed that PAs exhibited antioxidant activity. The substitution of a hydroxy or methoxy group as the R1–R5 function group led to PA compounds endowed with very high antioxidant activity. Fortification of diets with food materials rich in PAs has been shown to impart antimutagenic, anti-inflammatory and antioxidant properties, which can be exploited in developing health foods or cosmetics.38 PA derivatives, such as caffeic acid phenethyl ester (CAPE, 1) from the propolis of honeybee hives, have been investigated in recent years.39 It has been shown that CAPE displays oxidation, lipooxygenase and protein tyrosine kinase inhibition, as well as NF-κB activation properties.40 PAs may let us develop drugs which exert their anti-inflammatory action through inhibiting superoxide generation which can help aging problems such as Parkinson’s disease, dementia, etc., caused by oxidative stress.

In humans, oxidative stress is involved in many diseases. Examples include sickle cell disease,41 atherosclerosis, Parkinson’s disease, heart failure, myocardial infarction, Alzheimer’s disease, schizophrenia, bipolar disorder, fragile X syndrome42 and chronic fatigue syndrome, but short-term oxidative stress may also be important in prevention of aging by induction of a process named mitohormesis.43 Reactive oxygen species can be beneficial, as they are used by the immune system as a way to attack and kill pathogens.

Acknowledgements

This study was supported by Ministry of Science and Technology (MOST 103-2622-B-040-001-CC3, MOST 104-2320-B-040-018).

References

  1. D. Sumczynski, Z. Bubelova, J. Sneyd, S. Erb-Weber and J. Mlcek, Total phenolics, flavonoids, antioxidant activity, crude fibre and digestibility in non-traditional wheat flakes and muesli, Food Chem., 2015, 174, 319–325 CrossRef CAS PubMed.
  2. H. J. Forman, K. J. A. Davies and F. Ursini, How do nutritional antioxidants really work: nucleophilic tone and para-hormesis versus free radical scavenging in vivo, Free Radical Biol. Med., 2014, 66, 24–35 CrossRef CAS PubMed.
  3. N. Hamada and Y. Fujimichi, Role of carcinogenesis related mechanisms in cataractogenesis and its implications for ionizing radiation cataractogenesis, Cancer Lett., 2015, 368, 262–274 CrossRef CAS PubMed.
  4. L. Zuo and M. S. Motherwell, The impact of reactive oxygen species and genetic mitochondrial mutations in Parkinson’s disease, Gene, 2013, 532, 18–23 CrossRef CAS PubMed.
  5. Y. F. Bao, J. Y. Li, L. F. Zheng and H. Y. Li, Antioxidant activities of cold-nature Tibetan herbs are significantly greater than hot-nature ones and are associated with their levels of total phenolic components, Chin. J. Nat. Med., 2015, 13, 609–617 Search PubMed.
  6. N. Harris, F. Y. Kogan, G. Il’kova, S. Juhas, O. Lahmy, Y. I. Gregor, J. Koppel, R. Zhuk and P. Gregor, Small molecule inhibitors of protein interaction with glycosaminoglycans (SMIGs), a novel class of bioactive agents with anti-inflammatory properties, Biochim. Biophys. Acta, 2014, 1840, 245–254 CrossRef CAS PubMed.
  7. Y. Zhong, Y. S. Chiou, M. H. Pan, C. T. Ho and F. Shahidi, Protective effects of epigallocatechin gallate (EGCG) derivatives on azoxymethane-induced colonic carcinogenesis in mice, J. Funct. Foods, 2012, 4, 323–330 CrossRef CAS PubMed.
  8. Y. Zhong, C. M. Ma and F. Shahidi, Antioxidant and antiviral activities of lipophilic epigallocatechin gallate (EGCG) derivatives, J. Funct. Foods, 2012, 4, 87–93 CrossRef CAS PubMed.
  9. S. Sen, R. Chakraborty and B. De, Challenges and opportunities in the advancement of herbal medicine: India’s position and role in a global context, J. Herb. Med. Toxicol., 2011, 1, 67–75 CrossRef PubMed.
  10. L. Yang, H. Jiang, Q. H. Wang, B. Y. Yang and H. X. Kuang, A new feruloyl tyramine glycoside from the roots of Achyranthes bidentata, Chin. J. Nat. Med., 2012, 10, 16–19 CrossRef CAS.
  11. I. Celik, A. Temur and I. Isik, Hepatoprotective role and antioxidant capacity of pomegranate (Punica granatum) flowers infusion against trichloroacetic acid exposed in rats, Food Chem. Toxicol., 2009, 47, 145–149 CrossRef CAS PubMed.
  12. H. Katouah, A. Chen, I. Othman and S. P. Gieseg, Oxidised low density lipoprotein causes human macrophage cell death through oxidant generation and inhibition of key catabolic enzymes, Int. J. Biochem. Cell Biol., 2015, 67, 34–42 CrossRef CAS PubMed.
  13. C. X. Liu, R. Liu, H. R. Fan, X. F. Xiao, X. P. Chen, H. Y. Xu and Y. P. Lin, Network pharmacology bridges traditional application and modern development of traditional chinese medicine, Chin. Herb. Med., 2015, 7, 3–17 CrossRef.
  14. E. S. Hwang and G. H. Kim, Biomarkers for oxidative stress status of DNA, lipids, and proteins in vitro and in vivo cancer research, Toxicology, 2007, 229, 1–10 CrossRef CAS PubMed.
  15. B. J. Xu, S. H. Yuan and S. K. C. Chang, Comparative analyses of phenolic composition and antioxidant capacity of cool season legumes with other selected food legumes, J. Food Sci., 2007, 72, S167–S177 CrossRef CAS PubMed.
  16. O. Sulaieva, V. Deliy and S. Zharikov, Relationship between leukocytes recruitment and risk of rebleeding in patients with peptic ulcers, Pathophysiology, 2015 DOI:10.1016/j.pathophys.2015.07.002.
  17. M. Vazzana, M. Celi, C. Tramati, V. Ferrantelli, V. Arizza and N. Parrinello, In vitro effect of cadmium and copper on separated blood leukocytes of Dicentrarchus labrax, Ecotoxicol. Environ. Saf., 2014, 102, 113–120 CrossRef CAS PubMed.
  18. J. E. Benna, P. M. C. Dang and M. B. Yaffe, The phagocyte NADPH oxidase: structure and assembly of the key multicomponent enzyme of innate immunity, Encyclopedia of Cell Biology, 2016, 3, 702–709 Search PubMed.
  19. Y. L. Hsieh, Y. H. Yeh, Y. T. Lee and C. Y. Huang, Protective effects of cholestin on ethanol induced oxidative stress in rats, J. Sci. Food Agric., 2015, 95, 799–808 CrossRef CAS PubMed.
  20. K. Liu, Y. Zhao, F. Chen and Y. Fang, Purification and identification of Se-containing antioxidative peptides fromenzymatic hydrolysates of Se-enriched brown rice protein, Food Chem., 2015, 187, 424–430 CrossRef CAS PubMed.
  21. J. Yu, L. Ge, S. Liu, P. Dai, S. Ge and W. Zheng, Facile and scalable synthesis of ba novel rigid artificial superoxide dismutasebased on modified hollow mesoporous silica microspheres, Biosens. Bioelectron., 2011, 26, 1936–1941 CrossRef CAS PubMed.
  22. D. Peng, A. Belkhiri and W. El-Rifai, Regulation of oxidative DNA damage by glutathione peroxidase 7 in Barrett’s tumorigenesis, Gastroenterology, 2011, 140, S-104 Search PubMed.
  23. B. Kong, X. Peng, Y. L. Xiong and X. Zhao, Protection of lung fibroblast MRC-5 cells against hydrogen peroxide-induced oxidative damage by 0.1–2.8 kDa antioxidative peptides isolated from whey protein hydrolysate, Food Chem., 2012, 135, 540–547 CrossRef CAS PubMed.
  24. D. de Gonzalo-Calvo, A. Cenarro, M. Martínez-Bujidos, L. Badimon, A. Bayes-Genis, J. Ordonez-Llanos, F. Civeira and V. Llorente-Cortés, Circulating soluble low-density lipoprotein receptor-related protein 1 (sLRP1) concentration is associated with hypercholesterolemia: a new potential biomarker for atherosclerosis, Int. J. Cardiol., 2015, 201, 20–29 CrossRef CAS PubMed.
  25. K. Nakajima, T. Nakano and A. Tanaka, The oxidative modification hypothesis of atherosclerosis: the comparison of atherogenic effects on oxidized LDL and remnant lipoproteins in plasma, Clin. Chim. Acta, 2006, 367, 36–47 CrossRef CAS PubMed.
  26. M. Rosenblat, N. Volkova, R. Coleman, Y. Almagor and M. Aviram, Antiatherogenicity of extra virgin olive oil and its enrichment with green tea polyphenols in the atherosclerotic apolipoprotein-E-deficient mice: enhanced macrophage cholesterol efflux, J. Nutr. Biochem., 2008, 19, 514–523 CrossRef CAS PubMed.
  27. F. Otsuka, M. C. A. Kramer, P. Woudstra, K. Yahagi, E. Ladich, A. V. Finn, R. J. de Winter, F. D. Kolodgie, T. N. Wight, H. R. Davis, M. Joner and R. Virmani, Natural progression of atherosclerosis from pathologic intimal thickening to late fibroatheroma in human coronary arteries: a pathology study, Atherosclerosis, 2015, 241, 772–782 CrossRef CAS PubMed.
  28. F. M. F. Roleira, E. J. Tavares-da-Silva, C. L. Varela, S. C. Costa, T. Silva, J. Garrido and F. Borges, Plant derived and dietary phenolic antioxidants: anticancer properties, Food Chem., 2015, 183, 235–258 CrossRef CAS PubMed.
  29. M. E. Letelier, A. Molina-Berríos, J. Cortés-Troncoso, J. Jara-Sandoval, M. Holst, K. Palma, M. Montoya, D. Miranda and V. González-Lira, DPPH and oxygen free radicals as pro-oxidant of biomolecules, Toxicol. In Vitro, 2008, 22, 279–286 CrossRef CAS PubMed.
  30. Y. Zhang, Y. Shen, Y. Zhu and Z. Xu, Assessment of the correlations between reducing power, scavenging DPPH activity and anti-lipid-oxidation capability of phenolic antioxidants, LWT--Food Sci. Technol., 2015, 63, 569–574 CrossRef CAS PubMed.
  31. M. A. Varfolomeev, A. E. Klimovitskii, D. I. Abaidullina, T. I. Madzhidov and B. N. Solomonov, “Additive” cooperativity of hydrogen bonds in complexes of catechol with proton acceptors in the gas phase: FTIR spectroscopy and quantum chemical calculations, Spectrochim. Acta, Part A, 2014, 91, 75–82 CrossRef PubMed.
  32. W. Li, Y. Wang and A. Irini, Effect of pH and H2O2 dosage on catechol oxidation in nano-Fe3O4 catalyzing UV-Fenton and identification of reactive oxygen species, Chem. Eng. J., 2014, 244, 1–8 CrossRef CAS PubMed.
  33. B. Friedrichs, U. Neumann, J. Schüller and M. J. Peck, Cigarette-smoke-induced priming of neutrophils from smokers and non-smokers for increased oxidative burst response is mediated by TNF-α, Toxicol. In Vitro, 2014, 28, 1249–1258 CrossRef CAS PubMed.
  34. X. Ren, F. Lv, B. Fang, S. Liu, H. Lv, G. He, H. Ma, Y. Cao and Y. Wang, Anesthetic agent propofol inhibits myeloid differentiation factor 88-dependent and independent signaling and mitigates lipopolysaccharide-mediated reactive oxygenspecies production in human neutrophils in vitro, Eur. J. Pharmacol., 2014, 744, 164–172 CrossRef CAS PubMed.
  35. Y. T. Lee, M. J. Don, C. H. Liao, H. W. Chiou, C. F. Chen and L. K. Ho, Effects of phenolic acid esters and amides on stimulus-induced reactive oxygen species production in human neutrophils, Clin. Chim. Acta, 2005, 352, 135–141 CrossRef CAS PubMed.
  36. T. Leibovich-Rivkin, Y. Liubomirski, B. Bernstein, T. Meshel and A. Ben-Baruch, Inflammatory factors of the tumor microenvironment induce plasticity in nontransformed breast epithelial cells: EMT, invasion, and collapse of normally organized breast textures, Neoplasia, 2013, 15, 1330–1346 CrossRef.
  37. P. Di Tomo, R. Canali, D. Ciavardelli, S. Di Silvestre, A. de Marco, A. Giardinelli, C. Pipino, N. Di Pietro, F. Virgili and A. Pandolfi, β-Carotene and lycopene affect endothelial response to TNF-α reducing nitro-oxidative stress and interaction with monocytes, Mol. Nutr. Food Res., 2012, 56, 217–227 CAS.
  38. D. Kalita, D. G. Holm and S. S. Jayanty, Role of polyphenols in acrylamide formation in the fried products of potato tubers with colored flesh, Food Res. Int., 2013, 54, 753–759 CrossRef CAS PubMed.
  39. K. Wang, J. Zhang, S. Ping, Q. Ma, X. Chen, H. Xuan, J. Shi, C. Zhang and F. Hu, Anti-inflammatory effects of ethanol extracts of Chinese propolis and buds from poplar (Populus canadensis), J. Ethnopharmacol., 2014, 155, 300–311 CrossRef PubMed.
  40. J. Hyeog Choi, K. H. Roh, H. Oh, S. J. Park, S. M. Ha, M. S. Kang, J. H. Lee, S. Y. Jung, H. Song, J. W. Yang and S. G. Park, Caffeic acid phenethyl ester lessens disease symptoms in an experimental autoimmune uveoretinitis mouse model, Exp. Eye Res., 2015, 134, 53–62 CrossRef PubMed.
  41. J. Amer, H. Ghoti, E. Rachmilewitz, A. Koren, C. Levin and E. Fibach, Red blood cells, platelets and polymorphonuclear neutrophils of patients with sickle cell disease exhibit oxidative stress that can be ameliorated by antioxidants, Br. J. Haematol., 2006, 132, 108–113 CrossRef CAS PubMed.
  42. Y. de Diego-Otero, Y. Romero-Zerbo, R. el Bekay, J. Decara, L. Sanchez, F. Rodriguez-de Fonseca and I. del Arco-Herrera, Alpha-tocopherol protects against oxidative stress in the fragile X knockout mouse: an experimental therapeutic approach for the Fmr1 deficiency, Neuropsychopharmacology, 2009, 34, 1011–1026 CrossRef CAS PubMed.
  43. D. Gems and L. Partridge, Stress–response hormesis and aging: that which does not kill us makes us stronger, Cell Metab., 2008, 7, 200–203 CrossRef CAS PubMed.

This journal is © The Royal Society of Chemistry 2015
Click here to see how this site uses Cookies. View our privacy policy here.