DOI:
10.1039/C5RA14109E
(Paper)
RSC Adv., 2015,
5, 81052-81058
Electrokinetic remediation: challenging and optimization of electrolyte for sulfate removal in textile effluent-contaminated farming soil†
Received
17th July 2015
, Accepted 8th September 2015
First published on 9th September 2015
Abstract
In the current situation, soil salinity has increased due to the uncontrolled discharge of industrial effluent. In the present investigation, an electrokinetic (EK) technique was used for the inclusion and removal of sulfate in farming soil. Initially, the influence of the electrode distance was evaluated by the use of two cell configurations. The nature of the catholyte was assessed for the inclusion of sulfate in the soil. Decolorized textile effluent and 5% Na2SO4 were tested as the catholyte and double-distilled water as the anolyte for the inclusion process. Subsequently, selection of the electrolyte concentration and pH was investigated for the removal of sulfate concentrations in contaminated farming soil. Optimization of the pH and electrolyte for the process of sulfate removal in farming soil was performed and a mechanism of the removal process was proposed. A total of 96% sulfate removal was achieved using 0.01 M hydrochloric acid at a pH of 4.5 for a 96 h EK experiment. The initial conductivity of the soil was 5.32 dS m−1, and after sulfate removal the conductivity was about 0.714 dS m−1 and the energy consumption was 119 kW h m−3 for the farming soil.
1. Introduction
Soil pollution has become an important environmental issue for developing countries due to the uncontrolled discharge of industrial solid and liquid wastes over the last few decades. This creates environmental pollution, which has spread over the surroundings of industrial areas.1 Large amounts of inorganic and organic substances like chloride, sulfate, trace metals, organic acids, aromatic and aliphatic compounds, etc., can be found. These substances have an enormous impact on the quality of groundwater and soil that are associated with the ecosystem.2
Sulfate is one of the major problems in aquatic and soil environments. Sulfate pollution comes from textile industries, where sulfate salts are used in various processes like dyeing, washing, printing and bleaching. The sulfate ion is the third most important salt in saline soils, which can be represented by the electrical conductivity (EC) of the soil.3 A high sulfate concentration adversely affects the health of living beings and the fertility of the soil. Agriculture, forestry and fisheries recommend 2.0 dS m−1 as an EC guideline value for plant growth,4 where the limiting level of sulfate is 200 mg L−1,5 but some polluted farming soils contain about 1000–2300 mg kg−1.3,5,6 Several methods, viz., chemical, biological, and electrochemical are used for the control of sulfate in soils. Besides, soil flushing is also an important method for removing pollutants in soil.7 However, the cost of this method is relatively high for applying in the field. Therefore, the control of sulfate concentration in soil is a challenging task and recently some authors have reported the electrokinetic (EK) transport of sulfate from various soil environments.3,6 However, they could not succeed in the complete removal of sulfate from the soil environment due to the formation of complexes3 and bisulphate.3,5 The mobility of sulfate is higher than that of chloride, but sulfate cannot be removed significantly from soil due to the extensive formation of complexes with aluminum, calcium and iron.6,8
EK remediation is an emerging technology for cleaning up contaminated soil, which is applicable for low-permeability, saturated and unsaturated soils. The EK technique is an effective method for the removal of charged particles (i.e., metal ions and anions) due to an electromigration process. The efficiency of the EK process is high compared to other conventional methods like biological processes, thermal deposition, soil vapour extraction, soil washing and soil flushing, etc.1 The electrode and electrolyte can play an important role in the EK process. Several studies have reported the transport of sulfate using various types of electrodes such as titanium, mixed metal oxide (IrO2–RuO2–TiO2/Ti), iron and graphite.3,9,10 The removal of sulfate was also enhanced using various types of electrolytes such as water, acetic acid (AcOH) and ammonium acetate. The literature about the EK removal of sulfate in various environments, electrodes and electrolytes is listed in the ESI Table S1.†
On the other hand, the removal of sulfate from soil has been a challenging task to the scientific community because many research articles have dealt with the removal of sulfate from contaminated soil but the removal efficiency was not high.3,5,11,12 The percentage removal of sulfate was found to be 33% (within 7 days), 25.6% (within 6 days), 22.3% (within 14 days), and 51.8% (within 30 days), as noticed by various investigators.3,4,11,13 In our previous study, the average percentage removal of sulfate from farming soil was around 68% for 5 days in an EK experiment.5 The pH of the electrolyte was maintained at 7 and 8–9 for the anolyte and catholyte, respectively. From this study, it was concluded that in contaminated soil sulfate was in the form of sulphonic acids or sodium salts of sulphonate ions, or in ionic form. In alkaline conditions the sulphonic group acted as a weak acid, which was easily ionized and transported towards the anodic chamber. However, the percentage removal of sulfate was lower in the anodic chamber compared to the cathodic chamber. This fact was explained because sulfate ions have a stronger affinity with organic molecules and the formation of bisulphate occurred close to the anodic compartment, which hindered the mobility of sulfate in the soil.5 Furthermore, the removal efficiency was low due to the presence of calcium and magnesium in the soil, which could form metal sulfate complexes in the soil. Hence, the present study was undertaken to investigate the inclusion and removal of sulfate in mineral complex-containing farming soil by the EK process.
In the present work, the inclusion and removal of sulfate were investigated in farming soil collected at Tiruppur (India) using the EK process. In this study, sulfate was included in the soil by the EK method and after that the removal of sulfate was carried out by the selection of a suitable electrolyte. The selection of the electrolyte was investigated to provide the removal of a higher concentration of sulfate in a short period of time. The mechanism of sulfate removal during the EK process was also discussed. In the last part, an optimized EK system for the process of sulfate removal was used on polluted soil collected from an agricultural field.
2. Materials and methods
2.1 Sample
A sample of polluted farming soil was collected from a nearby textile industrial area, Tiruppur, South India. The soil was kept in a sterile plastic container. The soil sample was air-dried and sieved to remove coarse-sized particles. The sieved sample (1 mm; US Standard Screen No. 18) was used for the EK experiments. The initial physicochemical characteristics of the soil were determined by standard procedures,14 as shown in Table 1.
Table 1 Physicochemical characteristics of the soil and electrolyte
|
Contaminated farming soil |
EDTE |
5% Na2SO4 |
Original |
After AcONa treatment |
pH |
8.10 |
6.53 |
8.51 |
7.22 |
Conductivity (dS m−1) |
5.32 |
3.81 |
11.87 |
6.52 |
Sulfate |
2519 ± 49 (mg kg−1) |
440.32 ± 37 (mg kg−1) |
3390 ± 58 (mg L−1) |
3382 ± 62 (mg L−1) |
Chloride |
1864 ± 21 (mg kg−1) |
527.25 ± 12 (mg kg−1) |
998 ± 10 (mg L−1) |
20 ± 5 (mg L−1) |
2.2 Physicochemical characterization
2.2.1 pH and EC. Soil samples were dried and homogenized before and after EK experiments. 5 g soil was mixed with 25 mL deionized water and stirred on a magnetic stirrer for 30 min. The pH and EC were measured in the supernatant solution employing pH and EC meters (EUTECH Instruments COND 610).
2.2.2 Sulfate determination. The sulfate concentration in the soil was determined by a turbidimetric method. Some 5 g of the sample was mixed with 25 mL double-distilled water and stirred on a magnetic stirrer for 30 min. After that, 10 mL of the supernatant solution was taken and 5 mL of conditioning reagent (25 mL glycerol, 15 mL concentrated HCl and 50 mL 95% isopropyl alcohol added into the same beaker, 37.5 g NaCl dissolved in distilled water, then all the contents mixed and made up to 250 mL in a standard measuring flask using distilled water) were added and made up to 100 mL in a standard measuring flask using double-distilled water. Sulfate ion was estimated by a turbidimetric method with the help of a UV-visible spectrophotometer15 in the wavelength range of 420 nm.
2.3 DC electrokinetic cells and experimental set-up
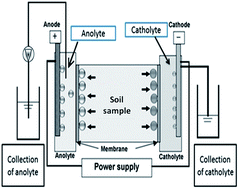
In the present study, EK cells with two different dimensions, i.e. 12 × 4 × 6 cm (EK-A) and 24 × 4 × 6 cm (EK-B), were divided into three compartments separated by perforated acrylic sheets (ESI Fig. S1†). The distance of the electrodes was different for each cell: thus, the length of the middle chamber was 3 cm and 10 cm for EK-A and EK-B cells, respectively. The soil sample was mixed with water to give an initial soil moisture of 20% and then carefully placed in the middle compartment. The systems used for sulfate transport are given in Table 2, where the anolyte and catholyte reservoirs were filled with a suitable electrolyte. The electrolyte levels in both reservoirs were maintained equally. IrO2–RuO2–TiO2/Ti16 was used as the anode and titanium as the cathode. A DC power supply (Aplab power supply model: Regulated DC power supply L6405) was used to provide a constant voltage gradient of 3.3 V cm−1 and a multimeter (Agilent U1232A) was used to monitor the voltage and to measure the current intensity through the soil sample during the experiments. The real experimental set-up is shown in Fig. 1.
Table 2 Electrolyte system for the inclusion and removal of sulfate during the EK process
System |
EK cell |
Duration (h) |
Anolyte |
Catholyte |
pH condition |
EDTE: electrochemically decolorized textile effluent. Inclusion and removal of sulfate were performed in pretreated soil. In system IV, sulfate was removed from the existing soil by EK without inclusion of sulfate. |
I |
EK-A |
48 |
D.D water |
EDTEa |
4.5 ± 0.2 |
I-a |
EK-A |
48 |
0.01 M HCl |
0.01 M HCl |
4.5 ± 0.2/8.5 ± 0.2 |
I-b |
EK-A |
48 |
0.1 M AcOH |
0.1 M AcOH |
4.5 ± 0.2/8.5 ± 0.2 |
II |
EK-A |
48 |
D.D water |
5% Na2SO4 |
4.5 ± 0.2 |
II-a |
EK-A |
48 |
0.01 M HCl |
0.01 M HCl |
4.5 ± 0.2/8.5 ± 0.2 |
II-b |
EK-A |
48 |
0.1 M AcOH |
0.1 M AcOH |
4.5 ± 0.2/8.5 ± 0.2 |
III |
EK-B |
96 |
D.D water |
EDTEa |
4.5 ± 0.2 |
IIIab |
EK-B |
96 |
0.01 M HCl |
0.01 M HCl |
4.5 ± 0.2 |
IVc |
EK-B |
96 |
0.01 M HCl |
0.01 M HCl |
4.5 ± 0.2 |
 |
| Fig. 1 A real experimental cell set-up with soil path lengths of 3 cm (left) and 10 cm (right). | |
2.4 Inclusion of sulfate
Initially, EK experiments were carried out for the inclusion of sulfate in the soil. The polluted farming soil was previously chemically treated with 0.1 N sodium acetate for 30 min before starting the EK experiment for the removal of calcium, iron, trace metals, etc. This treatment process helps remove existing cations in soil in order to reduce interference between sulfate and trace metals in soil. The characteristics of the sample are given in Table 1. After that, the soil sample was decanted and repeatedly washed with double-distilled water. The chemically treated (sodium acetate-treated) soil was carefully packed in an EK cell for the three studied systems, viz., system I, system II and system III. Two different sulfate sources were used as the catholyte: electrochemically decolorized textile effluent (EDTE) and 5% Na2SO4.
2.5 Removal of sulfate by selection of electrolyte
In these experiments, soils that were obtained after EK treatment for the inclusion of sulfate (systems I, II and II) were used and different electrolytes and pH values were evaluated for the removal of sulfate. The experimental conditions for the inclusion and removal of sulfate are listed in Table 2.
2.6 Instrumentation
The pH values of the anolyte and catholyte were measured during the EK operation using a pH meter (model: EUTECH Instruments pH 510 Cyberscan). The distribution of trace metals and the sulfur ion concentration in the soil were analyzed before and after the EK experiments using micro-XRF analysis (model: bench top XGT-5200). XRD patterns of the studied samples were recorded using a computer-controlled XRD system (JEOL, Model: JPX 8030) with Cu Kα radiation (Ni filter = 1.3418 Å) at 40 kV and 20 mA current. Peak search and peak match programs built in software (syn master 7935) were used to identify the compounds. The sulfate ion concentration in the soil was analyzed before and after the EK experiments using a UV-vis spectrophotometer (CARY Analytical Instruments).
3. Results and discussion
3.1 Inclusion of sulfate in the soil
Initially, the ability of an electric field to include sulfate ions in the chemically treated farming soil (Table 1) was evaluated. The inclusion of the ions was performed by a catholyte that was enriched in sulfate ions. Two different catholytes were tested: EDTE and a solution of Na2SO4 (Table 1). The accumulation of sulfate in the soil from the catholyte was about 53% (1917 ± 31 mg L−1) in system I and 95% (3094 ± 45 mg L−1) in system II. The percentages of sulfate that reached the anolyte of systems I and II were 47% and 5%, respectively. This fact indicates the possibility of the accumulation of sulfate in soil by the action of an electric field. The content in soil of various metals such as iron, calcium, aluminium and sodium was analyzed and confirmed by XRF (ESI Table S2†). There was no significant removal of aluminium silicates and calcium, which may form a complex with sulfate, during the inclusion process. This reveals that calcium, iron and aluminium compounds have the highest adsorption capacity for sulfate compared to other components present in the soil.8
The removal of sulfate concentrations in the catholyte during the EK process is shown in Fig. 2. In the EK process, sulfate moved towards the anolyte through the soil. The pH of both electrolytes was about 4.5 ± 0.2 throughout the experiment. In the catholyte compartment, sulfate was gradually reduced from 3.390 to 0.0057 g L−1 after 24 h for system I but the experiment was continued up to 48 h (Fig. 2a). In the anolyte compartment, the sulfate concentration reached 1.633 g L−1 after 24 h. In system II, 5% Na2SO4 (3.3824 g L−1 of sulfate) was used as the catholyte (Fig. 2b). After 24 h, the levels of sulfate were about 0.395 g L−1 and 0.200 g L−1 in the catholyte and anolyte, respectively, but only 5% of sulfate was removed from the soil to the anolyte chamber.
 |
| Fig. 2 Electrochemical inclusion of sulfate in soil using different electrolytes: (a) electro-oxidized textile effluent; (b) 5% sodium sulfate solution; (c) electro-oxidized textile effluent (soil path length: 10 cm). | |
The distance between the electrodes was measured using EDTE as the catholyte (Fig. 2c). The soil compartment was increased to 10 cm (system III). In this system the concentration of sulfate in the catholyte was about 3390 ± 79 mg L−1 and after 24 h of the EK experiment the concentration of sulfate was about 0.0032 g L−1. The EK experiment was conducted for 96 h to monitor the migration of sulfate ions towards the anolyte chamber. During the EK process, the sulfate concentration was analyzed at regular intervals for system III (Fig. 2c). The sulfate concentration of 1.983 g L−1 was transported after 96 h and the remaining SO42− accumulated in the soil. In systems I and III, it is expected that sulfate is in the form of a sulphonic acid bound to a dye molecule. Therefore, it can easily be transported towards the opposite side based on an electromigration process, whereas in system II there is a high concentration of free sulfate ions. They have a tendency to form a complex with metal ions like Al, Fe, Ca, etc. Similarly, Rajan et al.17 noticed that aluminum hydroxide could adsorb sulfate at a rate of more than 800 mmol eq. kg−1. Singh18 noticed that the lowest percentage removal of sulfate is due to the presence of Al and Fe in the soil. Nodvin et al.19 observed a reduction in sulfate adsorption on soil at a pH below 3.5. Harrison et al.20 reported the adsorption of sulfate in samples at different pH values and they concluded that sulfate adsorption increased with an increase in the pH of the medium. It can be concluded that the existing sulfate may be formed as a complex with available aluminum and calcium, which suppresses the mobility of sulfate.
3.2 Removal of sulfate: selection of electrolyte and working pH
The previous experiments determined that it is possible to use an electric field to include sulfate in soil and some ions migrate to the anolyte. In the next experiments, the EK process was evaluated for the reduction of the concentration of sulfate in soil. For this purpose, the soils that were previously obtained from systems I, II and III were used. Different electrolytes, hydrochloric acid (HCl) and AcOH, were tested in order to enhance the process (Table 2). These acids were selected because it has been reported that most metal ions dissolve in AcOH solution9 and HCl is a strong acid, which may displace the sulfate in the metal complex.7 Furthermore, both chemicals are cost-effective. Hence, low concentrations of HCl and AcOH were selected for this study. In addition, the influence of the pH value in the removal of sulfate was also evaluated by the use of the studied electrolytes at pH 4.5 and 8.5 (Table 2) and (Fig. 3).
 |
| Fig. 3 Percentage removal of sulfate at different pH values and in various electrolyte systems during EK studies. | |
After the previous experiments, the amount of sulfate present in the soils were around 2.3 g kg−1, 3.2 g kg−1 and 1.8 g kg−1 for systems I, II and III, respectively. Therefore, these soils were used for the next experiments in order to evaluate the best working conditions. It was expected that the process would be quick because the mobility of sulfate is high when compared to other inorganic anions such as Cl−, NO3−, etc.
Initially, the pH of the electrolyte was maintained at 4.5 ± 0.2 throughout the experiments. The pH of the soil close to the anode was about 4 and the value at the cathode was about 5 for both electrolytes that were studied, HCl (systems Ia and IIa) and AcOH (systems Ib and IIb), whereas in system IIIa the pH was around 4.4 and 5.2 in the anodic and cathodic chambers, respectively. The pH of the soil changed due to the production of H+ ions at the anode and OH− ions at the cathode. Lee et al.3 studied the effect of electrode materials on the reduction by EK of soil salinity, where the pH of the electrolyte was about 7 (water), and they achieved percentage removals of sulfate of 33.7% and 87.9% after 7 days of experiment using DSA and iron electrodes, respectively. An acidic pH favors the removal of adsorbed sulfate from contaminated soil. When employing the EK process, H+ ions move 1.8 times faster when compared to OH− ions, which move towards the opposite direction. These H+ ions react with sulfate minerals and lead to the release of sulfate ions, which can move freely towards the opposite direction. In the present work, it was found that both acids that were studied enhanced the removal of sulfate. Thus, in system Ia 93% of sulfate was removed from the contaminated soil (Fig. 3) and 95% removal of sulfate was achieved in system IIa using 0.01 M HCl as the electrolyte. These observations were confirmed by XRF and UV-visible methods. Similarly, 90% removal of sulfate was achieved using 0.01 M HCl in system IIIa.
The influence of the pH of the electrolyte was investigated at basic pH. The same sets of experiments were carried out (except for system III), working with the selected electrolyte at pH 8.5, and the percentage removal of sulfate was drastically reduced. A similar observation was noticed by Harrison et al.,20 who studied the reversibility of sulfate adsorption and desorption in a variety of forest soils. They found that sulfate desorption increased when the pH of the soil was reduced. When AcOH was used as the electrolyte, the percentage removals were around 58% and 62% for systems Ib and IIb, respectively. The present study supports the observation made by Li et al.,7 who studied the removal of multiple metals from contaminated clay minerals using 0.01 M HCl as a washing solution in soil.
3.3 Optimized EK experiments
From the previous experiments it can be stated that the maximum amount of sulfate was removed from the soil using 0.01 M HCl while the pH of the electrolyte was maintained at a value of 4.5. These optimized parameters were applied in system IV, where original farming soil that was contaminated by textile effluent was used (2.519 g kg−1 of sulfate) (Table 2). After EK treatment, the sulfate concentration in the soil was drastically reduced, as shown in Fig. 4. In the polluted soil, the average percentage removal of sulfate was 96.2% after 96 h using a voltage gradient of 3.3 V cm−1. These are encouraging results, because the best removal that was obtained until now using the EK process was that reported by Lee et al.3 They reached 86% removal of sulfate using a voltage gradient of 4 V cm−1 after 14 days of EK experiments. The present study reached a higher removal at a lower voltage gradient within a shorter duration (96 h) using HCl as the electrolyte. The physical nature of the soil was not considered in the present work, where the role of HCl in the process of sulfate removal was investigated to find the mechanism.
 |
| Fig. 4 Removal of sulfate from farming soil contaminated with textile effluent during EK studies. | |
3.4 X-ray diffraction pattern analysis
Fig. 5 and ESI Table S3† illustrate the XRD patterns of soil before (a) and after EK treatments. The soil contains various minerals such as SiO2, Na3H(CO3)2·2H2O, Na6(CO3) (SO4)2, Al2Si2O5(OH)4, Na2Fe(SO4)2(OH)·3H2O, etc.21–23 The XRD patterns (b) and (c) were obtained for the inclusion of sulfate onto the soil after 48 h of the EK experiment. They show the presence of peaks that correspond to different types of sulfate minerals such as Na2Fe(SO4)2(OH)·3H2O, KFe3(SO4)2(OH)6, KAl3(SO4)2(OH)6 and CaSO4·2H2O, etc. They reveal the formation of sulfate minerals during the EK process (inclusion). A similar result was obtained for system II and this was also confirmed by the XRD pattern. The XRD patterns using HCl for systems Ia (d) and IIa (e) show only four peaks, which correspond to Al2Si2O5(OH)4, SiO2, Na3H(CO3)2·2H2O and Ca(AlFeMg)5SiO16Cl3. In both systems, no sulfate peaks were observed; this reveals that all the sulfate ions migrated toward the anolyte chamber from the soil. However, the XRD pattern for system Ib (f) indicates that sulfate mineral peaks are present in the soil while using AcOH as the electrolyte due to its lower ionic strength compared to HCl.
 |
| Fig. 5 X-ray diffraction patterns illustrating the various minerals present in the soil before and after EK studies. (a) Contaminated soil, (b) sulfate inclusion by electrochemically decolorized textile effluent as catholyte (system I), (c) sulfate inclusion by 5% Na2SO4 as catholyte (system II), (d) sulfate removal from system I by using 0.01 M HCl as electrolyte, (e) sulfate removal from system II by using 0.01 M HCl as electrolyte and (f) sulfate removal by using 0.1 M AcOH as electrolyte. | |
3.5 Mechanisms – inclusion and removal of sulfate onto soil
Inclusion: the following reaction mechanism has been proposed for the inclusion of sulfate in soil: |
xM3+ + yOH− → [Mx(OH)y]−
| (2) |
|
[Mx(OH)y]− + nSO42− → [Mx(OH)y−2n(SO4)n]−
| (3) |
|
[Mx(OH)y−2n(SO4)n]− + nSO42− → [Mx(OH)y−4n(SO4)n+1]−
| (4) |
|
[Mx(OH)y−4n(SO4)n+1]− + Nm+ → [NMx(OH)y−4n(SO4)n+1]
| (5) |
where x = 3, y = 10, n = 1, 2…, m = 1, M = Al, Fe, etc., and N = K, Na, etc.
During EK phenomena, in the anodic and cathodic reactions a water molecule disintegrates into H+ and OH− ions, respectively (eqn (1)). In the electromigration process, H+ ions move towards the cathodic chamber. Similarly, OH− ions move towards the anodic chamber and the available metal ions react with hydroxyl groups and form metal hydroxide complexes (eqn (2)). A substitution reaction takes place between a metal hydroxide and a sulfate ion. The hydroxyl ion is replaced by a sulfate ion to form a metal complex (eqn (3) and (4)). Finally, the metal complex reacts with another metal ion to form sulfate minerals (eqn (5)).
The following reaction mechanism has been proposed for the removal of sulfate from soil:
|
 | (6) |
|
 | (7) |
In the process of sulfate removal, alunite and burkeite minerals react with hydrochloric acid during EK phenomena with the formation of water-soluble sulfate ions, which move towards the anodic chamber by an electromigration process. After the removal of sulfate, the formation of kaolinite and trona (eqn (6) and (7)) was confirmed by XRD.
3.6 EC and energy consumption
EC is closely related to the presence of soluble inorganic salts such as sodium ions, chloride, sulfate, etc. in the soil.6 Initially, the EC of the soil was around 5.32 dS m−1 and the EC increased to 7.18 dS m−1 in the case of inclusion of sulfate (system III). On the other hand, the removal of sulfate reduced EC. Thus, the EC values of the soils after treatment in systems Ia, IIa and IIIa were 0.841, 0.729 and 0.968 dS m−1, respectively. These low EC values are related to the high extent of removal that was achieved. Similarly, for systems Ib and IIb, the EC values of the soils after treatment were 1.74 and 1.81 dS m−1, respectively. In system IV, sulfate was removed in all the sections and the EC was effectively reduced from 5.32 to 0.714 dS m−1, which is suitable for agricultural purposes. Hence, it is concluded that 0.01 M HCl is a suitable electrolyte for the process of sulfate removal.
The following equation was used to calculate the current efficiency:5
|
 | (8) |
where
Vs is the volume of soil processed,
V is the difference in voltage between the electrodes and
I is the electric current.
E is calculated in kW h m
−3. In system IV the energy consumption was around 119 kW h m
−3. In the present study, energy consumption was lower compared to the other investigations.
6
4. Conclusions
In this work, the EK technique was evaluated for the inclusion and removal of sulfate in farming soil. It was found that an electric field permits the efficient inclusion of sulfate in the soil. The maximum concentration of sulfate was about 3.07 g kg−1 using a solution of Na2SO4 as the catholyte in the inclusion process. On the other hand, the removal process was optimized by selecting the electrolyte composition and pH. The maximum removal of sulfate from contaminated farming soil was around 96% using 0.01 M HCl at a pH of 4.5. Based on the reported results, it can be established that the EK process is a promising and eco-friendly technology for controlling soil salinity.
Acknowledgements
CSIR-HRDG, New Delhi is gratefully acknowledged for the Senior Research Fellowship of Sivasankar Annamalai. The authors thank the Council of Scientific and Industrial Research (CSIR), India for sponsoring this project under Sustainable Environmental Technology for Chemical and Allied Industries (SETCA) – CSC 0113.
References
- M. T. Ricart, M. Pazos, S. Gouveia, C. Cameselle and M. A. Sanromán, J. Environ. Sci. Health, Part A: Toxic/Hazard. Subst. Environ. Eng., 2008, 43, 37–41 CrossRef PubMed.
- J. Virkutyte, M. Sillanpaa and P. Latostenmaa, Sci. Total Environ., 2002, 289, 97–121 CrossRef CAS.
- Y. Lee, J. Choi, H. Lee, T. Ha and J. Bae, Sep. Sci. Technol., 2012, 37–41 Search PubMed.
- D.-H. Kim, S.-U. Jo, J.-H. Choi, J.-S. Yang and K. Baek, Chem. Eng. J., 2012, 198–199, 110–121 CrossRef CAS PubMed.
- A. Sivasankar, M. Santhanam, M. Sundaram and M. P. Curras, Chemosphere, 2014, 117, 673–678 CrossRef PubMed.
- J.-M. Cho, D.-H. Kim, J.-S. Yang and K. Baek, Sep. Sci. Technol., 2012, 47, 1677–1681 CrossRef CAS PubMed.
- L. Y. Li, Environ. Technol., 2006, 27, 811–822 CrossRef CAS PubMed.
- T. A. Sokolova and S. A. Alekseeva, Eurasian Soil Sci., 2008, 41, 140–148 CrossRef.
- S. Maruthamuthu, T. Dhanibabu, A. Veluchamy, S. Palanichamy, P. Subramanian and N. Palaniswamy, J. Hazard. Mater., 2011, 193, 188–193 CrossRef CAS PubMed.
- C. Soundarrajan, a. Sivasankar, S. Maruthamuthu and A. Veluchamy, J. Hazard. Mater., 2012, 217–218, 452–456 CrossRef CAS PubMed.
- J.-M. Cho, S.-Y. Park and K. Baek, J. Appl. Electrochem., 2010, 40, 1085–1093 CrossRef CAS.
- J.-H. Choi, Y.-J. Lee, H.-G. Lee, T.-H. Ha and J.-H. Bae, Electrochim. Acta, 2012, 86, 63–71 CrossRef CAS PubMed.
- S. Maruthamuthu, T. Dhanibabu, A. Veluchamy, S. Palanichamy, P. Subramanian and N. Palaniswamy, J. Hazard. Mater., 2011, 193, 188–193 CrossRef CAS PubMed.
- G. H. Jeffery, J. Bassett, J. Mendham and R. C. Denney, Quantitative chemical, John Wiley & Sons, 1989 Search PubMed.
- A. D. Eaton, L. S. Clesceri and A. E. Greenberg, Washington, DC, 2005, pp. 20001–23710.
- P. Subbiah, S. Krishnamurthy, K. Asokan, K. Subramanian and V. Arumugam, Indian Pat., 178184, 1990.
- S. S. S. Rajan, Soil Sci. Soc. Am. J., 1978, 42, 39–44 CrossRef CAS.
- B. R. Singh, Soil Sci., 1984, 138, 294–297 CrossRef CAS.
- S. C. Nodvin, C. T. Driscoll and G. E. Likens, Soil Sci., 1986, 142, 69–75 CrossRef CAS.
- R. B. Harrison, D. W. Johnson and D. E. Todd, J. Environ. Qual., 1989, 18, 419–426 CrossRef CAS.
- C. Doc Richardson, N. W. Hinman, L. J. McHenry, J. Michelle Kotler, D. L. Knipe and J. R. Scott, Planet. Space Sci., 2012, 65, 93–103 CrossRef PubMed.
- M. Özdemir and H. Çetisli, Ind. Eng. Chem. Res., 2005, 44, 3213–3219 CrossRef.
- S. Szakáll, M. Földvari, G. Papp, P. Kovács-Pálffy and Á. Kovács, Acta Mineral.-Petrogr., 1997, 38, 7–63 Search PubMed.
Footnote |
† Electronic supplementary information (ESI) available. See DOI: 10.1039/c5ra14109e |
|
This journal is © The Royal Society of Chemistry 2015 |
Click here to see how this site uses Cookies. View our privacy policy here.