
Optimal hydrothermal synthesis, characterization, and sensor application of sulfur-doped γ-MnOOH microrods
Junwei Dinga,
Tianjiao Liua,
Wei Xua,
Hang Liaoa,
Jingfeng Lib,
Gang Wei*b and
Zhiqiang Su*a
aState Key Laboratory of Chemical Resource Engineering, Beijing University of Chemical Technology, 100029 Beijing, China. E-mail: suzq@mail.buct.edu.cn
bHybrid Materials Interface Group, Faculty of Production Engineering, University of Bremen, D-28359 Bremen, Germany. E-mail: wei@uni-bremen.de
First published on 16th September 2015
Abstract
Sulfur-doped γ-MnOOH rods were successfully prepared by employing a one-step hydrothermal process based on thioacetamide (TAA), and their structure was directly confirmed and characterized by scanning electron microscopy (SEM), transmission electron microscopy (TEM), high-resolution transmission electron microscopy (HRTEM), X-ray powder diffraction (XRD), Raman spectroscopy, and X-ray photoelectron spectroscopy (XPS) techniques. The mechanism for the TAA assisted hydrothermal synthesis of γ-MnOOH rods has been preliminarily presented. Furthermore, the synthesized sulfur-doped γ-MnOOH rods were immobilized onto a glassy carbon electrode and applied to construct an electrochemical hydrazine sensor, which exhibited a wide linear range (0.1 μM–1.15 mM and 1.15–45.75 mM), low detection limit (0.079 μM), high selectivity, and long-term stability.
1. Introduction
γ-MnOOH is the most stable polymorph of trivalent hydroxides,1,2 which is of considerable interest in many chemical processes including catalysis,3 model simulation,4 lithium ion batteries,5 and so on. Various synthetic routes, such as precipitation,6 hydrothermal reaction,7 and electrochemical deposition,8 have been developed to prepare γ-MnOOH nanostructures. Among them, the hydrothermal method is the most commonly used one.2,9 It is well known that the rods and wires represent a class of one dimensional (1D) structure in which the carrier motion is restricted to two directions.10–14 The synthesis of γ-MnOOH wires and rods7,15–17 attracts great interest because their properties can be significantly improved when having an anisotropic morphology.18 Meanwhile, the performance of γ-MnOOH in electrochemical applications could be potentially enhanced by processing 1D nanostructures.19 For example, Bai et al. have synthesized the silver nanoparticle–MnOOH–graphene oxide nanocomposite and explored its application for electrochemical detection of H2O2.20 The electrochemical investigation indicates the fabricated sensor has excellent catalysis ability toward H2O2, and it could detect H2O2 with a low detection limit of 0.2 μM and wide linear range of 0.5 μM to 17.8 mM. In another case, Cao et al. have prepared MnOOH nanowires and applied them for the electrochemical detection of H2O2.21 The fabricated sensor exhibited excellent performance for H2O2 determination with a wide linear range of 0.15 μM to 1.6 mM and long-term stability. In the following study, they have reported the synthesis of MnOOH nanobelt and its application for electrochemical detection of dopamine.22 The sensor exhibited good sensing performance for determination of dopamine with a linear range between 1.2 μM and 200 μM, detection limit of 0.1 μM.Hydrazine (N2H4) is applied as intermediate in chemical industry to synthesize pesticides and herbicides as well as to produce anti-tuberculosis and anti-diabetes medicines.23 However, N2H4 is quite toxic.24 Therefore, the development of a sensitive way to detect N2H4 is critical.25 Until now many methods have been developed for N2H4 determination, such as spectrophotometric method,26 fluorimetric method,27 and potentiometry.28 However, these methods are usually expensive and time-consuming. Among them, electrochemical method attracts more and more attention, due to its higher sensitivity and reliability and less expensive.29,30
Though 1D γ-MnOOH have been successfully synthesized by different synthetic methods,7,15,16,19,31,32 most of them are as intermediates to prepare other types of manganese oxide, and are not with uniform rod morphology. In this work, we report the fabrication of sulfur (S)-doped γ-MnOOH rods based on a one-step hydrothermal reaction between KMnO4 and MnSO4 in the presence of thioacetamide (TAA). We utilized TAA as S source and reductant. To the best of our knowledge, the synthesis of γ-MnOOH using TAA has not been reported to date. The additional studies were carried out to study the properties and performances of the fabricated electrochemical N2H4 sensor. It is also the first time to fabricate the electrochemical sensor by using MnOOH for detecting N2H4.
2. Experimental section
2.1. Reagents and materials
MnSO4·H2O, KMnO4, TAA, ethanol, Na2HPO4, NaH2PO4, H2O2 (analytical grade, 30% aqueous solution), and hydrazine hydrate (analytical grade, 85% aqueous solution) were supplied by Beijing Chemicals Co., Ltd. (Beijing, China). Dopamine was obtained from J&K Scientific Ltd. (Beijing, China). All chemicals used in this work were of analytical reagent grade and obtained from commercial sources and directly used without additional purification. The water used was purified through a Millipore system (∼18.2 MΩ cm).2.2. Preparation of S doped γ-MnOOH
In a typical experiment, 0.945 g of KMnO4,0.2 g of TAA and 0.375 g of MnSO4·H2O were dissolved in 60 mL deionized water and magnetically stirred for about 20 min to form a homogeneous solution. Then, the solution was transferred into a 100 mL Teflon-lined stainless steel autoclave and kept at 200 °C for 24 h. After the autoclave was cooled down to room temperature, the resulted solid products were centrifugalized at 4500 rpm for 5 min, and washed several times with deionized water and ethanol to remove the ions possibly remaining in the final product, and finally dried in vacuum at 55 °C for 12 h.To investigate the effects of different reaction parameters, such as temperature, the amount of TAA, and the reaction period, on the formation of S doped γ-MnOOH, the temperature was set from 140 to 160, 180 and 200 °C; the amount of TAA was kept from 0.1 to 0.2, 0.4 and 0.8 g; the reaction period was adjusted from 8 to 16, 24 and 36 h.
Furthermore, in order to study the effect of different reactants in reaction system, three sets of control experiment without KMnO4, TAA and MnSO4·H2O respectively were studied, while keeping all other experimental parameters as in the typical run.
2.3. Electrochemical measurements
All electrochemical measurements were performed on a CHI760D electrochemical workstation (CH Instruments, Shanghai, China) at room temperature. A conventional three-electrode cell was used, including a glass carbon electrode (GCE, 3 mm in diameter) as the working electrode, an Ag/AgCl electrode (saturated KCl) as the reference electrode, and a Pt wire as auxiliary electrode. The test solution was PBS solution (0.1 M) with pH = 7.4, which was prepared with 0.2 M NaH2PO4 and 0.2 M Na2HPO4 and deoxygenated with high-purity nitrogen for 30 min before electrochemical experiments. Amperometric measurements were carried out under stirred condition.The GCE was polished with 1 and 0.3 μm alumina powder and washed with distilled water, followed by sonication in ethanol solution and distilled water, respectively. Then, the cleaned GCE was dried with a high-purity nitrogen steam for next modification. A total of 5 μL of active materials solution (1.0 mg mL−1) was dropped on the GCE surface and dried at room temperature. Finally, 5 μL Nafion solution (0.1%, diluted with ethanol) was cast onto the electrode to avoid the leakage of modified GCE.
2.4. Characterization techniques
SEM experiments were performed on JSM-6700F scanning electron microscope (JEOL), transmission electron microscopy (TEM) experiments were performed on a TecnaiG220 transmission electron microscope (FEI) with an accelerating voltage of 200 kV, High resolution transmission electron microscopy (HRTEM, JEM-2100, JEOL, Japan), X-ray photoelectron spectroscopy (XPS, ThermoVG ESCALAB 250), Raman spectroscopy (LabRAM HORIBA JY, Edison, NJ) and X-ray diffraction (XRD, Rigaku D/max-2500 VB+/PC) were utilized for the characterizations of samples.3. Results and discussion
3.1. Optimal preparation of S doped γ-MnOOH
The morphological characterization indicates that MnSO4 plays an important role in the formation of γ-MnOOH with uniform rod morphology. Without the addition of MnSO4 into the reaction system, the SEM image of the obtained product shows random plate morphology (Fig. 1a). In addition, we suggest that TAA plays an important role on the formation of γ-MnOOH with good crystallinity and uniform rod morphology. Without the addition of TAA into the reaction system, the SEM image of the obtained product shows random rod or plate morphology, which is quite different from those obtained at the presence of TAA (Fig. 1b). On the other hand, the morphology of the obtained materials depends on the amount of TAA added in the reaction system. With the increasing of TAA to the reaction system, the morphology of the obtained materials changes obviously. For example, by adding up to 0.1 g TAA, the obtained material is mainly wires with different length and stick together (Fig. 1c). Further increasing TAA to 0.2 g, it can be found that only uniform rods were created (Fig. 1d). When the amount of TAA was increased to 0.4 g, the sphere morphology was obtained (Fig. 1e). Bulk morphology is observed when the amount of TAA was increased to 0.8 g (Fig. 1f). These above SEM results indicate that an optimal amount of TAA (0.2 g) is favorable for the formation of γ-MnOOH with uniform rods. Interestingly, without the addition of KMnO4 into the reaction system, there was no solid product. | ||
| Fig. 1 SEM images of the obtained materials at 200 °C for 24 h: (a) without MnSO4, (b) without TAA, (c) 0.1 g TAA, (d) 0.2 g TAA, (e) 0.4 g TAA, and (f) 0.8 g TAA. | ||
To identify the structure and composition of the products (Fig. 1) synthesized with different experimental parameters, XRD was applied, and the result is shown in Fig. 2. It is clear that the XRD patterns indicate these products have different compositions. Without the addition of TAA into the reaction system, all the diffraction peaks can be indexed to α-MnO2 (JCPDS 44-0141),33 which is formed by the following redox reaction between MnO4− and Mn2+: 2MnO4− + 3Mn2+ + 2H2O = 5MnO2 + 4H+ (1). When the amount of TAA increases to 0.1 g, all the diffraction peaks can also be indexed to α-MnO2 (JCPDS 44-0141). As KMnO4 is excessive, so at this time another redox reaction between MnO4− and TAA, 2MnO4− + 3CH3CS(NH2) + H2O = 2MnO2 + 3S + 3CH3CO(NH2) + 2OH− (2), will happen. Further increasing TAA to 0.2 g, all observed reflections are perfectly indexed γ-MnOOH (JCPDS 41-1379). When the amount of TAA increases to 0.4 g, all the diffraction peaks can be indexed to Mn3O4 (JCPDS 24-0734).34 Because TAA is a reductant, with the increasing of TAA, the reducing ability also increases, Mn3O4 was prepared with lower valence compared to γ-MnOOH. Meanwhile, when the amount of TAA increases to 0.8 g, all the diffraction peaks can be indexed to alabandite (MnS, JCPDS 06-0518). At this time, relative to MnSO4 and TAA, KMnO4 is not excessive, and TAA is excessive. So at this time the following reactions, CH3CS(NH2) + H2O = CH3CO(NH2) + H2S (3) and Mn2+ + H2S = MnS + 2H+ (4), will happen. Being consistent with SEM results, the XRD results also indicate that an optimal the amount of TAA is favorable for the formation of γ-MnOOH, and the optimized amount of TAA is about 0.2 g. Furthermore, without the addition of MnSO4 into the reaction system, all observed reflections are perfectly indexed γ-MnOOH (JCPDS 41-1379) but without uniform rod morphology. Therefore, the effect of the hydrothermal treatment temperature on the morphology of the obtained materials is studied at 0.2 g TAA for 24 h, and the SEM images of the obtained materials at different hydrothermal temperatures are shown in Fig. 3.
 | ||
| Fig. 2 XRD patterns of the obtained materials at 200 °C for 24 h: (a) without TAA, (b) 0.1 g TAA, (c) 0.2 g TAA, (d) 0.4 g TAA, (e) 0.8 g TAA, and (f) without MnSO4. | ||
 | ||
| Fig. 3 SEM images of the obtained materials at different hydrothermal temperatures for 24 h: (a) 140 °C, (b) 160 °C, (c) 180 °C, and (d) 200 °C. | ||
It can be seen that the morphology, size, and uniformity of the as-prepared materials are connected with the hydrothermal treatment temperature. γ-MnOOH with random rod and wire shape are obtained at 140 °C (Fig. 3a). On the other hand, γ-MnOOH with rod and wire morphology are also obtained when the hydrothermal treatment temperatures are 160 °C and 180 °C (Fig. 3b and c). It should be noted that, relative to material obtained at 140 °C, rod-shaped morphology product has smaller diameter while wire-shaped morphology product has bigger diameter at 160 °C and 180 °C. Upon further raising the hydrothermal treatment temperature to 200 °C, γ-MnOOH with uniform rod morphology is obtained (Fig. 3d).
Although the morphology of the as-prepared products obviously changes in accompany with the increase of the hydrothermal treatment temperature from 140 to 200 °C, the phase structure does not change and all ascribed to γ-MnOOH. The XRD patterns of the obtained products at different hydrothermal treatment temperatures are shown in Fig. 4. The overall diffraction peaks of the obtained materials are completely indexed to γ-MnOOH. With the hydrothermal treatment temperature from 140 to 160, 180, and 200 °C, the phase structure ascribed to γ-MnOOH does not change, while only the crystallinity of the obtained materials increases. The above results clearly show that the optimum preparation temperature of γ-MnOOH with uniform rod morphology is 200 °C.
 | ||
| Fig. 4 XRD patterns of the obtained materials at different hydrothermal temperatures. | ||
To further understand the formation process of γ-MnOOH with uniform rod morphology, the systematic time-dependent experiments illustrating the evolution of the morphology and structure are performed at 200 °C when the amount of TAA is studied at 0.2 g. The SEM images of the obtained products for different hydrothermal treatment times are shown in Fig. 5. γ-MnOOH with random rod and wire shape are obtained when the reaction system is hydrothermally treated at 200 °C for 8 h (Fig. 5a). Only prolonging the hydrothermal treatment time to 16 h, γ-MnOOH with random rod and wire shape are also obtained (Fig. 5b). Continuing increase the hydrothermal treatment time to 24 h, γ-MnOOH with uniform rod morphology and a mean lateral size of 500 nm is obtained (Fig. 5c). Further prolonging the hydrothermal treatment time from 24 to 36 h, uniform rod was destroyed and the irregular morphology appeared (Fig. 5d).
 | ||
| Fig. 5 SEM images of the obtained materials at 200 °C for different hydrothermal times: (a) 8 h, (b) 16 h, (c) 24 h, and (d) 36 h. | ||
Although the morphology of them changes with the increasing of the hydrothermal treatment time from 8 to 36 h, the phase structure does not change (all ascribed to γ-MnOOH). The XRD patterns of the products obtained at different hydrothermal treatment times are shown in Fig. 6. The overall diffraction peaks of the obtained materials are completely indexed to γ-MnOOH, indicating that γ-MnOOH can be obtained by hydrothermal treatment at 200 °C for 8 h. Further prolonging the hydrothermal treatment time from 8 to 16, 24, and 36 h, the phase structure ascribed to γ-MnOOH does not change, while only the crystallinity of the obtained materials changes a little. On the basis of the SEM images and XRD patterns, it can be concluded that γ-MnOOH with uniform rod morphology can be prepared under hydrothermal treatment at 200 °C for 24 h.
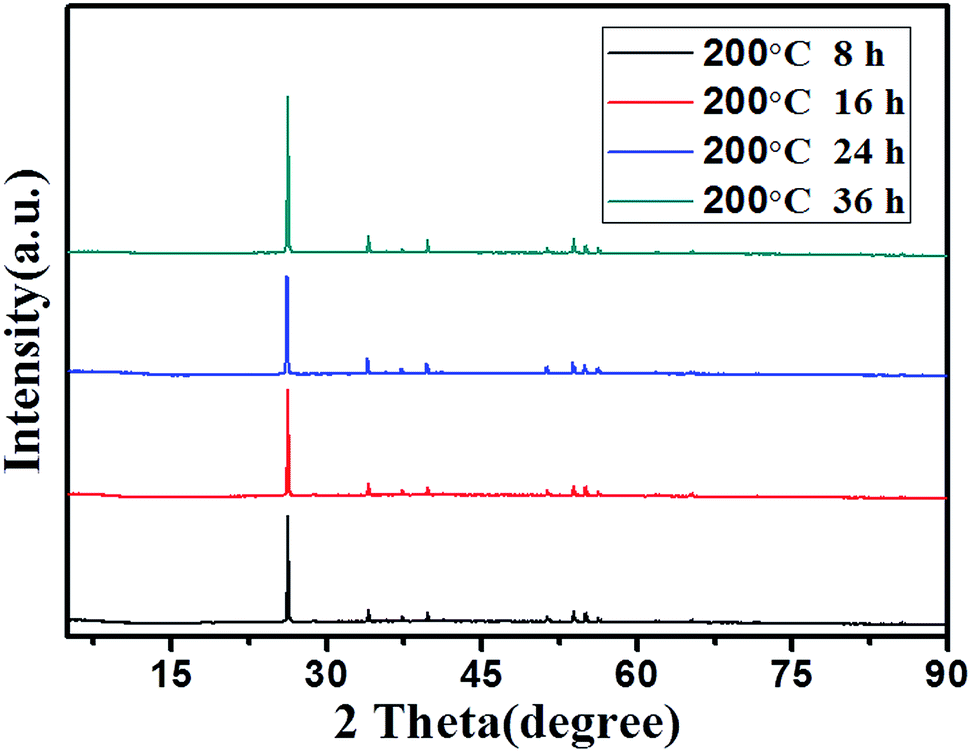 | ||
| Fig. 6 XRD patterns of the obtained materials at 200 °C for different hydrothermal times. | ||
The morphology changes of γ-MnOOH obtained at different hydrothermal treatment times support the occurrence of the growth process. TEM images of γ-MnOOH obtained at different hydrothermal stages further indicate the existence of the growth process (Fig. 7).
 | ||
| Fig. 7 TEM images of the obtained materials at 200 °C for different hydrothermal times: (a) 8 h, (b) 16 h, (c) 24 h, and (d) 36 h. | ||
3.2 Formation mechanism
On the basis of the above experimental results, a possible formation mechanism of γ-MnOOH with uniform rod morphology is presented in Fig. 8. | ||
| Fig. 8 Schematic illustration of the formation γ-MnOOH rods: (a) γ-MnOOH small nanoparticles. (b) Formation of sphere-like γ-MnOOH particles by an Ostwald ripening process. (c) Sphere-like γ-MnOOH particles oriented attachment. (d) Formation of γ-MnOOH chains through sphere-like γ-MnOOH particles bind to each other along the [−111] direction. (e) γ-MnOOH chain grown into wire. (f) γ-MnOOH wire grown into rod. | ||
In brief, firstly, large amount of nuclei form rapidly in a short time and then self-assembly to form amorphous small nanoparticles. During the hydrothermal process, an Ostwald ripening process is carried out,35 in which smaller nanoparticles dissolve while the bigger ones grow into sphere-like particles. It has been reported that MnO2 nanowires/nanorods tended to assemble along lateral surface and form thick nanorods through an oriented attachment mechanism under the hydrothermal condition since the formation of bundles could reduce the surface-to-volume ratio and the surface energy.36–38 As different crystal planes of the crystals have different energy potentials, the growth rates along different crystal planes are different. Therefore, we conceive that (−111) crystal plane of γ-MnOOH has a maximal energy in solution. Through oriented attachment, the crystal plane can reduce energy to promote the crystal growth along the surface orderly. As the surface energy of the crystal plane decreases, the growth rate gradually slows down. We believe that two mechanisms are responsible for the formation of the rods: (a) a dissolution–crystallization process that converts less ordered precursors into sphere-like particles and converts smaller diameter wires into bigger diameter rods; (b) an oriented attachment process that aggregates wires along the lateral faces to form rods.
The formation process can be described as follows: first, according to the previous report,39 as the concentration of reactants is comparatively high in the beginning; therefore, some nuclei can be formed very fast resulting in the occurrence of small nanoparticles. Meanwhile, some small nanoparticles tended to attachment, and this attachment might be attributed to the destruction of the stabilization layer around each nanoparticle.40 In addition, the aspect ratios of those small nanoparticles make us believe that those nanoparticles just began to grow into sphere-like particles. Second, sphere-like particles had grown into wire-shaped anisotropic nanostructures with the assistance of TAA. The sphere-like particles orient to form one dimensional wires and grow fast along the (−111) direction to form small diameter 1D wires. Once the nuclei had been formed, the morphology of the sphere-like particles changed very quickly from particles to wires and wire aggregates. In this period, we think the source of the γ-MnOOH molecules for the growth of the wires come from two aspects: the reactants of the solution on one side, and the dissolution of the sphere-like particles on the other side. With the rapid growth of wires and wire aggregates, the concentration of the reactants decreased, and then the dissolution process became dominant. Third, as the reaction proceeded, meanwhile, some wires tended to assemble along their side surfaces to reduce the surface energy. The small gaps between wires were filled rapidly due to coarsening during aging, which led to reconstruction of boundaries and smoothing of the surfaces. That is the reason why the rods show a single-crystalline nature. That is to say, at this stage, wire aggregates began to evolve its morphology into rods, and then the wire-like intermediate transformed into the rod structure after continuous growth through a dissolution–recrystallization process. At last, the rods were formed due to the hydrothermal process providing sufficient energy for the dissolution and recrystallization of those wire-like crystals. In addition, the transition of wires into rods indicates that the wires and wire aggregates are intermediate states between small nanoparticles and rod states, but they are not in a metastable state, as this transformation happens only in the reaction solution. On the basis of the above discussions, it sounds reasonable to conclude that the reactions follow a nucleation–dissolution anisotropic growth–recrystallization mechanism. A similar mechanism of nucleation–dissolution–recrystallization, suggested by Qian and co-workers,41 has been accounted for the formation of Te nanotube. It is necessary to note that the dissolution–crystallization and oriented attachment are two simultaneous processes in the crystal growth,42 the separated stages in Fig. 8 are illustrated just for the convenience of explanation.
In our experiments, the introduction of TAA is important and ingenious. On the one hand, the TAA itself could serve as an appropriate reducing agent. On the other hand, a part of TAA would hydrolyze in the aqueous solution, generate H2S and provide a weak acidic reaction circumstance, which was believed good for the formation and growth of γ-MnOOH rods. Meanwhile, the S element of TAA is also entered into the crystal lattice of γ-MnOOH, thus formed S-doped γ-MnOOH. Certainly, this mechanism needs to be confirmed by further studies.
3.3 Characterization of S doped γ-MnOOH with uniform rod morphology
XRD pattern of the as prepared γ-MnOOH with uniform rod morphology is shown in Fig. 9a. All observed reflections are perfectly indexed on the monoclinic unit cell for γ-MnOOH with parameters a = 5.300 Å, b = 5.278 Å, c = 5.307 Å, and β = 114.36° (JCPDS 41-1379).7 The main diffraction peaks located at 26.4, 34.2, 35.9, 37.5, 40.0, 41.4, 51.7, 54.2, 55.4, 56.6, 62.4, 65.5, and 65.7° can be indexed to the (−111), (020), (111), (200), (−121), (−202), (210), (022), (−222), (−311), (−131), (131), and (202) planes, respectively. It reveals clearly that single-phase γ-MnOOH material has been obtained. The diffraction peaks are sharp and symmetric, indicating that the as prepared γ-MnOOH crystal has high crystallinity. The very notable (−111) diffraction line suggests a preferred orientation of the product, which could be further evidenced in HRTEM observation.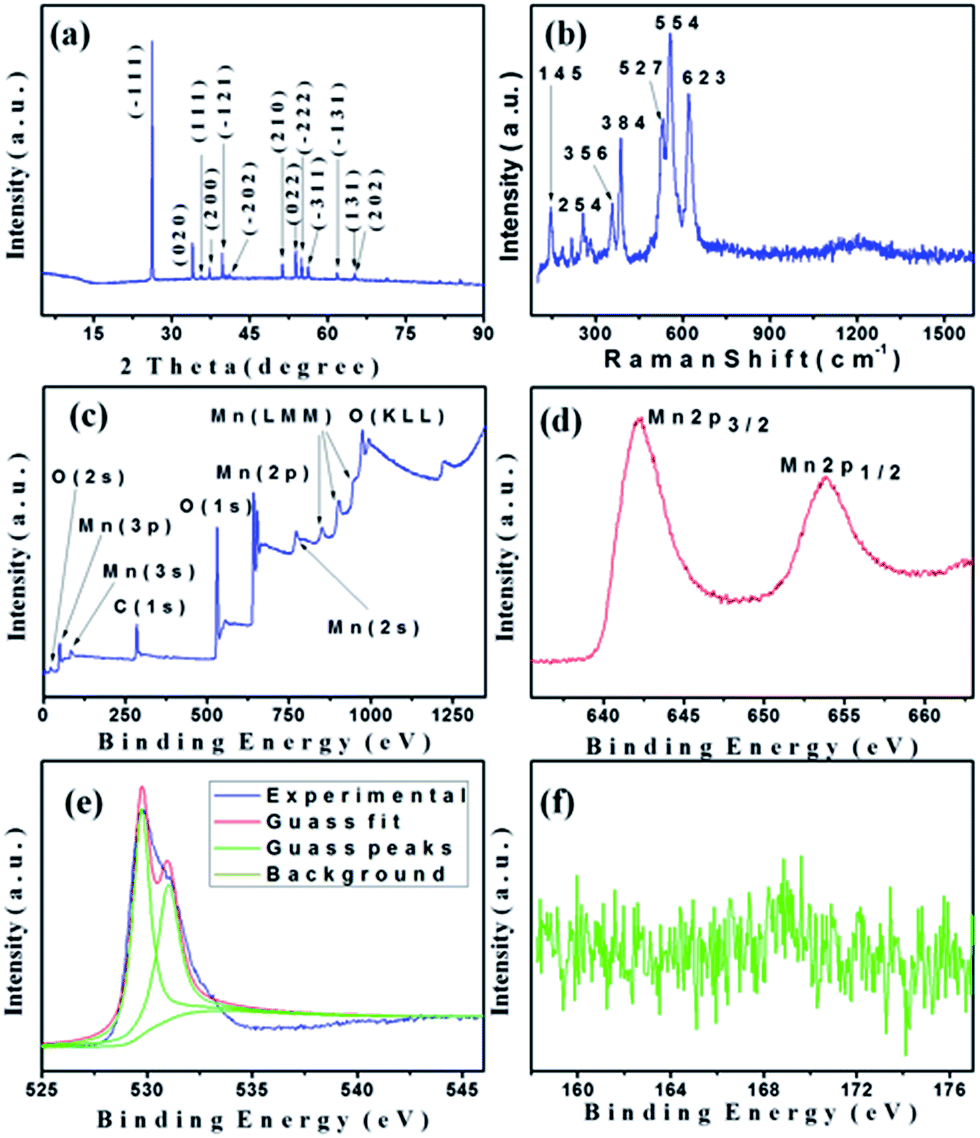 | ||
| Fig. 9 (a) XRD pattern, (b) Raman spectrum, (c) XPS spectrum, (d) XPS spectrum of Mn2p, (e) XPS spectrum of O1s, and (f) XPS spectrum of S2p of the γ-MnOOH. | ||
Raman spectroscopy is a powerful experimental technique for the identification and characterization of the local manganese environment. It further confirms our product as γ-MnOOH. As reported in the literature,43,44 γ-MnOOH shows well resolved and sharp Raman bands with the main peaks at 142, 352, 384, 528, 552 and 615 cm−1 together with another four minor peaks, which reflect good crystallinity. The Raman spectrum of our as-prepared γ-MnOOH is shown in Fig. 9b, well resolved peaks can be seen at 145, 254, 356, 384, 527, 554 and 623 cm−1, which agrees well with the previous data in the literature.43,44
Fig. 9c presents the XPS spectrum of γ-MnOOH. XPS is best known for its capability in disclosing the chemical states of a surface, and it also further confirms our product as γ-MnOOH. The XPS results show photoelectron peaks of Mn, O, the contaminant C, and the Auger peaks of Mn LMM and O KLL. The Mn2p spectrum exhibits two major peaks with binding energy values at 653.8 and 642.2 eV, corresponding to the Mn2p1/2 and Mn2p3/2 peaks (Fig. 9d).17 The observed binding energies of the Mn2p3/2 and Mn2p1/2 for the γ-MnOOH rods are in good agreement with data on γ-MnOOH. The XPS spectrum of O1s (Fig. 9e) consists of two peaks, which correspond to lattice oxygen and adsorption oxygen on the sample surface.45 The O1s spectrum has its maximum near 530 eV and a distinct shoulder with a pronounced tail on the high energy side of the peak. The separation of the O1s peak was deconvoluted by Gaussian fits. The peak at 530.8 eV corresponds to the lattice oxygen species (O2−, OH−), which reflect the redox behavior of the metal. The peak at 532.5 eV corresponds to the adsorption oxygen species (O2−, O22−), whose content reflects the concentration of oxygen vacancy in the compound. By trapping electrons, adsorption oxygen becomes the active center for the oxidation, which leads to the formation of O2−.45 It was confirmed by XPS that there are no obvious impurity such as K (from the KMnO4) detected in the samples. It was also confirmed by XPS that there is S element detected in the samples (Fig. 9f).
Furthermore, the elemental analysis by SEM-EDS also confirms the presence of Mn, O, and S elements (Fig. 10a–d). The crystal structure is further characterized by HRTEM and selected area electron diffraction (SAED) pattern analyses in Fig. 10e and f. The HRTEM image enables a clear view of lattice fringes, which are shown in Fig. 10e. The well-resolved lattice fringes give an inter-planar spacing of 0.34 nm, corresponding with the distance of the (−111) plane of γ-MnOOH.7 This indicates that the growth of the microrods is along the [−111] direction and the results agree well with the XRD result. Moreover, the corresponding SAED pattern performed on an individual rod in Fig. 10f indicates that the rod is of single crystal and can be indexed as the monoclinic MnOOH phase, which is in accordance with the XRD result in Fig. 9a. These results indicate γ-MnOOH with high crystallinity and uniform rod morphology can be prepared at 200 °C for 24 h in the typical experiment.
 | ||
| Fig. 10 (a–d) Multi-element EDS mapping images, (e) HRTEM image, and (f) SAED pattern of the γ-MnOOH. | ||
3.4 Electrochemical N2H4 sensor application
To testify the sensing ability of the created S-doped γ-MnOOH under the optimized experimental conditions, we designed a non-enzymatic N2H4 sensor. Fig. 11a shows the cycling voltammetry (CV) of the modified GCE in the absence and presence of N2H4. It is clear that there is no electrochemical oxidation peak observed when N2H4 was not in the system. However, when 0.1 mM N2H4 was added to the system, the obvious oxidation peak at 0.694 V was seen. Therefore, we expected that the modified GCE would have the excellent performance as a N2H4 sensor. It can be found that the electrochemical response is irreversible, as no cathodic current is observed during the reverse sweep. | ||
| Fig. 11 (a–f) N2H4 sensor: (a) CV of GCE modified with S doped γ-MnOOH in 0.1 M PBS solution (pH = 7.4) at a scan rate 50 mV s−1; (b) I–T response with working potential at 0.55 V; (c) the enlarged view of the I–T response with the addition of low concentration level of N2H4; and (d–f) the calibration curve. | ||
According to the previous report,30 a possible electrochemical reaction for the N2H4 is proposed to be N2H4 + 5/2OH− → 1/2N3− + 1/2NH3 + 5/2H2O + 2e−. As faster electron transfer leads to a sharper and more well-defined peak, the substantial increase in the peak current reflects a faster electron transfer reaction and the increase of reversibility of the electron transfer process. Therefore, N2H4 can be effectively detected by oxidation on the modified GCE. The pH of the solution is important to obtain efficient electrocatalytic oxidation of N2H4, and it was reported that the electrocatalytic oxidation of N2H4 can be improved by increasing the pH value of the solution (pH > 7).30 Therefore, we maintained pH 7.4 for all the electrochemical experiments. Fig. 11b and c present the current–time (I–T) plot of the modified GCE with successive adding N2H4. As the N2H4 is injected, the steady-state currents reach another steady-state value (98% of the maximum) in less than 2 s. The linear relationship between the catalytic current and the concentration is shown in Fig. 11d–f. Our electrochemical N2H4 sensor has wide linear range 0.1 μM–1.15 mM (correlation coefficient: 0.998) and 1.15–45.75 mM (correlation coefficient: 0.999), and a detection limit of 0.079 μM at a signal-to-noise ratio of 3. As can be seen from Table 1, our sensor has larger linear range and lower detection limit compared to the previous N2H4 sensors.
| Electrode materials | Potential (V) | Linear range (mM) | LOD (mM) | Ref. |
|---|---|---|---|---|
| ZnO–carbon nanotube | 0.4 | 6 × 10⁻⁴ to 0.25 | 1.8 × 10⁻⁴ | 46 |
| ZnO nanonails | −0.5–0.4 | 1 × 10⁻⁴ to 1.2 × 10⁻³ | 2 × 10⁻⁴ | 30 |
| MnO2–carbon nanotube | 0.3 | 5 × 10⁻⁴ to 1 | 2 × 10⁻⁴ | 47 |
| Au–TiO2 | 0.2 | 2.5 × 10⁻³ to 0.5 | 5 × 10⁻⁴ | 48 |
| Micro/nano ZnO | 0.1 | 8 × 10⁻⁴ to 0.2 | 2.5 × 10⁻⁴ | 49 |
| S Doped γ-MnOOH | 0.55 | 1 × 10⁻⁴ to 1.15 | 7.9 × 10⁻⁵ | This work |
| 1.15–45.75 |
The wide linear range and low detection limit may be due to the unique structure of S-doped γ-MnOOH microrods. The presence of the S-doped γ-MnOOH microrods in GCE with high surface area provides the platform for the N2H4 oxidation by contributing excess electroactive sites, which effectively enhanced the catalytic activity for N2H4 oxidation. In addition, their good crystalline structure and facile accessibility of enormous nanoscale transport channels resulted from the micromaterial structure can also cause efficient electron transportation, greatly enhanced adsorption and the rate of electron transfer from N2H4 to electrode. Thus, the S-doped γ-MnOOH microrods can be used as modification layer to improve the sensitivity of the N2H4 oxidative detection.
The selectivity of the modified GCE towards N2H4 was studied for a number of potential interferents, and the result is shown in Fig. 12a. Here, we defined the tolerance limit as the molar ratio of potential interfering substance/N2H4 that caused the change of peak current less than 5% for the determination of 0.01 mM N2H4. It was found that 5-fold hydroxylamine(NH2OH), 12-fold NH3, 18-fold H2O2, dopamine, and glucose, 30-fold Zn2+, Cu2+, Ca2+, NO3−, Cl−, SO42− have no obvious interfere on the determination of N2H4. The reproducibility of the modified GCE was examined by repetitive detection of 0.01 mM N2H4, there was about 4.59% decrease in the response towards 0.01 mM N2H4 after 60 times, demonstrating high antifouling ability of our N2H4 sensor (Fig. 12b). The storage stability measured every 2–3 days over a 21-days period. When not in use, the modified electrode was stored in air at room temperature. There was about 3.69% decrease in the response towards 0.01 mM N2H4 after 21 days, indicating that our S doped γ-MnOOH modified GCE maintained its catalytic activity very well and could be used for a long time (Fig. 12c).
 | ||
| Fig. 12 (a–c) N2H4 sensor: (a) selectivity; (b) reuse ability; and (c) long-term stability. | ||
4. Conclusions
In summary, S doped γ-MnOOH rods with uniform morphology were prepared by a one-step hydrothermal process. The growth mechanism was studied and discussed preliminarily based on the observations in different growth stages. The synthesized γ-MnOOH rods were further utilized for the fabrication of a high-performance electrochemical N2H4 sensor, and the fabricated N2H4 sensor exhibited a fast amperometric response to N2H4 with wide linear range and low detection limit. The superior performance of our sensor is ascribed to the unique structure of the synthesized S-doped γ-MnOOH rods. On the one hand, we utilized TAA as auxiliary-reductant and morphology regulator. On the other hand, a part of TAA would hydrolyze in the aqueous solution, generate H2S and provide a weak acidic reaction circumstance, which was believed good for the formation and growth of γ-MnOOH rods. Meanwhile, the S element of TAA is also entered into the crystal lattice of γ-MnOOH, thus formed S-doped γ-MnOOH. Such novel 1D material shows great promise for fabricating nonenzymatic electrochemical N2H4 sensor with high sensitivity and selectivity, improved stability, and fast amperometric response.Acknowledgements
The authors gratefully acknowledge the financial support from the National Natural Science Foundation of China (NSFC, Grant No. 51573013). We would like to thank the financial support of the China Scholarship Council (CSC) for a PhD scholarship in University of Bremen.Notes and references
- L. Zhang, X. Zhang, Z. Wang, J. Xu, D. Xu and L. Wang, Chem. Commun., 2012, 48, 7598–7600 RSC.
- H. Zhong, Y. Yang, F. Ding, D. Wang, Y. Zhoukb and H. Zhan, Chem. Commun., 2015, 51, 6164–6167 RSC.
- W. Sun, A. Hsu and R. Chen, J. Power Sources, 2011, 196, 627–635 CrossRef CAS PubMed.
- G. R. Williams, A. J. Norquist and D. O'Hare, Chem. Mater., 2006, 18, 3801–3807 CrossRef CAS.
- L. Gao, L. Fei and H. Zheng, Mater. Lett., 2007, 61, 1785–1788 CrossRef CAS PubMed.
- N. Chandra, S. Bhasin, M. Sharma and D. Pal, Mater. Lett., 2007, 61, 3728–3732 CrossRef CAS PubMed.
- T. Gao, F. Krumeich, R. Nesper, H. Fjellvåg and P. Norby, Inorg. Chem., 2009, 48, 6242–6250 CrossRef CAS PubMed.
- M. S. El-Deab and T. Ohsaka, J. Electrochem. Soc., 2008, 155, D14–D21 CrossRef CAS PubMed.
- C. C. Hu, Y. T. Wu and K. H. Chang, Chem. Mater., 2008, 20, 2890–2894 CrossRef CAS.
- J. Wang, X. Zhao, J. Li, X. Kuang, Y. Fan, G. Wei and Z. Su, ACS Macro Lett., 2014, 3, 529–533 CrossRef CAS.
- Z. Ouyang, J. Li, J. Wang, Q. Li, T. Ni, X. Zhang, H. Wang, Q. Li, Z. Su and G. Wei, J. Mater. Chem. B, 2013, 1, 2415–2424 RSC.
- Z. Su, J. Ding and G. Wei, RSC Adv., 2014, 4, 52598–52610 RSC.
- P. Zhang, X. Zhao, Y. Ji, Z. Ouyang, X. Wen, J. Li, Z. Su and G. Wei, J. Mater. Chem. B, 2015, 3, 2487–2496 RSC.
- P. Zhang, X. Zhao, X. Zhang, Y. Lai, X. Wang, J. Li, G. Wei and Z. Su, ACS Appl. Mater. Interfaces, 2014, 6, 7563–7571 CAS.
- L. Lan, Q. Li, G. Gu, H. Zhang and B. Liu, J. Alloys Compd., 2015, 644, 430–437 CrossRef CAS PubMed.
- L. Wang and D. L. Wang, Electrochim. Acta, 2011, 56, 5010–5015 CrossRef CAS PubMed.
- T. S. Jeyagowry, D. Jian, J. Gan Geok, W. Effendi and E. Low Qui Hui, Nanotechnology, 2007, 18, 025601 CrossRef.
- G. R. Patzke, F. Krumeich and R. Nesper, Angew. Chem., Int. Ed., 2002, 41, 2446–2461 CrossRef CAS.
- F. Li, J. Wu, Q. Qin, Z. Li and X. Huang, J. Alloys Compd., 2010, 492, 339–346 CrossRef CAS PubMed.
- W. Bai, F. Nie, J. Zheng and Q. Sheng, ACS Appl. Mater. Interfaces, 2014, 6, 5439–5449 CAS.
- X. Cao, N. Wang, L. Wang, C. Mo, Y. Xu, X. Cai and L. Guo, Sens. Actuators, B, 2010, 147, 730–734 CrossRef CAS PubMed.
- X. Cao, X. Cai and N. Wang, Sens. Actuators, B, 2011, 160, 771–776 CrossRef CAS PubMed.
- U. Ragnarsson, Chem. Soc. Rev., 2001, 30, 205–213 RSC.
- X. Yan, F. Meng, S. Cui, J. Liu, J. Gu and Z. Zou, J. Electroanal. Chem., 2011, 661, 44–48 CrossRef CAS PubMed.
- X. Li, S. Zhang and C. Sun, J. Electroanal. Chem., 2003, 553, 139–145 CrossRef CAS.
- A. Safavi and M. A. Karimi, Talanta, 2002, 58, 785–792 CrossRef CAS.
- G. E. Collins, S. Latturner and S. L. Rose-Pehrsson, Talanta, 1995, 42, 543–551 CrossRef CAS.
- S. K. Kim, Y. N. Jeong, M. S. Ahmed, J. M. You, H. C. Choi and S. Jeon, Sens. Actuators, B, 2011, 153, 246–251 CrossRef CAS PubMed.
- J. Ding, S. Zhu, T. Zhu, W. Sun, Q. Li, G. Wei and Z. Su, RSC Adv., 2015, 5, 22935–22942 RSC.
- A. Umar, M. M. Rahman, S. H. Kim and Y. B. Hahn, Chem. Commun., 2008, 166–168 RSC.
- H. Zhao, F. Li, X. Liu, W. Xiong, B. Chen, H. Shao, D. Que, Z. Zhang and Y. Wu, Electrochim. Acta, 2015, 166, 124–133 CrossRef CAS PubMed.
- L. He, S. Zhang, X. Wei, Z. Du, G. Liu and Y. Xing, J. Power Sources, 2012, 220, 228–235 CrossRef CAS PubMed.
- M. Sun, B. Lan, T. Lin, G. Cheng, F. Ye, L. Yu, X. Cheng and X. Zheng, CrystEngComm, 2013, 15, 7010–7018 RSC.
- L. Wang, Y. Li, Z. Han, L. Chen, B. Qian, X. Jiang, J. Pinto and G. Yang, J. Mater. Chem. A, 2013, 1, 8385–8397 CAS.
- J. Ding, W. Sun, G. Wei and Z. Su, RSC Adv., 2015, 5, 35338–35345 RSC.
- T. Gao, M. Glerup, F. Krumeich, R. Nesper, H. Fjellvåg and P. Norby, J. Phys. Chem. C, 2008, 112, 13134–13140 CAS.
- D. Portehault, S. Cassaignon, E. Baudrin and J. P. Jolivet, Chem. Mater., 2007, 19, 5410–5417 CrossRef CAS.
- S. Chen, J. Zhu, Q. Han, Z. Zheng, Y. Yang and X. Wang, Cryst. Growth Des., 2009, 9, 4356–4361 CAS.
- D. Zheng, S. Sun, W. Fan, H. Yu, C. Fan, G. Cao, Z. Yin and X. Song, J. Phys. Chem. B, 2005, 109, 16439–16443 CrossRef CAS PubMed.
- J. Chen, T. Herricks, M. Geissler and Y. Xia, J. Am. Chem. Soc., 2004, 126, 10854–10855 CrossRef CAS PubMed.
- G. Xi, Y. Peng, W. Yu and Y. Qian, Cryst. Growth Des., 2005, 5, 325–328 CAS.
- Y. Li, H. Tan, O. Lebedev, J. Verbeeck, E. Biermans, G. van Tendeloo and B. L. Su, Cryst. Growth Des., 2010, 10, 2969–2976 CAS.
- C. M. Julien, M. Massot and C. Poinsignon, Spectrochim. Acta, Part A, 2004, 60, 689–700 CrossRef CAS.
- J. Zhou, L. Yu, M. Sun, B. Lan, F. Ye, J. He and Q. Yu, Mater. Lett., 2012, 79, 288–291 CrossRef CAS PubMed.
- W. Yang, J. Hao, Z. Zhang, B. Lu, B. Zhang and J. Tang, Catal. Commun., 2014, 46, 174–178 CrossRef CAS PubMed.
- B. Fang, C. Zhang, W. Zhang and G. Wang, Electrochim. Acta, 2009, 55, 178–182 CrossRef CAS PubMed.
- M. Wang, C. Wang, G. Wang, W. Zhang and F. Bin, Electroanalysis, 2010, 22, 1123–1129 CrossRef CAS PubMed.
- G. Wang, C. Zhang, X. He, Z. Li, X. Zhang, L. Wang and B. Fang, Electrochim. Acta, 2010, 55, 7204–7210 CrossRef CAS PubMed.
- Y. Ni, J. Zhu, L. Zhang and J. Hong, CrystEngComm, 2010, 12, 2213–2218 RSC.
| This journal is © The Royal Society of Chemistry 2015 |