Zhicong Shi,
Zhanzhong Wang,
Ting Zhang,
Leping Dang* and
Hongyuan Wei
School of Chemical Engineering and Technology, Tianjin University, Tianjin 300072, People's Republic of China. E-mail: dangleping@tju.edu.cn; Fax: +86-22-27400287; Tel: +86-22-27405754
First published on 9th November 2015
Moxidectin is a single-component and semisynthetic macrocyclic lactone antibiotic, which has been widely used in the prevention and treatment of parasites in farm animals. In this paper, the transformation of ethanol solvate to form I of moxidectin in an ethanol–water mixture was studied. Offline methods and online instruments were used to monitor and identify the transformation process, and the influences of water content and temperature were discussed. It is noted that the transformation kinetics are highly sensitive to both the solvent composition and temperature and the transformation rate is a function of the ethanol content in aqueous ethanol mixtures. The solvent-mediated polymorphic transformation mechanism from ethanol solvate to form I was suggested, and the process is controlled by the nucleation and growth rate of the stable form. Understanding these effects can aid optimization and improve process control in the crystallization of moxidectin.
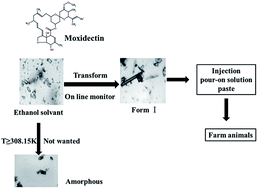
In the traditional research, off line techniques including powder X-ray diffraction (PXRD),10 differential scanning calorimetry (DSC)11,12 and thermogravimetric analysis (TGA)13 were widely used to identify the polymorphic transformation. Recently, online technologies including focused beam reflectance measurement (FBRM), particle vision measurement (PVM), Fourier transform infrared (FTIR) and online Raman spectroscopy have been introduced to monitor the phase transformation in situ. FBRM,14 for an example, can be applied to in situ record the change of the chord length distribution and particle counts during the transformation. PVM6 and FTIR15 have been used to trace the morphology of solid phase and concentration of the liquid phase in real time. Moreover, online Raman spectroscopy7,16 is a useful on-line technique which can be used to analyze the composition of the solid phase in situ.
Moxidectin17,18 is single-component and semisynthetic macrocyclic lactone agricultural antibiotic belonging to the class of milbemycin, which is the derivative of nemadectin and produced by fermentation of Streptomyces. Because of its broad-spectrum, high efficiency and safety, moxidectin is widely used in the prevention and treatment of parasites in mammals such as cattle and sheep etc. The structure of moxidectin is shown in Fig. 1. As it can be seen moxidectin has methoxine in C-23, which makes it has higher solubility in organic solvent compared with ivermectin, so it can be made into different drugs with different excipients such as injection,19 paste,20 pour-on solution21 etc.
Two forms of moxidectin have been reported including a single crystal structure named form I22,23 in 1988, and an ethanol solvate24 in 2013. In our study we found that when the temperature was equal or higher than 308.15 K, solid-state transformation of ethanol solvate to amorphous form of moxidectin would occur, indicating that ethanol solvate was not stable during the drying, formation, storage and transport of moxidectin. However we also found that form I could be prepared in ethanol with water as anti-solvent, due to its good solubility in ethanol and insolubility in water. The hydrogen bonds between moxidectin and water molecular would drive the formation of sticky gel product, which could debase the quality of crystals and make the process operation difficult.25 In our research, we have found that after ethanol solvate was obtained by cooling crystallization, it would transform to form I when it was heated up to 308.15 K. It is very important to study the transformation of ethanol solvate to form I in order to obtain form I without gelation. No reference was found on the transformation of these two forms of moxidectin by far.
In this paper, the transformation of ethanol solvate to form I of moxidecitn in ethanol–water mixture was studied. FBRM, PVM and on-line FTIR were introduced to in situ monitor the transformation process and the factors affecting the transformation were investigated. This work gives better understanding on the polymorphic transformation mechanism of moxidecitn, as well as offers a novel way and critical information to control the manufacture process of commercial form I products.
PXRD experiments were conducted by a D/max-2500 diffractometer (Rigaku, Japan) at 40 kV, 100 mA with a Cu Kα radiation (1.5406 Å). The diffraction data were collected from 2° to 35° in 2θ, with a scan speed of 8° min−1.
The FTIR spectra were obtained by a TENSOR 27 spectrometer (Bruker, Germany) using KBr powder as the background, with wavenumber ranges from 3600 to 400 cm−1.
The crystal morphologies were captured by a BX51 optical microscope (Olympus, Japan) with a 40× objective lens and a 10× ocular lens.
Temperature (K) | Water content (mol%) | Stirrer speed (rpm) | Solid loading (g) | |
---|---|---|---|---|
1 | 303.15 | 0.60 | 500 | 3.0 |
2 | 303.15 | 0.65 | 500 | 3.0 |
3 | 303.15 | 0.70 | 500 | 3.0 |
4 | 298.15 | 0.70 | 500 | 1.6 |
5 | 303.15 | 0.70 | 500 | 1.6 |
6 | 308.15 | 0.70 | 500 | 1.6 |
A M400LF FBRM probe (Mettler Toledo, Switzerland) was inserted in the vessel to record the change of particle counts at an interval of 60 seconds. The crystal morphologies were investigated by HNK250 PVM (Mettler Toledo, Switzerland) once a minute. ReactIR 4000 FTIR (Mettler Toledo, Switzerland) was introduced to trace the concentration of solution in real time with an interval of 60 seconds, with wavenumber from 3600 to 400 cm−1. During the transformation, the slurry was sampled and filtered by a Buchner funnel at different time. The solid was dried at 303.15 K and measured by XRD to analyze the solid composition.
The FTIR spectra of ethanol solvate and form I are presented in Fig. 3, which can be used to further identify the two forms of moxidectin. It can be seen that the CO stretching vibration occurs at 1734 cm−1 for ethanol solvate and shifts to 1707 cm−1 for form I. Two hydroxyl groups in moxidectin molecule can form hydrogen bonds with two ethanol molecules respectively. Hydroxyl group on C-5 is as a donor and hydroxyl group on C-7 is as an acceptor. The presence of hydrogen bonds makes the crystal structures of ethanol solvate and form I are different, which changes the C
O stretching vibration position.
The morphologies of ethanol solvate and form I crystals were captured by optical microscope and shown in Fig. 4. It is found that ethanol solvate is plate-shaped, while form I is needle-shaped. Therefore, PVM can be introduced to trace the change of crystal morphologies in the transformation process.
The transformation of ethanol solvate to form I of moxidectin in ethanol–water mixture was studied by FBRM, PVM, and on-line FTIR in real time and the result are shown in Fig. 5–7, respectively.
![]() | ||
Fig. 5 Trend of particle counts for various size ranges over time at an initial water content of 0.60 mol%, a temperature of 303.15 K, and a stirrer speed of 500 rpm. |
![]() | ||
Fig. 6 Change of morphology of solid phase with time at an initial water content of 0.60 mol%, a temperature of 303.15 K, and a stirrer speed of 500 rpm. |
![]() | ||
Fig. 7 Change of moxidectin concentration with time at an initial water content of 0.60 mol%, a temperature of 303.15 K, and a stirrer speed of 500 rpm. |
Fig. 5 shows the change of particle counts of moxidectin for various size ranges during the transformation. It can be seen that there is an obvious increase of particle counts after the adding of moxidectin ethanol solvate, followed by a rapid decrease due to the dissolution of the solid for various size ranges. The dissolution of ethanol solvate makes the solution to be supersaturated with regard to form I, and drives the nucleation and growth of form I. As time goes on, there appears an increase of small particle counts monitored by FBRM due to the nucleation and growth of form I. Fig. 5 also demonstrates that the particle counts are almost unchanged until after 5 h, which means there exists delay time before the transformation, followed by a rapid increase of particle number, which suggests the nucleation of form I and the start of the transformation. After about 20 hours, all of the particle counts are almost constant, indicating that the system reached thermodynamic equilibrium, and the transformation is completed. The transformation process starts from fifth hour and finishes at twentieth hour, and the whole process lasts for about fifteen hours.
Fig. 6 shows the change of morphology of moxidectin during the transformation captured by PVM. It can be seen that the plate-shaped ethanol solvate crystals are dominated in the solution at the beginning of the transformation. After about 5 hours, a small number of needle-shaped form I crystals appear in the solution, demonstrating the nucleation and growth of the stable form. With the transformation processing, the number of the needle-shaped form I increases and its crystal size becomes bigger. Mainly large needle-shaped form I crystals are captured 18 h after seeding. The change of crystal morphology during the transformation provided by PVM is consistent with the FBRM data discussed above, which reveals that the transformation process consisted of the dissolution of the metastable form and the nucleation and growth of the stable form.
Fig. 8 shows the XRD diffraction patterns of moxidectin solid sampled at different time during the transformation, which confirms the complete transformation from ethanol solvate of moxidectin to form I in the solution within 20 h. At the beginning of the transformation, only character peaks of ethanol solvate (7.740, 8.121, 8.501, 10.522, 11.599) could be detected, and after 5 h there appears small weak character peaks of form I. The relative intensities of character peaks of ethanol solvate decrease along with time, in the meanwhile those of form I increase gradually. After about 20 h, only character peaks of form I (7.099, 8.916, 9.700, 11.120 12.041, 12.822, 15.180, 16.542, 17.880) exist without those of ethanol solvate in the solid, indicating that ethanol solvate has completely transformed to form I, and the result is consistent with the PVM images and FBRM data.
Since the solvent composition has a significant effect on solvent-mediated transformation, the transformation experiments of ethanol solvate to form I of moxidectin in ethanol–water mixtures with different water contents were carried out to study the effect of water content on the transformation and the results were shown in Fig. 9.
![]() | ||
Fig. 9 Change of particle counts (10–50 μm) over time at different water contents, a temperature of 303.15 K, and a stirrer speed of 500 rpm. |
FBRM data shows that the transformation times vary a lot at different water contents. The particle counts of small particle begin to increase after about 5 h, and then it take 16 h to complete the transformation in ethanol–water mixture containing 0.6 mol% water. The transformation will be completed in 12 h when water content reached to 0.65 mol%. When the transformation experiment is carried out in ethanol–water mixture containing 0.7 mol% water, the small particle of form I appears in the solution just after 4 h, and it take 8 h for the system to reach thermodynamic equilibrium. From the FBRM data, it can be concluded that it takes less time for ethanol solvate to transform to form I as water content increases.
As there exists interaction between ethanol in ethanol solvate and water molecule in the solution, water content in the mixture plays an important role in the transformation process, just as the same phenomena many studies have pointed out in anhydrous/hydrate system.27,28 During the transformation, since the interaction between ethanol molecule and water molecule is stronger than the hydrogen bond formed between ethanol molecule and moxidectin molecule, desolvation of ethanol solvate will happen and then ethanol molecule is released into ethanol–water mixture, then followed by the nucleation of form I through the structural rearrangement of moxidectin. The interaction between water and ethanol increases as water content in ethanol–water mixture increases, which can promote the removal of ethanol, and then accordingly accelerate the transformation process.
In this binary solvent system, the transformation between ethanol solvate and form I is enantiotropic, and there exists a water content called equilibrium water content (x*), at which both of the metastable form and the stable form could coexist in the suspension. When the water content is higher than x*, form I is the stable form. Otherwise, ethanol solvate is the stable one. The difference between x and x* is the driving force of the transformation. “x − x*” increases as water content increases in ethanol–water mixture. As a consequence, compared with the transformation experiments carried out in mixture containing 0.60 and 0.65 mol% water, the nucleation and growth of form I in mixture containing 0.70 mol% water was much faster.
![]() | ||
Fig. 10 Change of particle counts (10–50 μm) over time at different temperatures, an initial water content of 0.70 mol%, and a stirrer speed of 500 rpm. |
Fig. 10 shows that transformation rate is highly related with experimental temperature. When the transformation experiments are carried out at 298.15 K, 303.15 K and 308.15 K, the induced period are 42 h, 5 h and 1 h, respectively, and the corresponding transformation time are 52 h, 8 h and 3 h, respectively. It could be concluded that it takes less time for transformation of ethanol solvate to form I as the temperature increases.
For the enantiotropic polymorphic system, there exists an equilibrium temperature under a certain solvent composition. When the temperature is lower than the equilibrium temperature, ethanol solvate is the stable form, otherwise, form I is the stable one. When the temperature is higher than the equivalent temperature, the difference between the solubility of ethanol solvate and form I becomes larger as the temperature increases, which will accelerate the dissolution of ethanol solvate. Higher temperature would break the hydrogen bonds much easier due to faster molecule motion, which would make the desolvation of ethanol solvate much easier, and accordingly result in shorter transformation time. Higher temperature would accelerate molecule motion and reduce the interfacial energy between the solid and liquid phase. Both of the effects caused by higher temperature was beneficial to the nucleation of form I, which could shorten the transformation time obviously. It is can be seen that temperature is the key factor whether ethanol molecules can exist in ethanol solvate stably, and it affects the transformation process significantly.
This journal is © The Royal Society of Chemistry 2015 |