Study of the electronic structure, stability and magnetic quenching of CrGen (n = 1–17) clusters: a density functional investigation

Kapil Dhaka and Debashis Bandyopadhyay*
Department of Physics, Birla Institute of Technology and Science, Pilani, Rajasthan 333031, India. E-mail: debashis.bandy@gmail.com

Received 16th July 2015 , Accepted 16th September 2015

First published on 16th September 2015


Abstract

In the present report the evolution of the electronic structure, stability and magnetic quenching of CrGen nanoclusters has been carried out using density functional theory (DFT). From the nature of the variation of the different thermodynamic and chemical parameters, the CrGe10 and CrGe14 ground state clusters are identified as the most stable species. It is observed that the enhanced stability of CrGe10 and CrGe14 are due to the closed shell filled structure of the Cr-atomic orbitals and follow the 18-electron counting rule. It is found that the strong mixing of the Cr d-orbital with the s- and p-atomic orbitals of the Ge atoms in the cluster are mainly responsible for the stability and quenching of the Cr magnetic moment in the clusters. Calculated CPs also give additional information about the bonding and its effect on the stability of the clusters. Calculated IR and Raman spectra also support these results.

1 Introduction

In recent times mid 3d-transition metal encapsulated semiconductor nanoclusters have attracted a lot of interest to understand the science behind their electronic structures and stabilities.1–10 In general, pure silicon and germanium nanoclusters are relatively unstable. However, encapsulation of transition metal atoms in the semiconductor cages can improve the stability of these clusters.11–19 For the appropriate composition and size when the encapsulated clusters have 2, 8, 18, 20, etc. shell closing numbers of valance electrons, the cluster attains an enhanced stability.20–22 The stability of such clusters sometimes can be explained with the existing theoretical models and sometimes cannot. It is worth mentioning here that during the hybridization of the semiconductor cages with the doped transition metal atoms, the semiconductor atom (Si or Ge) contributes one electron in the cage to make a bond with the doped atom.8,9 On the basis of this hypothesis the transition metal doped semiconductor clusters (TMSin or TMGen) can be taken as 18- or 20-electron (shell closing number) clusters depending upon the size and compositions that gain an enhanced stability. For example, in an ion trap experimental study on cationic MSin (M = Hf, Ta, W, Re, Ir, etc.) clusters followed by ab-initio calculation, Hiura et al.23 confirmed that the extra stability of the WSi12 cluster is due to the closed shell electronic (18-electron) structure, assuming each Si atom contributed one electron to bonding with W which has 6 valance electrons. Recently, Atobe et al.24 investigated the electronic properties of transition metal and lanthanide-metal doped anionic GenM (M = Sc, Ti, V, Y, Zr, Nb, Lu, Hf, and Ta) and SnnM (M = Sc, Ti, Y. Zr, and Hf) clusters by anion photoelectron spectroscopy and discussed the possibility of transition metal (TM) doped Si and Ge based superatoms, which are all 20-electron clusters. A different result on the mass spectrographic study of MSin (M = Cr, Mo and W) systems was reported by Beck25,26 where MSi15 and MSi16 are found as stable products, though they are not 18- or 20-electron clusters following the above hypothesis. In a theoretical study, Wang and Han27 found that ZnGe12 is the most stable species in the ZnGen series, which is not an 18-electron cluster. To explain the experimental results of Neukermans,28 Abreu et al.1 confirmed that the non-magnetic CrSi14 cluster is a stable one and it follows the 18-electron counting rule by introducing orbital splitting to explain the stability of this cluster. In another theoretical study Guo et al.13 explained the stability of SinM (M = Sc, Ti, V, Cr, Mn, Fe, Co, Ni, Cu, Zn; n = 8–16) nanoclusters using a shell-filling model where the d-shell of the transition metals plays an important roll in hybridization to form a closed shell structure. The enhanced stability of the transition metal doped Si and Ge clusters was also explained by considering the formation of a filled shell free-electron gas inside the cage including the geometric effects of the clusters.7 An extensive theoretical study was reported by Goicoechea and McGrady29 on the stability of TMSi12 and TMGe12 clusters on the basis of the availability of the total number of valance electrons in the ground state of deltahedral or prismatic structures. In these clusters the maximum stability is associated with both the doped TM atom and cage. When both of them share the electron density in such a way that both components attain a closed-shell configuration, the 18-electron counting rule is followed. In the present work our main focus is to explain the enhanced stability of the singlet ground state CrGe10 and CrGe14 nanoclusters and also the quenching of the magnetic moment when the clusters evolve from the Ge–Cr dimer state due to the hybridization with the cage atoms. Since the properties of these kinds of nanoclusters can be varied in a wide range by changing the doping elements, therefore these classes of clusters may be valuable for several semiconductor industries. With these fundamental interests in science and technology, we performed a detailed study on the chromium encapsulated germanium system mainly to answer some of the questions related to the stability and quenching of the magnetic moments by studying different thermodynamical and chemical parameters, analysis of the Cr-atomic orbitals in the clusters, hybridization of the Cr d-orbitals, critical points (CP’s), PDOS, TR and Raman spectra during the growth process of the cluster in the size range from n = 1 to 17.

2 Computational

Complete calculations are split into two parts mainly. All geometry optimizations were performed with no symmetry constraints. During optimization, it is always possible that a cluster with a particular guess geometry is trapped in a local minimum of the potential energy surface. To avoid this, we used a global structure predictor method using USPEX (Universal Structure Predictor: Evolutionary Xtalloraphy)30 and VASP (Vienna AB-initio simulation package)31,32 to get all the possible optimized geometric isomers in each size, from n = 8 to 17. VASP code has been used to relax the structures predicted by USPEX. For this, we have used a combination of the few-set of pseudo-potentials available in VASP. In the next stage of optimizations and post optimization calculations, the last few low energy isomers obtained from USPEX and VASP were re-optimized at different spin states in Gaussian’09 (ref. 33) to obtain different energy parameters. Here, all calculations were performed within the framework of a linear combination of the atomic orbital’s density functional theory (DFT). The generalized gradient approximation (GGA) calculations were carried out under the exchange-correlation potential as proposed by Perdew, Burke and Ernzerhof, commonly known as the PBE method34,35 available in Gaussian’09. Different basis sets were used for germanium and chromium. The full electron 6-311G standard basis set available in Gaussian’09 for Cr and LanL2DZdp with effective core potential (ECP) obtained from the EMSL basis set exchange36 for germanium are used to express the molecular-orbitals of all atoms as linear combinations of atom-centered basis functions. LanL2DZdp is a double-basis set with a LANL effective core potential (ECP) and with polarization function.37,38 Unless specified otherwise, the results presented are obtained using the Gaussian’09 program package. The Demon2k program package39 is used to calculate the critical points (CPs) inside the ground state clusters.

3 Results and discussion

3.1 Geometries and thermodynamic parameters

Variations of the different thermodynamic and chemical parameters during the growth process provide the initial evidence to identify the stable nanoclusters. We have studied the growth of the doped clusters within the size range n = 1 to 17.

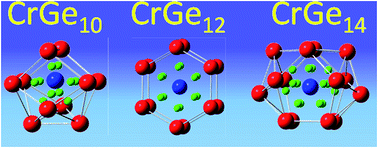
The optimized ground state structures and the corresponding spin magnetic moments along with the calculated bond critical points (BCPs) of CrGen clusters are shown in Fig. 1 (also see Fig. SI1 for other low energy isomers). More detailed geometries at different sizes are presented in the ESI. To study the thermodynamic stability, we have calculated the variation of the average binding energy (BE), embedding energy (EE), fragmentation energy (Δ), stability or the 2nd order change in energy (Δ2) and ionization potential of the clusters, detachment energies etc. We define the BE, EE, FE, stability, VIP and ADE as follows:

image file: c5ra13849c-t1.tif
where, M is the total spin of the cluster or the atom in units of ℏ. Since the all ground state CrGen clusters in the range n = 1–6 and n = 16 are magnetic, in the present study the binding energy and embedding energy of these clusters are calculated after imposing the Wigner–Witmer spin-conservation rule40 following our previously reported work.7–9 Imposing this rule the modified expressions of BE and EE are defined as follows:
image file: c5ra13849c-t2.tif


image file: c5ra13849c-f1.tif
Fig. 1 Ground state geometries and (3, −1) BCPs of CrGen (n = 6–17). Red, blue and green spheres are denoting the ‘Ge’ and ‘Cr’ atoms, and the positions of the BCPs belonging to the Cr atom, respectively.

In the above binding energy and embedding energy expressions, we have chosen the higher of the resulting two BE and EEs. In the region for n < 7, the binding energy of the neutral and cationic clusters increases rapidly. This is an indication of the thermodynamic instability of the clusters. For the clusters with size n > 7, the binding energy increases with a relatively slower rate and then reaches nearly a saturation value with small variations. Between n = 1 to 6 the ground state clusters are in different spin magnetic states. The clusters show a magic nature (stable nature) with localized peaks at n = 10 and 14 (Fig. 2a). Compared to the binding energy, the magic nature of the clusters are clearer in EE variation. Above n = 6 size, a number of local maxima arise at n = 8, 10 and 14, indicating that these clusters are more stable compared to their nearby clusters (Fig. 2a). Variation of the fragmentation energy (FE) is another important evidence to check the stability of the clusters. Following the expression, FE indicates the gain in energy by a cluster during its growth process by absorbing germanium atoms one by one, starting from a Ge–Cr dimer. With reference to the FE variation (Fig. 2b), at n = 8, 10 and 14 clusters are more stable compared to their neighboring sizes. The variation of the 2nd order change in energy or stability (Δ2) (Fig. 2b) shows a magic behavior at n = 10 and 14. On the basis of the thermodynamic parameters we found that the n = 8, 10 and 14 clusters are relatively more stable compared to the other sizes. In the present discussion we are mainly concerned about the endohedrally-doped clusters. Though the ground state isomer at n = 8 is thermodynamically stable, the Cr atom absorbed into the surface of the Ge8 cage to form a hybrid CrGe8 cluster. Since the Cr atom is exposed, the chemical affinity is higher compared to the endohedrally-doped clusters. Therefore, we are not interested in the thermodynamic stability of this cluster.


image file: c5ra13849c-f2.tif
Fig. 2 Variation of the average binding energy, embedding energy, fragmentation energy, stability, VIP, AIP, HL-Gap, VDE and ADE of the clusters during the growth process.

In order to understand how the removal or addition of one electron is changing the chemical stability of the clusters, we have calculated ionization potentials (AIP and VIP), the HOMO–LUMO gap (Fig. 2c), and the detachment energies (VDE and ADE) (Fig. 2d). Variation of the AIP and VIP nature are similar, with a small difference between these values in a particular size. There are sharp peaks at n = 10 and 14 in the variation of the ionization potential with a maximum value at n = 14 indicating that CrGe14 is the most stable cluster among all. Variation of the HOMO–LUMO gap with the growth of the cluster is one of the important pieces of evidence to understand the closed shell nature of the clusters. With reference to Fig. 2c, both CrGe10 and CrGe14 have an almost equal HOMO–LUMO gap of close to 1.29 eV. There is a clear dip in the HOMO–LUMO gap variation at n = 12 and 16 with values of 0.78 eV and 0.57 eV respectively among the endohedrally doped clusters. The cause of the enhanced stability of the n = 10 and 14 clusters will be discussed in the next section on the basis of molecular orbital analysis. We have calculated the vertical detachment energy (VDE) and adiabatic detachment energy (ADE) following the equations mentioned in the previous section. Here, VDEs are the energy differences between the anionic and neutral cluster at a particular size, keeping the geometry of the cluster unchanged. Whereas ADE defines the energy difference between the anionic ground state and neutral ground state in a particular size of a cluster. In the later case, the geometry of these two clusters may be different. The variation of VDE and ADE with the cluster size shown in Fig. 2d supports the results obtained from the AIP, VIP and HOMO–LUMO gap variations of the clusters. The clear local minima at n = 10 and 14 indicate that it is easy to remove electrons from the anionic state in these clusters and hence gives an indication of the enhanced stability of these clusters. With reference to our calculation of thermodynamic and chemical parameters, we found that CrGe10 and CrGe14 clusters are relatively stable compared to the other clusters in the series.

From our previous discussion, it is clear that the n = 10 and 14 clusters can be taken as the stable clusters. We need to make it clear why these clusters are stable but not n = 12. Here we apply molecular and atomic orbital analysis to explain it. First we will discuss the cause of the lower stability of the CrGe12 ground state cluster. The CrGe12 ground state cluster is a well-known hexagonal prism with D6h symmetry with an endohedrally doped Cr atom between the two hexagonal rings of Ge atoms with 54 valance electrons (6 from Cr: 3d5 4s1 and 4 from each Ge: 3s2 3p2) in singlet spin states. With reference to Fig. 3, the orbital energy levels are assigned based on orbital composition. There are in total 27 filled energy levels with paired electrons, indicating quenching of the Cr spin moment (see Fig. SI2 for detailed orbital pictures). The electronic distributions can be written in the following sequence: 1S2, 1P6, 1D8, 1F8, 2S2, 1D2, 1 G2, 1F4, 1G2, 2P4, 2D8, 2P2, 2D4 (HOMO) and 2D2 (LUMO). Here we assign the orbitals following a method adopted by Abreu et al.1 and we also found that the jellium model41 is incompatible to explain the electronic structure of this cluster because of the presence of the 12 electrons in the 2D orbital. One of the 2D orbitals (2Dz2) appears in the LUMO. This could be due to the crystal-field like splitting42 in the molecular orbital in the cluster. To understand whether the 18-electron rule can be applied or not, we have analyzed one-electron orbitals of Cr in the CrGe12 cluster. With reference to the recent report by Goicoechea and McGrady,29 since Cr is in the 6th column in the periodic table, one of its 3d level will be pushed up to the higher side of the energy level in CrGe12. To find out the contribution from Cr in the MOs we have used a fragment analysis where clusters are divided into Cr and Ge12 fragments.35,43 Using this analysis we found a reasonable amount of contribution from the Cr-3dz2 atomic orbital in the LUMO which is being pushed up from the lower level. This also could be the reason for the good amount of HOMO–LUMO gap of 0.82 eV in this cluster. The result of the one-electron orbitals is shown in Fig. 3. Since the LUMO contains the 3dz2 orbital contribution of Cr, which is unfilled, therefore the total number of electrons that occupied these orbitals is 16 (Fig. 3). Since one 3d orbital (LUMO: 3dz2) is unfilled, the 18-electron rule cannot be applied here. This could be the possible reason why CrGe12 does not show a stable nature in the thermodynamic and other parameter variation (Fig. 2). In this context, we can recall our discussion in an earlier section of this work where we discussed the results of Hiura et al.;23 the WSi12 cluster can be taken also as a 16-electron cluster. Compared to CrGe12, both CrGe10 and CrGe14 have higher values of BEs, EEs, FEs, Δ2s, IPs and HOMO–LUMO gaps. Applying the same method to CrGe10 and CrGe14 clusters, we found that both of them follow the 18-electron rule. In the case of CrGe10, the assigned molecular orbitals may not follow a particular structure, but a signature of contribution from Cr in these orbitals is clearly seen. The signature supports the Cr contribution results in our calculations. On the basis of that, we have assigned that the Cr-atomic orbitals are filled with a configuration of 4s2, 4p6 and 3d10 (Fig. 4). Hence all atomic orbitals of Cr are engaged. In this case the Cr metal atom and the cage shared the electron density in such a way that both of them fulfill 18-electron counting. The same is true in the electronic structure of CrGe14. In fact, Cr-contributions are clearer in the CrGe14 cluster due to the hybridization between the Cr-d orbital and the caged Ge-4p orbital, producing two Cr-3dxz, one Cr-3dyz and one Cr-3dyz + 4pz mixed orbitals (Fig. 5). In CrGe14 the LUMO is assigned as 3dxy. Therefore, CrGe10 and CrGe14 follow the 18-electron counting rule, but it cannot be applied in CrGe12 as per our results.


image file: c5ra13849c-f3.tif
Fig. 3 Molecular orbitals (MO’s) of CrGe10 (with the Cr contribution).

image file: c5ra13849c-f4.tif
Fig. 4 Molecular orbitals (MO’s) of CrGe12 (with the Cr contribution).

image file: c5ra13849c-f5.tif
Fig. 5 Molecular Orbitals (MO’s) of CrGe14 with the Cr contribution.

To investigate the strength of the Ge–Ge and Ge–Cr interaction with the increasing size of the clusters, and also to understand the bonding nature, we have calculated the number of different bonds present in the clusters. We have calculated the bond critical points (BCPs) and cage critical points (CCPs) (see Fig. SI3 for RCPs and CCPs) and their locations in the cage to interpret the nature of bonding present in the cage based on the work reported by Bader.44 The chemical interaction between the fragments of a given set of molecules can be characterized by the Laplacian of electronic densities. When the density is positive it describes closed shell bonding, and when it is negative, it is covalent bonding. The critical point is one where this electron density vanishes in 3-D. Therefore this is a position on the bond and is reflecting the existence of the presence of a bond. A particular CP is characterized by (R, S) where R is the rank of the Hessian matrix of the electron density reflecting the number of Eigen values of the matrix and S is the sign of the sum of the Eigen values (either maxima or minima or saddle) indicating the topological feature. A bond critical point (BCP) in general represented by the (3, −1) CP reflects the saddle point between two molecules or clusters forming bonds between them. With this background, we have calculated the BCPs and this is shown in Fig. 1. First we have calculated the location of the (3, −1) CPs. It is clearly seen that in all endohedrally doped clusters, a number of (3, −1) CPs inside the cages are almost uniformly distributed surrounding the encapsulated Cr atom and the number varies from cluster to cluster. The ten (3, −1) CPs are indicating the existence of ten bonds between the Cr and germanium atoms in CrGe10. The number of Ge–Ge bonds for the clusters in the size range n = 6–12 varies between 16–18, and then it starts increasing with a maximum value of 39 at n = 16. Among several isomers (ten) in CrGe16, the ground state structure is a well known Frank–Kasper polyhedron,12 which is stable in general. For the cluster with n = 6 to 15, Cr is attached with all Ge atoms in the cage and hence the number of bond critical points (BCPs) is the same as the number of Ge atoms in the cage. Whereas, due to the larger size of the Ge16 and Ge17 cages, the Cr atom won’t be able to form bonds with a number of the Ge atoms in the cage and hence the number of BCPs drops. This could be taken as the structural phase change from the bonding point of view. Following the variation of the BCPs with the cluster size (Fig. 6), it increases linearly from n = 8 to 14. The maximum value of the BCP (3, −1) at n = 14 is an indication of a strong structural stability with C2V symmetry. Though there is no local maxima in the BCPs variation at n = 10, there is a clear increasing trend. The maximum value of the Ge–Ge bond at n = 16 is the indication of the stable nature of the pure Ge16 cage. There is also a local peak at n = 10 in the number of the Ge–Ge bond variation. Therefore, variation of the BCPs and also the number of Ge–Ge bonds in the germanium cages help to understand the stability of the clusters from the structural point of view.45


image file: c5ra13849c-f6.tif
Fig. 6 Bond critical points (BCPs) and no. of Ge–Ge bonds.

With reference to the IR and Raman frequencies (Fig. 7) of the clusters from n = 6 to 17, at n = 10, 14 and 16, the number of dominating frequencies is much lower than that of the other structures. A lower number of modes in IR is basically the indication of the vibration of the bonds (stretching) present in the structure at an almost constant frequency or within a very small frequency range. This is because of the strong structural symmetry for n = 10, 14 and 16. Raman frequency in general indicates the bending mode in the clusters. The narrow peak at n = 10, 11 and 16 in the Raman spectrum indicates the lower number of bending modes present in these clusters with a breathing mode (where all the molecules in the cage vibrate in phase), with a maximum intensity at 210, 201 and 170 cm−1 respectively.


image file: c5ra13849c-f7.tif
Fig. 7 Variation of IR and Raman spectrum. The intensity is plotted in an arbitrary unit.

To understand the strength of the Ge and Cr-d orbital contributions in hybridization and the cause of the magnetic moment quenching of Cr in the clusters, we have studied PDOS (Fig. 8 and ESI), and the percentage of the Cr d-alpha and beta orbital contribution in hybridization, shown in Fig. 9. Since n = 1–6 are in quintet or in triplet spin states, their PDOS is asymmetrical (Fig. 8a and Fig. SI4). For other clusters, in singlet spin states, both the alpha and beta contributions in PDOS are identical. In all the stable clusters, there is no contribution of DOS on the Fermi level and the HOMO–LUMO orbitals are also clearly separated. The percentage contribution of the Cr d-orbital in hybridization also supports the DOS nature. For n = 6, the percentage contributions in hybridization of the Cr-d alpha and beta are not the same. Therefore, it is clear that the existence of the magnetic moment is due to the unequal alpha and beta Cr -d orbital contribution in the hybridization. With the increase of the size of the clusters from n = 1 by adding Ge atoms one by one, the chances of hybridization between the Cr and the Ge atoms increases. Due to this hybridization the Cr d-orbital, which is responsible for the magnetic moment of Cr, decreases and hence the magnetic moment of Cr quenches. So the existence of the magnetic moment or the quenching of the magnetic moment of CrGen is due to the hybridization between the Ge p- and Cr d-orbital contribution. In the case of n = 16, the number of Ge–Ge bonds are at the maximum in the whole series of study (Fig. 6). This is the indication of the stable nature of the Ge16 germanium cage.


image file: c5ra13849c-f8.tif
Fig. 8 (Left) Variation of DOS and PDOS of different neutral clusters of CrGen (n = 6–11) with shifted energy (EEF) and Fermi energy set to ‘0’. (Right) Variation of DOS and PDOS of different neutral clusters CrGen (n = 12–17) with shifted energy (EEF) and Fermi energy set to ‘0’.

image file: c5ra13849c-f9.tif
Fig. 9 Percentage of alpha and beta Cr d-orbital contributions in hybridization with the Gen (n = 6–17) cages.

In the clusters, the magnetic moment or the quenching of the magnetic moment is due to the hybridization between the Ge p- and Cr d-orbital contribution. In all the stable clusters, there is no contribution of DOS on the Fermi level and the HOMO–LUMO orbitals are also clearly separated.

4 Conclusions

The variation of the different energy parameters BE, EE, FE, stability, HOMO–LUMO gap, VIP, AIP, ADE and VDE of the clusters supports the enhanced stability at n = 10 and 14. The above results point to a more unified picture for the stability of CrGen clusters. We have verified the electron-counting rule on the basis of the Cr atomic filled shell in molecular orbitals. Analysis of the Cr atomic shell contributions in molecular orbitals explained the stable nature of the CrGe10 and CrGe14 clusters. However, CrGe12 is less stable due to the 16 electrons in the Cr shell, with an electronic configuration of 4s2, 4p6, 3d8. In the CrGe12 cluster, due to the crystal field like splitting, Cr-3dz2 pushed up to the LUMO. However, CrGe10 and CrGe14 both have a Cr atom with the electronic configuration of 4s2, 4p6, 3d10, which is a close filled configuration and follow the 18 electron counting rule. The analysis of the bond critical points indicates that the more stable species have a higher number of BCPs, which leads to an increase in the germanium binding energy. The other significant effect, however, is the mixing between the Cr 3d- and Ge p-states, which was reflected in the PDOS and quenching of the Cr magnetic moments in the clusters. The bonding nature and the vibrational modes present in the clusters can be further understood by the study of the IR and Raman frequencies as discussed. A lower number of modes in the IR and Raman spectra is basically indicating the higher symmetry in the clusters.

Acknowledgements

A part of the calculation was done at the cluster computing facility, Harish-Chandra Research Institute, Allahabad, UP, India (http://www.hri.res.in/cluster/).

References

  1. M. B. Abreu, A. C. Reber and S. N. Khanna, J. Phys. Chem. Lett., 2014, 5, 3492–3496 CrossRef CAS PubMed.
  2. S. N. Khanna, B. Rao and P. Jena, Phys. Rev. Lett., 2002, 89, 016803 CrossRef CAS PubMed.
  3. R. Robles and S. N. Khanna, J. Chem. Phys., 2009, 130, 164313 CrossRef CAS PubMed.
  4. R. Robles, S. N. Khanna Jr and A. Castleman, Phys. Rev. B: Condens. Matter Mater. Phys., 2008, 77, 235441 CrossRef.
  5. R. Robles and S. N. Khanna, Phys. Rev. B: Condens. Matter Mater. Phys., 2005, 72, 165413 CrossRef.
  6. R. Robles and S. N. Khanna, Phys. Rev. B: Condens. Matter Mater. Phys., 2006, 74, 035435 CrossRef.
  7. D. Bandyopadhyay, P. Kaur and P. Sen, J. Phys. Chem. A, 2010, 114, 12986–12991 CrossRef CAS PubMed.
  8. R. Trivedi, K. Dhaka and D. Bandyopadhyay, RSC Adv., 2014, 4, 64825–64834 RSC.
  9. D. Bandyopadhyay and P. Sen, J. Phys. Chem. A, 2010, 114, 1835–1842 CrossRef CAS PubMed.
  10. K. Dhaka, R. Trivedi and D. Bandyopadhyay, AIP Conference Series, 2013, pp. 1498–1500 Search PubMed.
  11. D. Bandyopadhyay, J. Appl. Phys., 2008, 104, 084308 CrossRef.
  12. V. Kumar and Y. Kawazoe, Phys. Rev. B: Condens. Matter Mater. Phys., 2002, 65, 073404 CrossRef.
  13. L.-j. Guo, G.-f. Zhao, Y.-z. Gu, X. Liu and Z. Zeng, Phys. Rev. B: Condens. Matter Mater. Phys., 2008, 77, 195417 CrossRef.
  14. Q. Sun, Q. Wang, T. Briere, V. Kumar, Y. Kawazoe and P. Jena, Phys. Rev. B: Condens. Matter Mater. Phys., 2002, 65, 235417 CrossRef.
  15. V. Kumar and Y. Kawazoe, Phys. Rev. Lett., 2002, 88, 235504 CrossRef PubMed.
  16. H. Kawamura, V. Kumar and Y. Kawazoe, Phys. Rev. B: Condens. Matter Mater. Phys., 2004, 70, 245433 CrossRef.
  17. H. Kawamura, V. Kumar and Y. Kawazoe, Phys. Rev. B: Condens. Matter Mater. Phys., 2005, 71, 075423 CrossRef.
  18. K. Dhaka, R. Trivedi and D. Bandyopadhyay, J. Mol. Model., 2013, 19, 1473–1488 CrossRef CAS PubMed.
  19. D. Bandyopadhyay, J. Mol. Model., 2012, 18, 3887–3902 CrossRef CAS PubMed.
  20. J. U. Reveles, P. A. Clayborne, A. C. Reber, S. N. Khanna, K. Pradhan, P. Sen and M. R. Pederson, Nat. Chem., 2009, 1, 310–315 CrossRef CAS PubMed.
  21. W. A. de Heer, Rev. Mod. Phys., 1993, 65, 611 CrossRef CAS.
  22. M. Zhang, J. Zhang, X. Feng, H. Zhang, L. Zhao, Y. Luo and W. J. Cao, J. Phys. Chem. A, 2013, 117, 13025–13036 CrossRef CAS PubMed.
  23. H. Hiura, T. Miyazaki and T. Kanayama, Phys. Rev. Lett., 2001, 86, 1733 CrossRef CAS PubMed.
  24. J. Atobe, K. Koyasu, S. Furuse and A. Nakajima, Phys. Chem. Chem. Phys., 2012, 14, 9403–9410 RSC.
  25. S. M. Beck, J. Chem. Phys., 1987, 87, 4233–4234 CrossRef CAS.
  26. S. M. Beck, J. Chem. Phys., 1989, 90, 6306–6312 CrossRef CAS.
  27. J. Wang and J.-G. Han, Chem. Phys., 2007, 342, 253–259 CrossRef CAS.
  28. S. Neukermans and X. Wang, Int. J. Mass Spectrom., 2006, 252, 145–150 CrossRef CAS.
  29. J. M. Goicoechea and J. E. McGrady, Dalton Trans., 2015, 44, 6155 RSC.
  30. A. R. Oganov and C. W. Glass, J. Chem. Phys., 2006, 124, 244704 CrossRef PubMed.
  31. G. Kresse and J. Furthmüller, Phys. Rev. B: Condens. Matter Mater. Phys., 1996, 54, 11169 CrossRef CAS.
  32. G. Kresse and D. Joubert, Phys. Rev. B: Condens. Matter Mater. Phys., 1999, 59, 1758 CrossRef CAS.
  33. A. Frisch, Gaussian 09: User’s Reference; Gaussian, 2009 Search PubMed.
  34. J. P. Perdew, K. Burke and M. Ernzerhof, Phys. Rev. Lett., 1996, 77, 3865 CrossRef CAS PubMed.
  35. J. P. Perdew, K. Burke and M. Ernzerhof, Phys. Rev. Lett., 1997, 78, 1396 CrossRef CAS.
  36. K. L. Schuchardt, B. T. Didier, T. Elsethagen, L. Sun, V. Gurumoorthi, J. Chase, J. Li and T. L. Windus, J. Chem. Inf. Model., 2007, 47, 1045–1052 CrossRef CAS PubMed.
  37. P. J. Hay and W. R. Wadt, J. Chem. Phys., 1985, 82, 270–283 CrossRef CAS.
  38. W. R. Wadt and P. J. Hay, J. Chem. Phys., 1985, 82, 284–298 CrossRef CAS.
  39. A. M. Koster, et al., deMon2k, V. 2.3.6, The deMon Developers Community, Cinvestav, Mexico, 2006 Search PubMed.
  40. E. Wigner and E. Witmer, Z. Phys., 1928, 51, 859–886 CrossRef CAS.
  41. W. Ekardt, Phys. Rev. B: Condens. Matter Mater. Phys., 1984, 29, 1558–1564 CrossRef CAS.
  42. P. J. Roach, W. H. Woodward, A. C. Reber, S. N. Khanna and A. W. Castleman, Phys. Rev. B: Condens. Matter Mater. Phys., 2010, 81, 195404 CrossRef.
  43. W. H. Woodward, A. C. Reber, J. C. Smith, S. N. Khanna and A. W. Castleman, J. Phys. Chem. C, 2013, 117, 7445–7450 CrossRef CAS.
  44. R. F. W. Bader, Atoms in Molecules: A Quantum theory, Clarendon Press, Oxford, 1990 Search PubMed.
  45. V. Chauhan, M. B. Abreu, A. C. Reber and S. N. Khanna, Phys. Chem. Chem. Phys., 2015, 17, 15718–15724 RSC.

Footnote

Electronic supplementary information (ESI) available: Optimized isomers, PDOS of the clusters with the size n = 1–5, MOs of n = 10, 12 and 14, CCPs and RCPs. See DOI: 10.1039/c5ra13849c

This journal is © The Royal Society of Chemistry 2015
Click here to see how this site uses Cookies. View our privacy policy here.