DOI:
10.1039/C5RA13555A
(Paper)
RSC Adv., 2015,
5, 67630-67637
A novel Cu–Mn/Ca–Zr catalyst for the synthesis of methyl formate from syngas
Received
10th July 2015
, Accepted 28th July 2015
First published on 28th July 2015
Abstract
A novel catalyst comprised of Cu–Mn mixed oxides and CaO–ZrO2 solid base has contributed to a high-performance methyl formate (MF) synthesis from syngas in a slurry reactor. Cu–Mn mixed oxides and mesoporous CaO–ZrO2 solid base were prepared by complexing method and alcohothermal route, respectively, and they were characterized by N2 isotherm adsorption–desorption, XRD, SEM, TEM, XPS and CO2-TPD techniques. Under the optimum reaction conditions of 160 °C, 3 MPa, 3![[thin space (1/6-em)]](https://www.rsc.org/images/entities/char_2009.gif) :7 for the ratio of methanol to N,N-dimethylformamide, 40 g L−1 Cu–Mn sample, and 30 g L−1 CaO–ZrO2 sample, a low CO conversion of 22.4% was obtained over Cu–Mn/Ca–Zr, whereas the MF selectivity of 82.3% was higher than that of the traditional catalyst (e.g. Cu-catalyst and NaOCH3), which was due to the synergism between Cu–Mn and CaO–ZrO2 samples.
:7 for the ratio of methanol to N,N-dimethylformamide, 40 g L−1 Cu–Mn sample, and 30 g L−1 CaO–ZrO2 sample, a low CO conversion of 22.4% was obtained over Cu–Mn/Ca–Zr, whereas the MF selectivity of 82.3% was higher than that of the traditional catalyst (e.g. Cu-catalyst and NaOCH3), which was due to the synergism between Cu–Mn and CaO–ZrO2 samples.
1. Introduction
Methyl formate (MF) is one of the most important chemical intermediates, which can be used to synthesize a large number of chemicals such as formic acid, acetic acid, ethylene glycol, methyl propionate and methyl glycolate.1–5 Besides, MF is considered to be a promising substitute for methyl tertiary butyl ether (MTBE) and ecological fuel for vehicles.6,7 In agriculture, MF is regarded as a pesticide, bactericide and fruit desiccant. Thus, the catalytic synthesis of MF has attracted much attention from researchers.
There are many effective processes developed for MF synthesis so far. The commercial method to synthesize MF is the carbonylation of methanol over alkali methoxide catalysts at 80 °C in liquid phase.8–10 However, the catalyst deactivation caused by CO2 and H2O in system exists in above process. Recently, the selective oxidation of methanol to MF on noble metal catalysts such as Au, Ru, Ag and Pd has been the research hotspot due to its high conversion and selectivity.11–15 Wojcieszak et al.16 studied the oxidation of methanol to MF over Pd nanoparticles supported on γ-Fe2O3 at 80 °C with 76% methanol conversion and 81% MF selectivity. Wang et al.17 reported methanol selective oxidation to MF, with a methanol conversion of 90.2% and MF selectivity of 100%, at 70 °C on graphene-supported Au–Pd nanoparticles, owing to the synergism of Au and Pd particles as well as the strong interaction between graphene and Au–Pd nanoparticles. The major disadvantage of this process is the cost of catalyst due to the presence of noble metal. Besides, the photocatalytic reduction of CO2 to MF in methanol also aroused the interests of researchers.18,19 Chen et al.20,21 employed the photocatalytic reduction of CO2 to MF on B2S3 and Ni-doped ZnS catalyst with the MF production rate of 175 μmol g−1 h−1 and 121 μmol g−1 h−1, respectively, while the low yield and poor stability limit the application of this process. This has stimulated a desire for the development of an alternative process.
Direct synthesis of MF from syngas in liquid-phase system is significantly concerned by researchers due to its atomic economy and short reaction process.22–26 The direct process follows the stoichiometry:27
| | |
2CO + 2H2 → HCOOCH3, ΔHR0 = −157.2 kJ mol−1.
| (1) |
In the direct synthesis process, MF forms as an intermediate of methanol synthesis from syngas on mixed catalyst comprised of alkali or alkali earth compounds and Cu-based catalysts,22 which contains homogeneous carbonylation of methanol on alkali or alkali earth compounds and heterogeneous hydrogenation of MF on Cu-based catalysts. Palekar et al.23 controlled the selectivity of methanol and MF by changing reaction temperature and the ratio of CO to H2. They found that high reaction temperature and low CO/H2 were beneficial to methanol; on the contrary, low reaction temperature and high CO/H2 condition favored MF formation, and the similar results were also reported by Chen et al.28 However, a critical problem in this process is that homogeneous alkali or alkali earth compounds are susceptible to CO2 or H2O in reaction system, which accelerates the fall of the catalytic activity.29–31 Moreover, alkali or alkali earth compounds distributed on the surface of Cu-based catalyst cause the blockage of active sites.32
In this work, CaO–ZrO2 solid base and Cu–Mn mixed oxides were prepared and characterized by N2 isotherm adsorption–desorption, XRD, TEM, SEM, XPS and CO2-TPD measurements. More importantly, the combined Cu–Mn/Ca–Zr catalyst prepared by mechanical mixing above two as-prepared samples was applied to the direct synthesis of MF from syngas in a batch slurry reactor for the first time. In addition, the influences of reaction parameters such as temperature, pressure, the ratio of methanol to DMF, the concentration of CaO–ZrO2 and Cu–Mn samples on catalytic performance were thoroughly investigated.
2. Experimental
2.1 Preparation of catalysts
2.1.1 Preparation of Cu–Mn mixed oxides. The preparation of Cu–Mn mixed oxides is described as follows: 1 M Mn(NO3)2 aqueous solution with pH = 3–4 was dropped into 1 M copper ammonia solution of pH = 9–10 with vigorous stirring at 35 °C at a dropping rate of 1 mL min−1. After aging for 5 h, the precipitate was washed with deionized water for several times, then filtered, dried, and calcined at 550 °C for 4 h. The normal molar ratio of Cu to Mn was 1.0.
2.1.2 Preparation of CaO–ZrO2 solid base. CaO–ZrO2 solid base was prepared by sol–gel method as the reported procedure previously.33 Typically, 1 g of amphiphilic poly block copolymers (PEO20PPO70PEO20, Pluronic P123, Aldrich) and 1.5 g Ca(NO3)2·4H2O were dissolved in 24.2 mL absolute ethanol, which noted as solution A. Meanwhile, 4 g of zirconium n-propoxide (70 wt% in n-propanol, Alfa Aesar) and 0.43 g acetylacetone were dissolved in 16.1 mL absolute ethanol to produce solution B. Then solution B and 1.6 mL H2O were dropped slowly into solution A sequentially. The resulting solution was stirred for 2 h before it was aged at 60 °C for 24 h. After aging, the acquired white gel was refluxed in 0.5 M NaOH solution for 24 h. Subsequently, the product was washed by deionized water to remove residual Na+ and filtered. The white hybrid was then dried at 100 °C overnight and calcined at 600 °C for 6 h to produce solid base, and the normal mole ratio of Ca to Zr is 0.5.
2.1.3 Preparation of Cu–Mn/Ca–Zr catalyst. Cu–Mn/CaO–ZrO2 combined catalyst, noted as Cu–Mn/Ca–Zr, was prepared by mechanical mixing Cu–Mn mixed oxides and CaO–ZrO2 solid base. The mass ratio of Cu–Mn to CaO–ZrO2 is determined by the concentration of two samples in slurry phase. The concentration of Cu–Mn catalyst is 0–65 g L−1, and that of CaO–ZrO2 catalyst is 0–50 g L−1.
2.2 Catalyst characterization
The specific surface area of the sample was measured with ASAP 2020 analyzer using the multipoint Brunauer–Emmett–Teller (BET) adsorption. X-ray diffraction (XRD) characterization including small-angle (SXRD) was conducted using a Bruker diffractometer employing Cu Kα radiation (40 kV and 40 mA). Scanning electron microscopy (SEM) images were taken with a JSM-7001F electron microscope operating at 10 or 5 kV. Transmission electron microscopy (TEM) images were recorded using a JEM-2100F microscope operated at 200 kV. X-ray photoelectron spectroscopy (XPS) experiments were carried out with an AXIS ULTRA DLD X photoelectron spectrometry employing an Al-Kα X-ray source. The binding energy of the samples was corrected with the energy of C1s (284.6 eV) as the reference. Temperature-programmed desorption of CO2 (CO2-TPD), 0.2 g samples were pretreated in a flow of He (99.99%) at a rate of 10 °C min−1 from room temperature to 700 °C and kept for 2 h. Prior to adsorption of CO2 (99.999%) at 30 °C, blank experiment was carried out from 30 °C to 700 °C to confirm no CO2 desorption occurred. When the temperature elevated, the CO2 desorbed was detected by TCD.
2.3 Catalyst performance testing
A batch stainless steel autoclave reactor with an inner volume of 100 mL was employed. The designed amount of Cu–Mn/Ca–Zr catalyst and solvent including methanol (99.95%) and N,N dimethyl formamide (99.5%, DMF) were poured into the reactor. After replacing the air in reactor with N2 for 2–3 times, feed gas was permitted into the reaction system at room temperature until the pressure of the system increased to the required level. Then the temperature was increased in 30 min. The stirring speed was 1000 rpm to resist mass transfer effect. The gas phase was analyzed using Carbosieve-packed column equipped with thermal conductivity detector (TCD) and Porapack-Q column equipped with flame ionization detector (FID), and liquid samples were analyzed on Porapack-T column equipped with thermal conductivity detector (TCD). The composition of the feed gas is H2/CO/N2 = 64/32/4, where nitrogen was employed as an internal standard.
3. Results and discussion
3.1 Catalyst characterization
3.1.1 Physicochemical properties. Fig. 1 shows the N2 isotherm adsorption–desorption and pore size distribution (inserted) profiles of CaO–ZrO2. As can be seen, the CaO–ZrO2 solid base shows the type IV isotherm and H2 hysteresis loop. The presence of type IV isotherm plot indicates the mesoporous structure of CaO–ZrO2, and H2 hysteresis loop is the characteristic of “ink-bottle” or “network” type of pores formed from the voids between nano-particles in this sample.34 Meanwhile, the CaO–ZrO2 sample exhibits an narrow pore size distribution ranging from 1.8 nm to 10 nm with a center at 3.7 nm in the inserted of Fig. 1, suggesting a rather uniform pore structure of CaO–ZrO2. The SXRD plot of CaO–ZrO2 shows a broad peak with maximum at 1.28° (Fig. 2), which indicates the uniform pore structure of CaO–ZrO2 in line with the result of Fig. 1. Besides, the CaO–ZrO2 possesses a specific surface area of 53 cm2 g−1 determined by BET surface area. However, the Cu–Mn catalyst with a very small specific surface area of 14 cm2 g−1 is obtained.
 |
| | Fig. 1 N2 isotherm adsorption–desorption and pore size distribution (inserted) profiles of CaO–ZrO2. | |
 |
| | Fig. 2 SXRD plot of CaO–ZrO2 catalyst. | |
3.1.2 XRD measurements. The crystalline phases of CaO–ZrO2 and Cu–Mn oxide samples are investigated by XRD analysis (Fig. 3). For the CaO–ZrO2 solid base, only tetragonal ZrO2 (PDF 88-1007) diffraction peaks at 30.3°, 35.2°, 50.6° and 60.3° are detected, while no peaks belonging to CaO are found, which indicates that CaO is highly dispersed in solid base with amorphous structure, or Ca2+ incorporates into ZrO2 lattice and homogeneous CaO–ZrO2 solid solution is formed.35,36 The diffraction peaks of CaO–ZrO2 are broad and weak, which implies that the CaO–ZrO2 solid base possesses very small crystalline size or low crystallinity. For the Cu–Mn mixed oxides, CuO (Tenorite, PDF 72-0629) and incomplete spinel Cu1.5Mn1.5O4 (PDF 70-0262) with monoclinic and cubic structures are observed, and no diffraction peaks corresponding to Mn oxides are detected, which is due to partial Mn species existing in amorphous or being in highly dispersed.
 |
| | Fig. 3 XRD patterns of CaO–ZrO2 (a) and Cu–Mn (b) catalysts. | |
3.1.3 SEM and TEM. The morphology information of Cu–Mn and CaO–ZrO2 catalysts is characterized by SEM in Fig. 4a and b. The Cu–Mn is mainly comprised of uniform particles with the size of 50–100 nm, which aggregate together in random (Fig. 4a). For the CaO–ZrO2 catalyst, both large lumps (≈10 μm) with flat surfaces and smaller particles on top are observed, which might be formed from the clusters of primary particles (see Fig. 4d).
 |
| | Fig. 4 SEM (a and b) and TEM (c–f) images of the Cu–Mn (a, c and e) and CaO–ZrO2 (b, d and f) catalysts. | |
TEM was used to investigate the particle size and textural structure of Cu–Mn and CaO–ZrO2 samples (Fig. 4c–f). As shown in Fig. 4c, the Cu–Mn exhibits loose agglomerates with the particle size about 20–100 nm. The lattice spacings of 0.27 nm and 0.21 nm could be assigned to the (110) planes of CuO and (400) planes of Cu1.5Mn1.5O4 as given in Fig. 4e, which indicates the coexistence of CuO and Cu1.5Mn1.5O4 phases in Cu–Mn mixed oxides, in line with the result of XRD (Fig. 3b). The CaO–ZrO2 is highly porous in nature and consists of the narrowly distributed nanoparticles with the size less than 10 nm (Fig. 4d). It can be seen in Fig. 4f that nano-crystals and amorphous nano-particles are coexistence in CaO–ZrO2 sample, indicating that CaO–ZrO2 is semi-crystalline structure, in accordance with the weak and broad diffraction peak in XRD pattern (Fig. 3a).
3.1.4 XPS measurements. The oxidation states of Cu and Mn component in Cu–Mn catalyst are determined via XPS surface analysis (Fig. 5). Five peaks are distinguished by deconvoluting Mn 2p peak (Fig. 5a). The peak at 641.1 eV and 652.9 eV are attributed to Mn2+ and the peak at 642.7 eV and 654.4 eV are assigned to Mn3+ or Mn4+ cations.37,38 Moreover, a satellite peak at 648.2 eV could be detected, which suggests the presence of Mn2+.39–41 However, there are no Mn2+ oxide peaks in XRD patterns (Fig. 3), indicating that the Mn2+ oxides coexist in amorphous structure with Cu1.5Mn1.5O4 and CuO in Cu–Mn sample.
 |
| | Fig. 5 Mn 2p (a) and Cu 2p (b) XPS of the Cu–Mn catalyst. | |
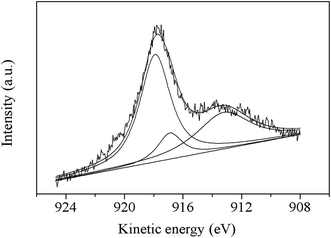
From the Cu 2p XPS plot of Cu–Mn catalyst (Fig. 5b), it can be seen that Cu 2p3/2 main peaks locate at 933.7 eV and 934.9 eV which are assigned to Cu2+ species. The shake-up satellite peaks at 941.4 eV and 943.8 eV corresponding to Cu 2p3/2 also confirm the presence of Cu2+, and these peaks do not appear in Cu+ or Cu0 species, since shake-up transitions do not occur in filled 3d shells and metallic states.41,42 The Cu 2p XPS profile also shows a peak at the binding energy of 930.9 eV, which could be attributed to cuprous or metallic copper.40,42 Unfortunately, Cu0 cannot be clearly distinguished from Cu+ by the XPS profile of Cu 2p due to their similar position of binding energy. It is reported that the following redox equilibrium is established in Cu1.5Mn1.5O4,40–43 Cu2+ + Mn3+ = Cu+ + Mn4+. Therefore, it can be assumed that the peak at 930.9 eV is characteristic of Cu+ cation. Auger electron spectroscopy is taken to further distinguish the chemical state between Cu+ and Cu0 (Fig. 6). According to the literatures,40,44,45 the peak of Auger spectra with kinetic energy of 918.5 eV is assigned to Cu0, the peak at 917.6 eV, which is attributed to Cu2+, for the peak at 916.5 eV, which is related to Cu+. In this case, the corresponding kinetic energy spectra of Auger electron includes two peaks at 917.8 eV and 916.8 eV (Fig. 6), which could be assigned to Cu2+ and Cu+. Besides, a low kinetic energy broad peak at 913.1 eV can be observed, which belongs to Cu2+ or Cu+ according to the literature,46 indicating the absence of Cu0. In addition, there is no possibility to form Cu0 during the preparation process of Cu–Mn oxide, for the samples were calcined at 550 °C in air, in line with the results of Mn 2p XPS and XRD.
 |
| | Fig. 6 XPS of Cu L3MM Auger electron of Cu–Mn catalyst. | |
3.1.5 CO2-TPD. The CO2 desorption temperature can be used to evaluate the base strength, and the basicity of each type of basic site is determined by the desorption amount of CO2. As shown in Fig. 7, the basic property of CaO–ZrO2 is characterized by CO2-TPD. The CO2 desorption profile can be roughly divided into three broad peaks: low temperature peak below 235 °C, medium temperature peak from 240 °C to 515 °C and high temperature peak around 603 °C, which are named α, β and γ, respectively. The α peak centered at 163 °C with about 62 μmol g−1 CO2 uptake could be assigned to the CO2 desorption on the weak basic site of ZrO2 surface. The β peak centered at 362 °C with about 219 μmol g−1 CO2 uptake is related to the moderately strong basic site from the surface of a solid solution, in which the presence of neighboring Ca2+ and Zr4+ affect the basicity of lattice oxygen on the surface,47 and the γ peak at 603 °C with 42 μmol g−1 CO2 uptake is attributed to the strong basic site on the surface of CaO in CaO–ZrO2.33 It could be concluded from the results above that there are three basic sites with different basic strength on the CaO–ZrO2 solid base surface, and the basicity of three basic sites follows β > α > γ.
 |
| | Fig. 7 CO2-TPD plot of CaO–ZrO2 catalyst. | |
3.2 Influence of reaction variables on MF synthesis
Slurry phase is a complex reaction system, and many factors can influence the catalytic activity and the selectivity of products. In the present work, reaction variables such as temperature, pressure, the ratio of methanol to DMF and the concentration of CaO–ZrO2 and Cu–Mn samples have been investigated. To simplify the effect of reaction parameters, only one parameter is changed while others keep unchanged.
3.2.1 Reaction temperature. The effect of reaction temperature on the catalytic performance of MF synthesis is given in Fig. 8. It can be seen that CO conversion monotonically increases with the rise of temperature from 140 °C to 200 °C. The space-time yield (STY) of MF is relatively low at 140 °C, while it sharply reaches a maximum value of 4.18 g L−1 h−1 at 160 °C and then decreases. The MF selectivity firstly increases from 29.3% to 83.5% as the temperature rises from 140 °C to 160 °C, and then begins to decrease after further increasing the temperature. It can be inferred from eqn (1) that the synthesis of MF from syngas is a strongly exothermal reaction. The reaction proceeds slowly at low temperature, which leads to a low CO conversion. However, the selectivity of MF reaches maximum at the low temperature of 160 °C and begins to decrease at higher temperature. Therefore, the reaction temperature of 160 °C is beneficial to the formation of MF. The selectivity of formaldehyde and ethanol shows the opposite trend to that of MF.
 |
| | Fig. 8 The influence of reaction temperature on catalytic performance. Catalyst: C (CaO–ZrO2) = 30 g L−1, C (Cu–Mn) = 15 g L−1, p = 4 MPa, t = 8 h, solvent: V(CH3OH) = 15 mL, V(DMF) = 35 mL. | |
3.2.2 Reaction pressure. Eqn (1) indicates that the reaction of MF synthesis from syngas is a gas volume reducing process before and after reaction. As a consequence, the process would be favorable to the conversion of CO at higher reaction pressure in a thermodynamics point view, and vice versa. The relationship between catalytic performance and initial pressure is shown in Fig. 9. With increasing the pressure, CO conversion firstly increases from 11.0% at 2 MPa to 20.2% at 3 MPa and then decreases slowly as the pressure increases above 3 MPa. This result seems to be opposite to the thermodynamic rule that higher pressure would make the balance move towards the side where the gas volume decreases, vice versa, which could be explained by the evaluation method of catalyst. In the present work, the amount of feed gas purged into the batch reactor at low pressure is less than that at high pressure, which leads to the phenomenon that the CO conversion at high pressure is smaller than that at low pressure. The monotonic rise of STY (MF) from 2.85 g L−1 h−1 at 2 MPa to 4.03 g L−1 h−1 at 6 MPa could also demonstrate that the process of MF synthesis follows the thermodynamic rule above. The selectivity of MF consistently keeps about 80% with increasing pressure from 2 MPa to 6 MPa, indicating the little influence of reaction pressure on product selectivity.
 |
| | Fig. 9 The influence of reaction pressure on catalytic performance. Catalyst: C (CaO–ZrO2) = 30 g L−1, C (Cu–Mn) = 15 g L−1, T = 160 °C, t = 8 h, solvent: V(CH3OH) = 15 mL, V(DMF) = 35 mL. | |
3.2.3 The ratio of methanol to DMF. The polarity of solvent in this work is controlled by changing the volume ratio of methanol to DMF, and its influence on catalytic performance is listed in Table 1. As can be seen, CO conversion rises firstly and then declines with decreasing the ratio of methanol to DMF. The STY of MF reaches the maximum value of 4.18 g L−1 h−1 at the ratio of 3:7 and begins to decline with further decreasing the ratio. For selectivity, it can be seen that the MF selectivity firstly enhances with decreasing the ratio of methanol to DMF from 9:1 to 3:7 and then reaches a plateau level about 83.5%, whereas the selectivity of formaldehyde and ethanol substantially descend until the ratio of methanol to DMF decreases to 3:7. It is well-known that the polarity of methanol is higher than that of DMF, and the polarity of the liquid phase decreases with decreasing the ratio of methanol to DMF. Therefore, the appropriate polarity of solvent is indispensable for the high conversion of CO and STY of MF. The lower polarity of liquid phase is beneficial to the selectivity of MF, while the higher polarity of liquid phase supports the conversion of CO.48 Moreover, methanol or DMF molecular in solvent could interact with products, which may also have a significant influence on CO conversion and MF selectivity.
Table 1 Influence of methanol/DMF ratios on catalytic performancea
| V(CH3OH):V(DMF)b |
Conv. CO (%) |
STYc (g L−1 h−1) |
Selectivity (%) |
| MF |
HCHO |
MF |
C2H5OH |
CO2 |
| Catalyst: C (CaO–ZrO2) = 30 g L−1, C (Cu–Mn) = 15 g L−1, p = 4 MPa, T = 160 °C, t = 8 h, solvent: V = 50 mL. DMF: N,N-dimethylformamide. STY: space-time yield. |
| 9:1 |
10.9 |
0.67 |
17.4 |
42.1 |
30.0 |
10.5 |
| 7:3 |
13.8 |
0.75 |
15.7 |
50.9 |
22.8 |
10.6 |
| 5:5 |
12.4 |
4.09 |
4.0 |
80.6 |
11.3 |
4.1 |
| 3:7 |
11.9 |
4.18 |
1.7 |
83.5 |
11.0 |
3.8 |
| 1:9 |
7.5 |
2.44 |
2.0 |
83.8 |
11.8 |
2.5 |
3.2.4 The concentration of CaO–ZrO2 or Cu–Mn catalyst. The influence of CaO–ZrO2 concentration on catalytic performance is shown in Fig. 10. CO conversion drastically varies from 3.3% to 12.0% as the CaO–ZrO2 concentration increases from 0 to 30 g L−1. In this concentration range, the STY and the selectivity of MF also enhance significantly from 0.28 g L−1 h−1 and 14.4% to 2.08 g L−1 h−1 and 72.4%, respectively, while the selectivity of formaldehyde and ethanol decreases. Further increasing the CaO–ZrO2 concentration, its influence on CO conversion and selectivity could be ignored. The influence of Cu–Mn concentration on catalytic performance is shown in Fig. 11. CO conversion and MF selectivity firstly rise up to 12.2% and 74.2% as Cu–Mn concentration increases from 0 to 40 g L−1, and subsequently reduce with further increasing Cu–Mn concentration. As for the STY of MF, it monotonically increases until the concentration is more than 55 g L−1.
 |
| | Fig. 10 Influence of CaO–ZrO2 concentration on catalytic performance. Catalyst: C (Cu–Mn) = 15 g L−1, p = 4 MPa, T = 160 °C, t = 8 h, solvent: V(CH3OH) = 15 mL, V(DMF) = 35 mL. | |
 |
| | Fig. 11 Influence of Cu–Mn concentration on catalytic performance. Catalyst: C (CaO–ZrO2) = 20 g L−1, p = 4 MPa, T = 160 °C, t = 8 h, solvent: V(CH3OH) = 15 mL, V(DMF) = 35 mL. | |
More active sites would be exposed with increasing the catalyst concentration, when the concentration of CaO–ZrO2 or Cu–Mn catalyst increases below 30 g L−1 and 40 g L−1, leading to the increase of CO conversation and MF selectivity. However, as the concentration of CaO–ZrO2 and Cu–Mn catalysts is higher than 30 g L−1 and 40 g L−1, the mass transfer resistance of system increases with further increasing the concentration of samples.49 More specifically, the slurry dispersion of catalyst is defined and becomes worse; the apparent viscosity of system increases resulting in the decay of interface mobility, and the solubility of gas phase in slurry decreases. As a consequence of this, CO conversation and MF selectivity increase slowly or begin to decrease, and the reaction process might transfer to thermodynamics control from dynamics control.
3.3 Catalytic performance for MF synthesis
According to the above results, 160 °C, 3 MPa, 3:7 for the ratio of methanol to DMF, 40 g L−1 for Cu–Mn concentration and 30 g L−1 for CaO–ZrO2 concentration are the optimum reaction variables to directly synthesize MF from syngas in liquid phase. Under this reaction conditions, the highest catalytic activity and MF selectivity can be obtained over Cu–Mn/Ca–Zr catalyst. The catalytic performance of Cu–Mn/Ca–Zr catalyst is listed and compared to those of previous literatures in Table 2. As can be seen in Table 2, the CO conversion of 22.4% and the MF selectivity of 82.3% could be obtained on Cu–Mn/Ca–Zr catalyst under the optimum reaction conditions in this work. Although a relatively low CO conversion is presented on Cu–Mn/Ca–Zr compared to NaOCH3/Cu-catalyst, HCOOK/Cu-catalyst and KOCH3/Ni(CO)4 in previous literatures,26,49–51 Cu–Mn/Ca–Zr has higher MF selectivity than traditional catalysts above, which is due to the presence of synergistic effect between Cu–Mn and CaO–ZrO2 samples.
Table 2 Catalytic performance of different catalysts
| Catalyst |
Conv. CO (%) |
Sel. MF (%) |
Ref. |
| C (CaO–ZrO2) = 30 g L−1, C (Cu–Mn) = 40 g L−1, p = 3 MPa, T = 160 °C, t = 8 h, solvent: V(CH3OH) = 15 mL, V(DMF) = 35 mL. |
| Cu–Mn/Ca–Zr |
22.4 |
82.3 |
This worka |
| Ni(CO)4, KOCH3 |
57.7 |
66.9 |
26 |
| Cu–Mn, NaOCH3 |
— |
73.2 |
49 |
| CuCl, NaOCH3 |
— |
40.3 |
49 |
| Cu–Cr, KOCH3 |
88.6 |
5.6 |
50 |
| HCOOK, Cu catalyst |
75.6 |
2.6 |
51 |
3.4 Roles of CaO–ZrO2 and Cu–Mn in MF synthesis
It is worth noticing that CO conversion and MF selectivity are extremely low when CaO–ZrO2 or Cu–Mn catalyst is absence from liquid phase, as shown in Fig. 10 and 11. However, they sharply increase when the CaO–ZrO2 or Cu–Mn catalyst is introduced in system, indicating that both CaO–ZrO2 and Cu–Mn catalysts play important roles in MF direct synthesis from syngas. Higher catalytic activity could be obtained when the concentration of CaO–ZrO2 and Cu–Mn catalysts is 30 g L−1 and 40 g L−1 respectively, which might be due to the existence of synergistic effect between CaO–ZrO2 and Cu–Mn samples. Two steps of reaction route might present in the direct synthesis of MF on Cu–Mn/Ca–Zr catalytic system, and different elementary reactions proceed on CaO–ZrO2 and Cu–Mn catalysts, respectively (see 3.5). An optimum catalytic activity and MF selectivity can be obtained while two elementary reactions on CaO–ZrO2 and Cu–Mn catalysts proceed synergistically.
CaO–ZrO2 is a strong basic catalyst and can be applied to amounts of base-catalyzed reactions, such as Knoevenagel reaction, Michael additions, Tischenko reaction, Claisen–Schmidt condensation and acetonylacetone cyclization. With the presence of mesoporous CaO–ZrO2 solid base, Cu–Mn/Ca–Zr catalyst has an optimum catalytic activity in the synthesis of MF from syngas. The mesoporous structure and high specific surface of CaO–ZrO2 make the basic sites expose on the surface of sample, and its basic property is beneficial to the synthesis of MF according to the previous literature.52 The specifically proofs will be provided in another article of authors. On the other side, incomplete spinel of Cu1.5Mn1.5O4 is formed in Cu–Mn oxide, in which two Jahn–Teller ions of Cu2+ and Mn3+ are presented and confirmed by XPS, leading to a large number of surface oxygen on Cu–Mn catalyst.53 In addition, a strong interaction exists between Cu and Mn cations due to the formation of Cu1.5Mn1.5O4 phase. Therefore, two factors of Cu–Mn mixed oxides mentioned above provide well catalytic activity and MF selectivity for direct MF synthesis from syngas over Cu–Mn/Ca–Zr catalyst.
3.5 Understanding of MF synthesis
In the traditional direct synthesis of MF, carbonylation and hydrogenation reaction mechanism has been generally accepted.22–26 However, in this work, a new catalyst system of Cu–Mn/Ca–Zr is used, and different products are formed besides MF; thus the reaction mechanism might differ from carbonylation and hydrogenation. Basing on the results of Fig. 10 and 11, it can be known that CaO–ZrO2 or Cu–Mn catalyst is indispensable in the direct synthesis of MF to obtain high CO conversion and MF selectivity, and two elementary reactions on CaO–ZrO2 and Cu–Mn catalysts proceed synergistically. According to the previous literatures,30,54 the following reaction mechanism might exist in direct synthesis of MF on Cu–Mn/Ca–Zr catalyst, as shown in Fig. 12. At first adsorption formate species are formed on Cu–Mn catalyst, and then the reaction between adsorption formate species on Cu–Mn catalyst and methoxide adsorbed on CaO–ZrO2 catalyst proceeds to produce methyl formate, at last partial methyl formate may hydrogenate with hydrogen atom on Cu–Mn catalyst to get methanol, which also illustrates the significant of synergism between Cu–Mn and CaO–ZrO2. However, this reaction mechanism badly needs to be further confirmed in later work. We can conclude from above reaction route that the methanol in this system is not only a solvent but an intermediate to synthesize MF also.
 |
| | Fig. 12 Schematic for MF direct synthesis over Cu–Mn/Ca–Zr catalyst. | |
4. Conclusions
Cu–Mn/Ca–Zr catalyst prepared by mechanical mixing Cu–Mn and CaO–ZrO2 are highly active to the formation of methyl formate from syngas. Its methyl formate selectivity is higher than that of traditional catalyst (e.g. Cu-catalyst and NaOCH3). Incomplete spinel of Cu1.5Mn1.5O4 phase is formed in Cu–Mn mixed oxides, and CaO–ZrO2 solid base exhibits mesoporous structure with three basic sites on the surface. The optimum reaction conditions for methyl formate synthesis are 160 °C, 3 MPa, 3:7 for the ratio of methanol to DMF, 40 g L−1 for Cu–Mn concentration and 30 g L−1 for CaO–ZrO2 concentration. Under this optimum reaction conditions, CO conversion of 22.4% and MF selectivity of 82.3% are obtained, which can be attributed to the presence synergistic effect between Cu–Mn and CaO–ZrO2 samples. The present work prepared a novel Cu–Mn/Ca–Zr combined catalyst, which seems great potential in the green and efficient route to synthesize methyl formate from syngas.
Acknowledgements
The authors acknowledge the financial support from the National Natural Science Foundation of China (No. 21103217), the Strategic Priority Research Program of the Chinese Academy of Sciences (No. XDA01020304).
References
- F. E. Celik, H. Lawrence and A. T. Bell, J. Mol. Catal. A: Chem., 2008, 288, 87 CrossRef CAS PubMed.
- K. B. Wang and G. Y. Wang, Chin. Chem. Lett., 2007, 18, 811 CrossRef CAS PubMed.
- K. Wang, J. Yao, Y. Wang and G. Wang, J. Nat. Gas Chem., 2007, 16, 286 CrossRef CAS.
- W. G. Huang, D. H. He, J. Y. Liu and Q. M. Zhu, Appl. Catal., A, 2000, 199, 93 CrossRef CAS.
- V. V. Kaichev, G. Y. Popova, Y. A. Chesalov, A. A. Saraev, D. Y. Zemlyanov, S. A. Beloshapkin, A. Knop-Gericke, R. Schloegl, T. V. Andrushkevich and V. I. Bukhtiyarov, J. Catal., 2014, 311, 59 CrossRef CAS PubMed.
- K. O. Adebowale, A. Adewuyi and K. D. Ajulo, Int. J. Green Energy, 2012, 9, 297 CrossRef CAS PubMed.
- T. Tsoncheva, T. Venkov, M. Dimitrov, C. Minchev and K. Hadjiivanov, J. Mol. Catal. A: Chem., 2004, 209, 125 CrossRef CAS PubMed.
- L. He, H. Liu, C. Xiao and Y. Kou, Green Chem., 2008, 10, 619 RSC.
- Y. Iwase, T. Kobayashi, K. Inazu, A. Miyaji and T. Baba, Catal. Lett., 2007, 118, 146 CrossRef CAS.
- S. Jali, H. B. Friedrich and G. R. Julius, J. Mol. Catal. A: Chem., 2011, 348, 63 CrossRef CAS PubMed.
- G. T. Whiting, S. A. Kondrat, C. Hammond, N. Dimitratos, Q. He, D. J. Morgan, N. F. Dummer, J. K. Bartley, C. J. Kiely, S. H. Taylor and G. J. Hutchings, ACS Catal., 2015, 5, 637 CrossRef CAS.
- J. C. Colmenares, P. Lisowski, D. Lomot, O. Chernyayeva and D. Lisovytskiy, ChemSusChem, 2015, 8, 1676 CrossRef CAS PubMed.
- R. Wang, Z. Wu, G. Wang, Z. Qin, C. Chen, M. Dong, H. Zhu, W. Fan and J. Wang, RSC Adv., 2015, 5, 44835 RSC.
- H. Huang, W. Li and H. Liu, Catal. Today, 2012, 183, 58 CrossRef CAS PubMed.
- C. Han, X. Yang, G. Gao, J. Wang, H. Lu, J. Liu, M. Tong and X. Liang, Green Chem., 2014, 16, 3603 RSC.
- R. Wojcieszak, M. N. Ghazzal, E. M. Gaigneaux and P. Ruiz, Catal. Sci. Technol., 2014, 4, 738 CAS.
- R. Wang, Z. Wu, C. Chen, Z. Qin, H. Zhu, G. Wang, H. Wang, C. Wu, W. Dong, W. Fan and J. Wang, Chem. Commun., 2013, 49, 8250 RSC.
- M. Yadav, J. C. Linehan, A. J. Karkamkar, E. van der Eide and D. J. Heldebrant, Inorg. Chem., 2014, 53, 9849 CrossRef CAS PubMed.
- J. Chen, F. Xin, X. Yin, T. Xiang and Y. Wang, RSC Adv., 2015, 5, 3833 RSC.
- J. Chen, S. Qin, G. Song, T. Xiang, F. Xin and X. Yin, Dalton Trans., 2013, 42, 15133 RSC.
- J. Chen, F. Xin, S. Qin and X. Yin, Chem. Eng. J., 2013, 230, 506 CrossRef CAS PubMed.
- V. M. Palekar, J. W. Tierney and I. Wender, Appl. Catal., A, 1993, 103, 105 CrossRef CAS.
- V. M. Palekar, H. Jung and J. W. Tierney, Appl. Catal., A, 1993, 102, 13 CrossRef CAS.
- G. Jenner, Appl. Catal., A, 1995, 121, 25 CrossRef CAS.
- E. S. Lee and K. Aika, J. Mol. Catal. A: Chem., 1999, 141, 241 CrossRef CAS.
- S. Ohyama, E. S. Lee and K. Aika, J. Mol. Catal. A: Chem., 1999, 138, 305 CrossRef CAS.
- J. Lee, J. Kim and Y. Kim, Appl. Catal., 1990, 57, 1 CrossRef CAS.
- Y. Chen, B. Liaw and B. Chen, Appl. Catal., A, 2002, 236, 121 CrossRef CAS.
- R. Yang, X. Yu, Y. Zhang, W. Li and N. Tsubaki, Fuel, 2008, 87, 443 CrossRef CAS PubMed.
- Y. Zhang, R. Yang and N. Tsubaki, Catal. Today, 2008, 132, 93 CrossRef CAS PubMed.
- N. Tsubaki, M. Ito and K. Fujimoto, J. Catal., 2001, 197, 224 CrossRef CAS.
- B. Hu and K. Fujimoto, Catal. Lett., 2009, 129, 416 CrossRef CAS.
- Y. Liu, J. Chen and Y. Sun, Stud. Surf. Sci. Catal., 2005, 156, 249 CrossRef CAS.
- X. H. Zhang, H. Q. Su and Z. X. Yang, J. Mol. Catal. A: Chem., 2012, 360, 16 CrossRef CAS PubMed.
- S. Liu, J. Ma, L. Guan, J. Li, W. Wei and Y. Sun, Microporous Mesoporous Mater., 2009, 117, 466 CrossRef CAS PubMed.
- S. Xia, X. Guo, D. Mao, Z. Shi, G. Wu and G. Lu, RSC Adv., 2014, 4, 51688 RSC.
- H. Cao, X. Li, Y. Chen, M. Gong and J. Wang, J. Rare Earths, 2012, 30, 871 CrossRef CAS.
- H. Y. Chen and D. J. Hsu, J. Alloys Compd., 2014, 598, 23 CrossRef CAS PubMed.
- B. Gillot, S. Buguet, E. Kester, C. Baubet and P. Tailhades, Thin Solid Films, 1999, 357, 223 CrossRef CAS.
- J. Papavasiliou, G. Avgouropoulos and T. Ioannides, J. Catal., 2007, 251, 7 CrossRef CAS PubMed.
- A. Wollner, F. Lange, H. Schmelz and H. Knozinger, Appl. Catal., A, 1993, 94, 181 CrossRef.
- M. H. Kim, K. H. Cho, C. H. Shin, S. E. Kang and S. W. Ham, Korean J. Chem. Eng., 2011, 28, 1139 CrossRef CAS.
- D. Fang, J. Xie, D. Mei, Y. Zhang, F. He, X. Liu and Y. Li, RSC Adv., 2014, 4, 25540 RSC.
- G. Jernigan and G. A. Somorjai, J. Catal., 1994, 147, 567 CrossRef CAS.
- G. Zhang, J. Long, X. Wang, W. Dai, Z. Li, L. Wu and X. Fu, New J. Chem., 2009, 33, 2044 RSC.
- S. Y. Lee, N. Mettlach, N. Nguyen, Y. M. Sun and J. M. White, Appl. Surf. Sci., 2003, 206, 102 CrossRef CAS.
- H. Wang, M. Wang, W. Zhang, N. Zhao, W. Wei and Y. Sun, Catal. Today, 2006, 115, 107 CrossRef CAS PubMed.
- W. Chen, J. Nat. Gas Chem., 2000, 9, 139 CAS.
- X. Liu, W. Chen, Y. Wu, Z. Jia, S. Luo, S. Li, Y. Yang and Z. Yu, J. Nat. Gas Chem., 1999, 8, 286 CAS.
- S. Ohyama, Top. Catal., 2003, 22, 337 CrossRef CAS.
- B. Hu and K. Fujimoto, Appl. Catal., A, 2008, 346, 174 CrossRef CAS PubMed.
- S. Goodarznia and K. J. Smith, J. Mol. Catal. A: Chem., 2010, 320, 1 CrossRef CAS PubMed.
- H. Y. Chen and D. J. Hsu, J. Alloys Compd., 2014, 598, 23 CrossRef CAS PubMed.
- L. Shi, K. Tao, R. Yang, F. Meng, C. Xing and N. Tsubaki, Appl. Catal., A, 2011, 401, 46 CrossRef CAS PubMed.
|
| This journal is © The Royal Society of Chemistry 2015 |
Click here to see how this site uses Cookies. View our privacy policy here. 


