DOI:
10.1039/C5RA13440D
(Paper)
RSC Adv., 2015,
5, 88392-88400
Rapidly accomplished femtomole soluble CD40 ligand detection in human serum: a “green” homobifunctional agent coupled with reduced graphene oxide-tetraethylene pentamine as platform
Received
9th July 2015
, Accepted 5th October 2015
First published on 5th October 2015
Abstract
The analysis of soluble CD40 ligand (sCD40L), which is present at significant levels in the blood of patients with cardiovascular disease, can reveal the severity of the disease at its early stage. However, the current biomarker detection techniques exhibit poor detection limits. To accomplish this main challenge, herein, we demonstrate an assay based on a novel modified electrochemical immunosensor for the ultrasensitive assay of sCD40L in human serum, which uses β-cyclodextrin (CD) and reduced graphene oxide-tetraethylene (rGO-TEPA) as a platform. rGO-TEPA contains a great number of amino groups and has excellent conductivity, which makes it a promising material for application in electrochemical biosensor development. To further improve the solubility and stability of rGO-TEPA, CD was selected. The CD decorated rGO-TEPA film not only improved the electron transfer but also provided more amino-groups for the immobilization of antibodies. For speeding up the immobilization of antibodies, the amine-modified electrodes were functionalized by a “green” conjugation route using a lower toxicity homobifunctional 1,4-phenylene diisothiocyanate (PDITC) linker. This is the first study that challenges electrochemical immunosensors with CD-rGO-TEPA-PDITC as a platform for the detection of biomarkers. Under optimal conditions, sCD40L could be assayed in the range of 0.25 to 50 pg mL−1 with detection limits of 83.3 fg mL−1 (S/N = 3). We demonstrate excellent specificity and show that the proposed assay accurately detects the protein of interest. The results were in agreement with an enzyme linked immunosorbent assay, suggesting that the electrochemical immunosensor may possess potential towards use in clinical applications of the proposed immunosensor.
1. Introduction
Cardiovascular disease (CVD) is listed as a silent killer and has become a cause of mortality in both advanced and developing countries.1,2 Traditional diagnosis methods mainly include a scoring system (CVD score),3 and symptoms such as past history of myocardial infarction, definite angina and cardiomegaly.4 An electrocardiogram (ECG) is so far the best test for identifying patients with acute CVD.5 Unfortunately, alternative technologies to the classic methods above are of value for later diagnosis after the disease happened. Therefore, it is necessary to develop supplementary chemical assay methods for the early detection of CVD. Biomarker detection is one of the best methods to identify the disease following an ECG.6 There are several biomarkers associated with CVD, including low density lipoprotein cholesterol, soluble CD40 ligand (sCD40L) and high sensitivity C-reactive protein.7 An increased level of plasma soluble CD40L (sCD40L) was observed in patients with acute coronary syndrome.8 It is also reported that sCD40L is a predictor for diagnosis of CVD.9,10 Thus, a method that is accurate, specific and able to detect sCD40L directly in serum is required urgently.
Among the various measurement techniques, a versatile platform for biodetection has been developed based on an electrochemical immunosensor,11–14 which offers advantages including high sensitivity, reliable reproducibility, low cost, minimal sample preparation and short analysis time. Given these advances, a novel and effective immunosensor was fabricated to detect sCD40L levels.
To achieve a high detection sensitivity towards sCD40L, various nanomaterials that offer a larger surface area and improve the biocompatibility and stability of the system15,16 must be used. Reduced graphene oxide (rGO) is often used in electrochemical sensors,17,18 because its abundant chemical groups facilitate charge transfer and thus ensure high electrochemical activity.19 Moreover, the populated chemical moieties on the rGO surface offer convenience and flexibility for various functionalizations to enhance the sensor performance. Compared to non-conductive GO, rGO has the ability to facilitate electron transfer. Furthermore, rGO can also be functionalized through covalent or non-covalent methods in order to further enhance its sensitivity, loading capacity, specificity, biocompatibility, etc. A novel composite consisting of reduced graphene oxide (rGO) covalently bonded to tetraethylene pentamine (TEPA) has been developed.19,20 This composite sustains the original property of rGO. It demonstrates excellent conductivity and improved water solubility.19,21 Most importantly, rGO-TEPA contains a large number of amino groups, which makes it easy to form covalent bonds with antibodies or other nanomaterials. In this work, β-cyclodextrin (CD) was used to prevent the aggregation of rGO-TEPA. CD is an oligosaccharide composed of seven glucose units with many hydroxyl terminals. These hydroxyl terminals can form hydrogen bonds with the amino groups of rGO-TEPA, which improves the stability of rGO-TEPA on the electron surface. In addition, CD is water-soluble, environmentally friendly, and can improve the solubility and stability of functional materials.22 To facilitate the immobilisation of specific antibodies to the antigen of interest, the homobifunctional molecule 1,4-phenylene diisothiocyanate (PDITC C6H4(NCS)2) was selected instead of the usual crosslinking agent, glutaraldehyde. As a conjunction agent, PDITC contains two thiocyanate groups at the two ends of the molecule, which can covalently bond with the amino groups of rGO-TEPA. This is because, compared to glutaraldehyde, PDITC can not only improve the stability of rGO, but also speed up the immobilisation process of antibodies. To the best of our knowledge, CD-rGO-TEPA-PDITC has not been applied as a platform in the fabrication of electrochemical immunosensors for the detection of biomarkers.
Herein, we report a simple immunosensor for the ultrasensitive assay of sCD40L in human sera. The immunosensor included a glassy carbon electrode (GCE) modified by CD-rGO-TEPA. This material can be used as an immunosensing platform owing to its excellent conductive property, hydrophilicity and large specific surface area. Then, antibodies were cross-linked on the CD-rGO-TEPA modified electrodes through PDITC, followed by the blocking of the unreacted thiocyanate groups with ethanolamine. Owing to the synergistic efforts of CD and rGO-TEPA, the stability and sensitivity of the prepared immunosensor were improved. Furthermore, this method was successfully applied to the detection of sCD40L in human serum samples. The results of the electrochemical studies suggested that the developed immunosensor possesses great performance for sCD40L determination and has potential for application in the analysis of clinical and experimental biological samples.
2. Materials and methods
2.1. Materials and reagents
rGO-TEPA was obtained from Nanjing XFNANO Materials Tech Co., Ltd. (China). CD was provided by Tianjin Bodi Chemical Co. Ltd. (China). PDITC, N,N-dimethyl formamide (DMF), pyridine, ascorbic acid (AA), dopamine (DA), glucose, ethanolamine (EA), bovine serum albumin (BSA, 96–99%), potassium ferrocyanide (K4Fe(CN)6) and potassium ferricyanide (K3Fe(CN)6) were provided by Sigma-Aldrich. sCD40L ELISA kits were acquired from Linc-Bio Science Co., Ltd. (Shanghai, China). Clinical serum samples were supplied by a local hospital and stored at 4 °C. Phosphate buffered solution (PBS; pH 7.4, 0.1 M) was prepared using NaH2PO4 and Na2HPO4. PBS of a more alkaline pH was prepared by adding 1.0 M aqueous NaOH solution. Other chemical reagents were of analytical grade and used as received. All aqueous solutions were prepared with deionized distilled water (>18.2 MΩ) obtained from a Milli-Q water purifying system.
2.2. Apparatus
All electrochemical experiments were performed with a CHI660D electrochemical workstation at room temperature (Chenhua Instruments Co., Shanghai, China). A GCE (4 mm in diameter) was used as the working electrode. A saturated calomel electrode (SCE) (caution: SCE contains mercury, so extreme caution should be exercised when using it) was used as the reference electrode and a 0.5 mm diameter platinum wire used as the counter electrode. Transmission electron microscopy (TEM) was performed with a Hitachi-7500158 (Hitachi Limited, Japan) microscope. Scanning electron microscopy (SEM) was conducted using a Hitachi S-3000N (Hitachi Limited, Japan) microscope. Field emission scanning electron microscopy (Fe-SEM) was conducted using a Hitachi S4800 (Hitachi Limited, Japan) microscope. Fourier transform-infrared (FT-IR) spectra were collected using a Nicolet 6700 FT-IR spectrometer with KBr pressed disks (Thermo Nicolet, USA).
All electrochemical measurements were performed in 0.1 M KCl solution containing 5 mM [Fe(CN)6]4−/[Fe(CN)6]3−. Cyclic voltammetry (CV) was performed between −0.2 to 0.6 at a scan rate of 50 mV s−1. Electrochemical impedance spectroscopy (EIS) was conducted in a frequency range from 100 kHz to 1 Hz. The differential pulse voltammetry (DPV) was performed between −0.3 and 0.6 V at a scan rate of 50 mV s−1.
2.3. Preparation of CD-rGO-TEPA
The rGO-TEPA solution was prepared by firstly dissolving 5 mg of β-CD in 1 mL water that was then stirred for 5 min, before 2 mg rGO-TEPA was added. Finally, the whole solution was sonicated for 2 h to form a homogeneous solution and stored at 4 °C for further use.
2.4. Fabrication of the immunosensor
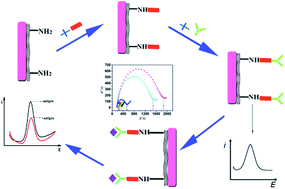
Scheme 1 shows the preparation procedure of the immunosensor. Prior to modification, the GCE was polished with slurries of 0.3 and 0.05 μm before being rinsed with water. The electrode was then sequentially sonicated in water, ethanol and water for 5 min. After being dried at room temperature, 6 μL of rGO-TEPA solution was applied to the pre-treated GCE and this was allowed to dry in air. The terminal amino groups of the rGO-TEPA modified electrodes were activated by applying 6 μL of 10 mmol L−1 PDITC in pyridine and DMF (v/v, 1
:
9) on top for 75 min to form a cross linker monolayer. Then the electrode was washed three times with DMF, ethanol, and PBS (pH 7.4). The PDITC-modified electrode was incubated in 8 μL of sCD40L antibodies for 45 min, and rinsed with PBS to remove unbound antibodies. Next, the modified electrode was immersed in 0.1 M of ethanolamine for 30 min to deactivate the remaining thiocyanate groups on PDITC and block any unreacted active sites, and then washed with PBS (pH 8.5) several times.23
 |
| Scheme 1 Illustration of the stepwise process for sCD40L immunosensor fabrication. | |
2.5. Measurement procedure
In our work, 8 μL of sCD40L antigens or spiked serum samples of different concentrations were coated onto the electrodes and incubated for 45 min with concentrations varying from 250 fg mL−1 to 50 pg mL−1 to form the antigen–antibody immunocomplex. The immunosensor was rinsed thoroughly with copious amounts of PBS (pH = 7.4) prior to the electrochemical measurements.
To carry out the electrochemical measurements, DPV was conducted to record all electrochemical measurements. The change in current response to the antigen–antibody reaction was used as the analytical signal.
3. Results and discussion
3.1. Morphology and structural characterization of the as-prepared materials
To demonstrate the successful assemble of the electrode modifying materials, the morphology of rGO-TEPA was initially characterized by SEM and TEM. As shown in Fig. 1A, rGO-TEPA had a wrinkled, paper-like structure. To further illustrate the morphology of rGO-TEPA, FE-SEM was used. As can be seen in Fig. 1B, rGO-TEPA exhibits a large surface area, which helps in electron transportation. Fig. 1C shows the stability of CD-rGO-TEPA and rGO-TEPA. This image shows that CD-rGO-TEPA (Fig. 1C (2)) remained as a homogeneous solution 10 days after preparation, which was much more stable than that of rGO-TEPA (Fig. 1C (1)). These results exhibited that the presence of CD prevented aggregation of rGO-TEPA. Fig. 1D and E show a comparison of the transmission scanning micrographs of CD-rGO-TEPA and rGO-TEPA. rGO-TEPA showed a thick typical wrinkle paper-like structure. In contrast, CD-rGO-TEPA was transparent and had some distortions attributed to the thinner layers that resulted in a wrinkled topology, which was not only beneficial for the improvement of the electron transfer properties but also favorable for the adsorption of antibodies. In order to further prove the formation of CD-rGO-TEPA, FT-IR was employed to characterize rGO-TEPA, β-CD and CD-rGO-TEPA, as shown in Fig. 1F. The FT-IR of rGO-TEPA (curve a) exhibited a typical absorption feature of –NH2 at 3545 cm−1. It is noted that the FT-IR spectrum of β-CD (curve b) and CD-rGO-TEPA (curve c) both revealed β-CD absorption features of the coupled C–O/C–C stretching/O–H bending vibrations at 1030 cm−1, the coupled C–O–C stretching/O–H bending vibrations at 1187 cm−1, the C–H/O–H bending vibrations at 1452 cm−1, CH2 stretching vibrations at 2925 cm−1, and the O–H stretching vibrations at 3300 cm−1.24,25 The presence of all of these peaks support a successful synthesis of a CD-rGO-TEPA layer on the electrode.
 |
| Fig. 1 SEM and FE-SEM images of rGO-TEPA (A and B). Photographs (C) of rGO-TEPA (1) and CD-rGO-TEPA (2). TEM image of rGO-TEPA (D) and CD-rGO-TEPA (E). FT-IR (F) spectra of (a) rGO-TEPA, (b) β-CD and (c) CD-rGO-TEPA. | |
3.2. Electrochemical behaviors of CD-rGO-TEPA/GCE and rGO-TEPA/GCE
To demonstrate the advantages of this modified electrode material in terms of electrochemical performance, CV and EIS were used. The electrochemical behavior of different modified electrodes was investigated by CV. Fig. 2A shows the CVs of 5 mM [Fe(CN)6]4− and 5 mM [Fe(CN)6]3− at a bare GCE (curve a), an rGO-TEPA modified GCE (curve b), and a CD-rGO-TEPA modified GCE (curve c) in 0.1 M KCl solution at a scan rate of 50 mV s−1. As can be seen, the CD-rGO-TEPA modified GCE shows a 12.1% higher peak current than that obtained at an rGO-TEPA modified GCE, implying that CD-rGO-TEPA was a great electric conducting material and expedited the electron transfer. This mainly arose from the capability of CD in preventing the stacking of rGO-TEPA, and also from the resulting larger electrode surface area. In addition, electrochemical impedance spectroscopy (EIS) was used to investigate the changes of electron transfer resistance on the different modified electrodes in 0.1 M KCl solution containing 5 mM [Fe(CN)6]4− and 5 mM [Fe(CN)6]3−. The semicircle diameter in EIS is equal to the electron transfer resistance (Ret), and the linear part of the curve at low frequency represents the diffusion process. As shown in Fig. 2B, a relatively larger interface electron transfer resistance was obtained at the bare GCE (curve a). When the electrode was modified with CD-rGO-TEPA (curve c), the resistance was larger than for the electrode modified with rGO-TEPA (curve b). This may caused by the fact that CD contains hydroxyl terminals, which could form hydrogen bonds with the amino groups of rGO-TEPA, thus improving the stability of rGO-TEPA on the electron surface. The results of EIS are in agreement with the conclusions obtained from CV.
 |
| Fig. 2 CVs (A) and Nyquist plots (B) of bare GCE (a), rGO-TEPA/GCE (b) and CD-rGO-TEPA/GCE (c). CVs (C) and Nyquist plots (D) of bare GCE (a), CD-rGO-TEPA/GCE (b), PDITC/CD-rGO-TEPA/GCE (c), Ab/PDITC/CD-rGO-TEPA/GCE (d) EA/antibody/PDITC/CD-rGO-TEPA/GCE (e) and antigen/EA antibody/PDITC/CD-rGO-TEPA/GCE (f). | |
3.3. Electrochemical performance of the immunosensor
To further monitor the successful assembly process of the modified electrode, a series of electrochemical measurements was conducted. As shown in Fig. 2C, CV of 5 mM [Fe(CN)6]4− and 5 mM [Fe(CN)6]3− in 0.1 M KCl solution at a scan rate of 50 mV s−1 was used to monitor the fabrication of the electrode. The curve of the bare GCE (curve a) had a pair of well-defined voltammetric peaks. After modification with CD-rGO-TEPA (curve b), the peak current was 27.5% higher than that at a bare GCE, which indicated that CD-rGO-TEPA could promote electron transfer. When the cross-linking agent PDITC was immobilized on the electrode, the peak current (curve c) decreased by 23.9% compared to curve b, owing to the poor conductivity of PDITC. When antibodies were immobilised on CD-rGO-TEPA (curve d), there was a further 24.1% decrease in the peak current, demonstrating that the antibodies hindered the electron transfer. Subsequently, the immunosensor was blocked with ethanolamine and then incubated with sCD40L antigen, and the current signal decreased further by 27.1% and 34.0% (curves e and f). The reason for this may be ascribed to the poor conductive nature of ethanolamine and the protein hindering the diffusion of the redox probe toward the electrode surface.26,27
The CV results were further confirmed by EIS Nyquist plots through the biosensor fabrication. As shown in Fig. 2D, the semicircle associated with the GCE modified with the nanomaterial CD-rGO-TEPA (curve b, Ret = 75.67 Ω) was smaller than that of bare GCE (curve a, Ret = 275.8 Ω), indicating that this nanomaterial accelerated the electron transfer. When the modified electrode was incubated with PDITC, the resistance increased (curve c, Ret = 100.4 Ω) demonstrating that the cross-linking agent hindered the electron transfer between the base solution and electrode. The value of resistance was found to increase (curve d, Ret = 386.8 Ω) after the immobilization of antibodies onto the modified electrode because of the insulating nature of the antibodies. The further increase in resistance (curve e, Ret = 1290 Ω) after the addition of ethanolamine was attributed to the blockage of any remaining free thiocyanate groups. When antigens were added, the resistance further increased (curve f, Ret = 1611 Ω), indicating the formation of an immunocomplex. As a result, the biosensor had been fabricated successfully. These results were in agreement with the changes observed in the peak current change measured by CV.
3.4. Scan rate study
The influence of varying the scan rate on the peak current response at the CD-rGO-TEPA electrode was investigated, which was used to evaluate the kinetics of the modified electrodes.28 As shown in Fig. 3A, the peak currents of the anodic and cathodic peaks increased with an increase in the scan rate in the range of 20–120 mV s−1. The peak currents of both the anodic and cathodic peaks showed a good linear relationship with the square root of the scan rate in Fig. 3B.29 According to the equation of Randles–Sevcik from Muller’s work,30 this result indicated that the process was controlled by diffusion, which was similar to the findings in previous reports.28,29
 |
| Fig. 3 CVs (A) of CD-rGO-TEPA/GCE with different scan rates (20, 50, 80, 100 and 120 mV s−1), (B) the dependence of the peak currents on scan rates. | |
3.5. Optimization of detection conditions
The immunosensor response can be influenced by experimental conditions such as the concentration of CD-rGO-TEPA, the conjugation time between PDITC and the antibodies, the volume of antibodies, and the incubation time of the antibodies and antigens. The above detection conditions were investigated in our studies to obtain the best analytical performance for the immunosensor.
The optimal concentration of CD-rGO-TEPA for the preparation of the immunosensor was investigated, and the results are shown in Fig. 4A. As can be seen, the current response increased gradually with an increasing concentration of CD-rGO-TEPA from 0.25 to 2.0 mg mL−1, and then decreased upon a further increase in concentration. A further increase in the CD-rGO-TEPA thickness seemed to decrease the current change, possibly because the excess amount of CD-rGO-TEPA blocked the electron transfer. Therefore, 2.0 mg mL−1 CD-rGO-TEPA was chosen as the optimal concentration.
 |
| Fig. 4 Effects of the concentration of rGO-TEPA (A), incubation time between PDITC and antibodies (B), the volume of antibodies (C) and incubation time between antigens and antibodies (D) on the immunosensor. | |
In addition, the conjunction time between PDITC and the antibodies was also an important parameter affecting the sensitivity of the immunosensor. As shown in Fig. 4B, the current response increased due to the enhanced loading capacity of the antibodies for the capture of more antigens, and then plateaued off at 75 min, which indicated that the maximum capacity of antibodies was obtained. Therefore, 75 min was selected as the optimal conjunction time.
The volume of antibodies is another important factor that affects the response current. As shown in Fig. 4C, the response current increased with the variation in volume from 2 to 8 μL due to the enhanced loading of antibodies for the capture of more antigens, reached the highest value maximum at 8 μL and then started to level off, which suggests that the amount of antibodies captured on the surface of the sensor reaches a maximum. Therefore 8 μL of antibodies was chosen as the optimal condition.
The incubation time also influenced the analytical performance of the immunosensor. As can be seen in Fig. 4D, the current change increased with increasing incubation time from 15 min to 45 min and remained stable after 45 min. This implied that the binding of the immunocomplex reached saturation after 45 min. Therefore, 45 min was used as the incubation time for further experiments.
3.6. Assay performance
Under the above optimal conditions, DPV of 5 mM [Fe(CN)6]4− and 5 mM [Fe(CN)6]3− in 0.1 M KCl solution at a scan rate of 50 mV s−1 was used to evaluate the performance of the immunosensor incubated with different concentrations of antigens or other samples. The current changes were directly proportional to the concentrations of sCD40L. Fig. 5A presents the detection of sCD40L with the prepared electrochemical immunosensor where the analyte concentration varied from 250 fg mL−1 to 50 pg mL−1 with a detection limit of 83.3 fg mL−1 (S/N = 3), which was lower than several methods previously reported.31,32 This result can be contributed to the advantage of the combination of CD and rGO-TEPA. Based on the peak current in Fig. 5A, the linear regression equation was ΔI (μA) = 6.05023 + 4.17768C1/2 (pg mL−1) (n = 3, R = 0.993) (Fig. 5B). A comparison of the detection limits between the proposed immunosensor and other methods in the literature is listed in Table 1, which shows that the proposed method enabled lower detection limits. The results demonstrated that the proposed immunosensor could be used to detect sCD40L concentration quantitatively.
 |
| Fig. 5 (A) DPV responses of the proposed immunosensor after incubation with different concentrations of sCD40L (vs. SCE), (B) calibration plot of the developed immunosensor for sCD40L (n = 3). | |
Table 1 Comparison of different methods of detecting sCD40L
Method |
Detection limit |
Reference |
Functionalized magnetic beads |
1.7 ng mL−1 |
Hoyoung Park et al.31 (2013) |
Reduced graphene oxide-tetraethylene pentamine adsorbed metal ions |
13.1 pg mL−1 |
Guolin Yuan et al.32 (2015) |
Reduced graphene oxide-tetraethylene pentamine combined β-cyclodextrin |
83.3 fg mL−1 |
This work |
3.7. Reproducibility, stability, and selectivity of the electrochemical immunosensor
The reproducibility of the electrochemical immunosensor was investigated by relative standard derivations (RSD) of inter- and intra-analysis using 50 pg mL−1 sCD40L (Fig. 6A). The results were estimated using one biosensor for five assays and three immunosensors for one assay, respectively. The inter-assay RSD value was 1.9%, the intra-assay RSD value was 4.8%. These results demonstrate that the reproducibility of the immunosensor is satisfactory.
 |
| Fig. 6 (A) Reproducibility of 7 different electrodes modified with 50 pg mL−1 of sCD40L. (B) Specificity of the immunosensor to 25 pg mL−1 of sCD40L, 50 ng mL−1 of AA, 50 ng mL−1 of DA, 50 ng mL−1 of glucose, 50 ng mL−1 of BSA, 50 ng mL−1 of ST6Gal-I and 27 ng mL−1 of SAA. (C) Stability of the immunosensor in the presence of 25 pg mL−1 sCD40L, where n = 3 for each point. | |
To investigate the selectivity of the immunosensor towards sCD40L, some potential interferents, such as ascorbic acid (AA), dopamine (DA), D-(+)-glucose (Glu), bovine serum albumin (BSA), serum amyloid A protein (SAA) and beta-galactoside alpha-2,6-sialyltransferase (ST6Gal-I) were used to evaluate the selectivity of the immunosensor.
As shown in Fig. 6B, only the immunosensor incubated with 25 pg mL−1 sCD40L had an obvious peak current, which validated that the specificity of the immunosensor was acceptable.
The long-term storage stability was assessed at 3-day, 7-day, 14-day, 21-day and 28-day periods while the electrochemical immunosensor was stored at 4 °C. The peak current retained 98.4%, 96.04%, 95.6%, 95.09%, and 94.69% of the original value, respectively. These results indicated that the stability of the assay system was acceptable.
3.8. Recovery testing
To investigate the reliability and potential application of the immunosensor, the proposed electrochemical immunosensor was applied to test the recoveries of three human samples spiked with 0.5 pg mL−1, 5 pg mL−1, 50 pg mL−1 sCD40L antigen. The results can be observed from Table 2 that the recoveries of the three concentrations were 97.14%, 96.73%, 100.66%, demonstrating the proposed immunosensor might be applied for the determination of sCD40L in human serum.
Table 2 Recovery of sCD40L in human serum samples
sCD40L added (pg mL−1) |
sCD40L found (pg mL−1) |
RSD (%) |
Recovery (%) |
0.5 |
0.49 ± 0.04 |
3.80 |
97.14 |
5 |
4.84 ± 0.04 |
2.90 |
96.73 |
50 |
50.33 ± 0.04 |
0.95 |
100.66 |
3.9. Serum sample analysis
The detection of human serum sample is a vital index for evaluating the reliability of the immunosensor. The concentrations of three human serum samples, which come from a local hospital, were determined by the proposed method. Each sample was detected five times. The assay results were compared with reference values coming from the commercial enzyme-linked immunosorbent assay (ELISA) method. As shown in Table 3, the RSD values between the two methods were 1%, 2.1% and −2.8% for each sample, demonstrating acceptable accuracy. As a result, the proposed immunosensor could be applied to determine the concentration of sCD40L in serum samples.
Table 3 Assay results of clinical serum samples by the proposed and ELISA methods
Samples |
Proposed method (pg mL−1) |
ELISA method (pg mL−1) |
Relative error (%) |
Sample-1 |
82.30 ± 0.048 |
81.52 ± 0.032 |
1.0 |
Sample-2 |
41.17 ± 0.041 |
40.30 ± 0.031 |
2.1 |
Sample-3 |
73.57 ± 0.048 |
75.70 ± 0.032 |
−2.8 |
4. Conclusions
In summary, a simple novel label-free immunosensor based on CD-rGO-TEPA, a great conductive material, for the direct assay of sCD40L in human serum was fabricated. The highlights of this work could be summarized as follows: (1) CD-rGO-TEPA was used as a template for the direct conjunction of antibodies through PDITC for the first time. (2) The developed sensor has a good linear range with a low detection limit and high specificity. (3) The immunosensor is also advantageous due to its low cost, short analysis time, high sensitivity, and good reproducibility, which makes it a valuable tool for sCD40L detection. This simple and effective method reported here shows a great potential for clinical detection and experimental research.
Acknowledgements
The research was financed by the National Natural Science Foundation of China (No. 81370403 and 21205146).
References
- S. Yusuf, S. Reddy, S. Ounpuu and S. Anand, Circulation, 2001, 104, 2746–2753 CrossRef CAS PubMed.
- S. Yusuf, S. Reddy, S. Ounpuu and S. Anand, Circulation, 2001, 104, 2855–2864 CrossRef CAS PubMed.
- T. F. Yeh, D. Raval, J. Luken, A. Thalji, L. Lilien and R. S. Pildes, Crit. Care Med., 1981, 9, 655–657 CrossRef CAS.
- J. R. Masarei, H. T. Kiiveri and K. Stanton, Pathology, 1986, 18, 89–93 CrossRef CAS.
- W. B. Gibler, C. P. Cannon, A. L. Blomkalns, D. M. Char, B. J. Drew, J. E. Hollander, A. S. Jaffe, R. L. Jesse, L. K. Newby, E. M. Ohman, E. D. Peterson, C. V. Pollack, C. American Heart Association Council on Clinical, N. American Heart Association Council on Cardiovascular, C. Quality of, G. Outcomes Research Interdisciplinary Working and C. Society of Chest Pain, Ann. Emerg. Med., 2005, 46, 185–197 CrossRef PubMed.
- B. J. Willcox, R. D. Abbott, K. Yano, B. L. Rodriguez, D. C. Willcox and J. D. Curb, Expert Rev. Neurother., 2004, 4, 507–518 CrossRef CAS PubMed.
- S. Guldiken, B. Guldiken, M. Demir, L. Kabayel, H. Ozkan, N. Turgut, R. Hunkar and S. Kat, J. Headache Pain, 2011, 12, 355–360 CrossRef CAS PubMed.
- N. Varo, J. A. de Lemos, P. Libby, D. A. Morrow, S. A. Murphy, R. Nuzzo, C. M. Gibson, C. P. Cannon, E. Braunwald and U. Schonbeck, Circulation, 2003, 108, 1049–1052 CrossRef CAS PubMed.
- B. Zhang, M. Chen, H. Yang, T. Wu, C. Song and R. Guo, Neurosci. Lett., 2014, 567, 6–10 CrossRef CAS PubMed.
- I. Erturan, B. K. Koroglu, A. Adiloglu, A. M. Ceyhan, V. B. Akkaya, N. Tamer, P. Y. Basak, S. Korkmaz, I. H. Ersoy and O. Kilinc, Int. J. Dermatol., 2014, 53, 503–509 CrossRef CAS PubMed.
- J. Lu, S. Liu, S. Ge, M. Yan, J. Yu and X. Hu, Biosens. Bioelectron., 2012, 33, 29–35 CrossRef CAS PubMed.
- H. Wang, H. Li, Y. Zhang, Q. Wei, H. Ma, D. Wu, Y. Li, Y. Zhang and B. Du, Biosens. Bioelectron., 2014, 53, 305–309 CrossRef CAS PubMed.
- J. Hu, Y. Yu, J. C. Brooks, L. A. Godwin, S. Somasundaram, F. Torabinejad, J. Kim, C. Shannon and C. J. Easley, J. Am. Chem. Soc., 2014, 136, 8467–8474 CrossRef CAS PubMed.
- J. Hu, T. Wang, J. Kim, C. Shannon and C. J. Easley, J. Am. Chem. Soc., 2012, 134, 7066–7072 CrossRef CAS PubMed.
- K. J. Huang, J. Li, Y. Y. Wu and Y. M. Liu, Bioelectrochemistry, 2013, 90, 18–23 CrossRef CAS PubMed.
- M. Zhou, Y. Zhai and S. Dong, Anal. Chem., 2009, 81, 5603–5613 CrossRef CAS PubMed.
- T. Y. Huang, J. H. Huang, H. Y. Wei, K. C. Ho and C. W. Chu, Biosens. Bioelectron., 2013, 43, 173–179 CrossRef CAS PubMed.
- H. Teymourian, A. Salimi and S. Khezrian, Biosens. Bioelectron., 2013, 49, 1–8 CrossRef CAS PubMed.
- D. Wu, A. Guo, Z. Guo, L. Xie, Q. Wei and B. Du, Biosens. Bioelectron., 2014, 54, 634–639 CrossRef CAS PubMed.
- X. Zhang, F. Li, Q. Wei, B. Du, D. Wu and H. Li, Sens. Actuators, B, 2014, 194, 64–70 CrossRef CAS PubMed.
- A. Guo, Y. Li, W. Cao, X. Meng, D. Wu, Q. Wei and B. Du, Biosens. Bioelectron., 2015, 63, 39–46 CrossRef CAS PubMed.
- Y. Guo, S. Guo, J. Ren, Y. Zhai, S. Dong and E. Wang, ACS Nano, 2010, 4, 4001–4010 CrossRef CAS PubMed.
- R. Elshafey, C. Tlili, A. Abulrob, A. C. Tavares and M. Zourob, Biosens. Bioelectron., 2013, 39, 220–225 CrossRef CAS PubMed.
- L. Yang, S. Fan, G. Deng, Y. Li, X. Ran, H. Zhao and C. P. Li, Biosens. Bioelectron., 2015, 68, 617–625 CrossRef CAS PubMed.
- L. Yang, H. Zhao, C. P. Li, S. Fan and B. Li, Biosens. Bioelectron., 2015, 64, 126–130 CrossRef CAS PubMed.
- N. Liu, X. Chen and Z. Ma, Biosens. Bioelectron., 2013, 48, 33–38 CrossRef CAS PubMed.
- Y. Li, J. He, C. Xia, L. Gao and C. Yu, Biosens. Bioelectron., 2015, 70, 392–397 CrossRef CAS PubMed.
- X. Lu, Y. Li, X. Zhang, J. Du, X. Zhou, Z. Xue and X. Liu, Anal. Chim. Acta, 2012, 711, 40–45 CrossRef CAS PubMed.
- X. Che, R. Yuan, Y. Chai, J. Li, Z. Song, W. Li and X. Zhong, Colloids Surf., B, 2011, 84, 454–461 CrossRef CAS PubMed.
- C. I. Muller and C. Lambert, Langmuir, 2011, 27, 5029–5039 CrossRef PubMed.
- H. Park, J. W. Lee, M. P. Hwang and K. H. Lee, Nanoscale, 2013, 5, 8609–8615 RSC.
- G. Yuan, C. Yu, C. Xia, L. Gao, W. Xu, W. Li and J. He, Biosens. Bioelectron., 2015, 72, 237–246 CrossRef CAS PubMed.
Footnote |
† Junlin He and Yilin Zhao contributed equally to this work. |
|
This journal is © The Royal Society of Chemistry 2015 |
Click here to see how this site uses Cookies. View our privacy policy here.