DOI:
10.1039/C5RA13383A
(Paper)
RSC Adv., 2015,
5, 70387-70394
A novel non-enzymatic amperometric glucose sensor based on a hollow Pt–Ni alloy nanotube array electrode with enhanced sensitivity
Received
8th July 2015
, Accepted 5th August 2015
First published on 5th August 2015
Abstract
A non-enzymatic electrode is proposed as a glucose sensor based on Pt-replaced Ni nanowires which are prepared by constant current electro-deposition within the anodic alumina membrane and galvanic replacement reaction. The amperometric detection of glucose shows a wide linear range up to 13.5 mM with a high sensitivity of 124.17 μA mM−1 cm−2 and a low detection limit of 32 μM (S/N = 3). More important, another attractive feature of the Pt–Ni NATs electrode is the quite low working potential at −0.35 V (versus SCE), which is favorable to avoid the influence of possible intermediates. Furthermore, the non-enzymatic glucose sensors reveal good stability and repeatability. All these excellent properties of the Pt–Ni NATs electrodes can be attributed to the large active area supported by the unique nanotube array structure.
1. Introduction
The development of effective and reliable methods for glucose detection is of great importance in the fields of clinical diagnostics, the food industry, environmental monitoring and others.1,2 Therefore, a lot of research has been devoted to prepare glucose sensors with excellent performance and among those explored glucose sensors, electrochemical glucose sensors, especially amperometric glucose sensors, have received considerable attention due to their simple, rapid, and sensitive features.3 So far, numerous enzymatic amperometric biosensors based on modification of glucose oxidase (GOx) have been proposed owing to their high sensitivity, good selectivity, low detection limit and biological specificity for their substrates.4–6 Unfortunately, they suffer from poor reproducibility and thermal and chemical instability due to the intrinsic nature of enzymes.7 To settle these problems, enzyme-free glucose sensors have been exploited as alternatives to GOx-based biosensors because of their unique properties.8–10
Platinum (Pt) is one of the most-researched noble metals in the fields of catalysts and sensors. In particular, its stability in electrochemical reactions and its prominent catalytic activity are the most attractive parameters for the fabrication of sensor devices.11 On the other hand, nickel (Ni) based materials have also been widely studied in the fabrication of enzyme-free glucose sensors owing to their attractive features, such as low cost, high stability and good electrochemical response towards oxidation of glucose.12–14 Recently, huge interest has been focused on the fabrication of one-dimensional (1-D) nanostructure arrays with readily controllable microstructure because of their potential application in many fields.15,16 Catalysts with a 1-D structure, mainly including nanowires and nanotubes, have been used extensively for biosensors due to their excellent catalytic oxidation performance. For instance, Zhu et al. found that Pd–Au nanowires could provide better sensitivity for glucose detection compared to nanoparticles.17 The enhanced properties of 1-D nanostructure arrays are attributed to their large surface-to-volume ratio which is beneficial for electron transfer. In order to control the transfer of electrons through nanowires and thereby enhance their functionality, great efforts have been made to create dense and aligned nanowire arrays.18 Among those strategies for preparing such structures, deposition of desired material into a porous nanochannel template has proved to be a simple and versatile approach. The key role of the template method is that the nanostructures prepared in this way can be diameter controllable and well defined.19,20 Furthermore, in terms of the same materials, compared to nanowires, nanotubes obtained by this method reveal better functionality for electro-oxidation of glucose owing to more catalytic active sites per unit area supported by relative larger specific surface areas.21
Up to now, electro-deposition is the most common method to fabricate nanotube array structures, such as direct electro-deposition in porous templates by adjusting deposition parameters, electro-deposition in porous templates by using pre-prepared oxide arrays or polymer as sacrificial core, and electro-deposition combined with magnetron sputtering technology.22–25 However, as far as we are concerned, there have been no reports on the preparation of nanotube arrays via a facile galvanic replacement reaction. On account of the fact that the Ni/Ni2+ (0.246 V) redox pair value is much lower than that of PtCl62−/Pt (0.735 V), Ni metal can be used as the reducing agent to replace the PtCl62− in the solution with Pt. Inspired by the fabrication of hollow mesoporous Pt–Ni nanospheres,26 we first synthesise Ni nanowires within an AAO template by the electro-deposition method and then obtain a Pt–Ni nanotube array by galvanic replacement reaction with Ni nanowires as sacrificial template. In this way, the advantageous features of metallic Pt & Ni together with the one-dimensional nanostructure array in the electrocatalytic oxidation of glucose, have been incorporated to develop a non-enzyme glucose sensor. The resulting glucose sensor based on the Pt–Ni NATs electrode provides high sensitivity, good stability, fast amperometric response and excellent anti-interference performance.
2. Experimental
2.1. Chemicals and materials
(Hydro)chloroplatinic acid (H2PtCl6·6H2O) and nickelous sulfate (NiSO4·6H2O) were purchased from the Guangfu Chemical Reagent Co Ltd of Nankai University (Tianjin, China). Uric acid (UA), ascorbic acid (AA), dopamine (DA) and glucose were purchased from Sigma Aldrich. The anodic alumina membranes (AAO template, 200 nm in pore diameter and 60 μm in thickness) were purchased from Whatman Ltd. Boric acid (H3BO3), polyethylene glycol (PEG-2000), sodium hydroxide (NaOH), potassium ferricyanide (K3[Fe(CN)6]), potassium hexacyanoferrate (K4[Fe(CN)6]) and potassium chloride (KCl) were purchased from Kewei Chemical Reagent Co Ltd of Tianjin University (Tianjin, China). All reagents were of analytical grade and used without further purification and all aqueous solutions were prepared with double distilled water. A phosphate buffer solution (PBS solution, 0.1 M, pH 7.0) prepared by Na2HPO4 and NaH2PO4 was employed as the supporting electrolyte.
2.2. Preparation of Ni nanowires
Au electrode (φ = 6 mm) was used as the substrate electrode, it was polished to a mirror-like surface with 1.0 μm, 0.3 μm, and 0.05 μm of alumina slurry in sequence then washed repeatedly with double distilled water and ethanol in an ultrasonic bath, and left to dry in air before use. A thin layer of Au film was sputtered onto one side of the anodic alumina membrane (AAO template) to make the template conductive and served as the seed layer for the growth of Ni nanowires. Then the membrane was attached gold-side-down to an Au electrode surface by silver paste and held by a rubber O-ring. Then the electrode covered by AAO template was immersed into a nickel precursor solution containing 15 g L−1 NiSO4, 30 g L−1 H3BO3 and 30 g L−1 PEG-2000 for 30 min prior to electro-deposition, so as to make the solution penetrate through the template. Afterwards, the Ni nanowires were prepared by electro-deposition with the AAO template at a constant current density of 0.5 mA cm−2 with a deposition time of 1 h.27 After deposition, the AAO template was dissolved by immersing the electrode into 1 M NaOH solution and the three-dimensional vertically aligned Ni nanowires were released from the template; the sputtered Au film can partly prevent the nanowires from collapsing after removal of the template. Then, the resulting Ni NAWs were washed with an adequate amount of double distilled water and dried in air. The as-prepared Ni nanowires were designated as Ni NAWs.
2.3. Preparation of Pt–Ni nanotube array
The Pt–Ni alloy nanotube array was synthesized via a galvanic replacement reaction by using Ni NAWs as the sacrificial template. To explain in detail, the prepared Ni NAWs electrode was immersed into 5 mL of 10 mM H2PtCl6·6H2O solution under stirring at a reaction temperature of 60 °C and high purity N2 was bubbled into the solution during this process to avoid the oxidation of Ni NAWs. Different reaction times were investigated to obtain the optimal condition of fabricating the Pt–Ni nanotube array. After completion of the reaction, the resulting products were removed from the mixture and washed repeatedly with double distilled water. Finally, the prepared products were dried at room temperature. The as-prepared Pt–Ni nanotubes arrays were designated as Pt–Ni NATs. The synthesis routes of Ni NAWs and Pt–Ni NATs are illustrated in Fig. 1.
 |
| | Fig. 1 Schematic illustration of the formation processes of the Ni NAWs and Pt–Ni NATs electrode. | |
2.4. Characterization
The morphologies of the prepared materials were examined by scanning electron microscope (SEM, LVS-4800, Japan) coupled with energy dispersive X-ray spectroscopy (EDX) and transmission electron microscopy (TEM, Tecnai-G2F20, Philips Corporation, Holland). The chemical composition and the crystal structure analysis were investigated by EDX and X-ray diffraction (XRD, Rigaku, model D/max-2500 system at 40 kV and 100 mA of Cu-Kα). All electrochemical measurements were carried out on a CHI 660E electrochemical workstation (Chenhua Instrument Shanghai Co. Ltd, China) with a conventional three-electrode system at room temperature, consisting of a bare or modified Au electrode (φ = 6 mm) as the working electrode, a saturated calomel electrode (SCE) as the reference electrode and a platinum wire as the counter electrode, respectively. Electrochemical impedance spectroscopy (EIS) was measured in 5.0 mM K3[Fe(CN)6]/K4[Fe(CN)6] (1![[thin space (1/6-em)]](https://www.rsc.org/images/entities/char_2009.gif) :1) solution supported by 0.1 M KCl solution with the frequency range from 10 mHz to 100 kHz. Electrochemical catalytic behaviours of the electrodes toward glucose were characterized by cyclic voltammetry with potential range from −0.6 V to 0.9 V (versus SCE). The current time response was obtained by an amperometric i–t curve method in neutral PBS through successive addition of glucose under stirring.
:1) solution supported by 0.1 M KCl solution with the frequency range from 10 mHz to 100 kHz. Electrochemical catalytic behaviours of the electrodes toward glucose were characterized by cyclic voltammetry with potential range from −0.6 V to 0.9 V (versus SCE). The current time response was obtained by an amperometric i–t curve method in neutral PBS through successive addition of glucose under stirring.
3. Results and discussion
3.1. Characterization of Pt-replaced Ni nanowires electrodes
As shown in Fig. 2a, the morphology of the Ni NAWs is characterized by SEM, the Ni NAWs show uniform size and are vertically oriented on the electrode surface. The average diameter of the prepared Ni NAWs is ∼250 nm, which corresponds to the size of the nanopores of the AAO template. What’s more, as can be seen in Fig. 2b, the height of nanowire is ∼2.47 μm.
 |
| | Fig. 2 SEM images of Ni nanowires (a) from the top and (b) from one side; (c) Pt-replaced Ni nanowires after a reaction time of 30 min. | |
Fig. 3 represents the SEM images of the Pt-replaced Ni nanowire electrodes after different times. Fig. 2c shows the product with a replacement time of 30 min at 60 °C compared to single Ni NAWs; a layer of nanoparticles is coated on the surface of the Ni NAWs. As the replacement time increases to 45 min, a loose nanotube structure is formed from the bottom of the nanowires while the solid nanowire structure is still maintained in the top part while the slight aggregation of nanowires decreases the contact area between the nanowires and the precursor solution. As displayed in Fig. 3b, the completely hollow nanotubes consist of many small nanoparticles, and holes in the tubular walls are obtained when the replacement time is prolonged to 1 h. It could be observed that the mean size of the nanoparticles is ∼50 nm and the average diameter of the nanotubes is ∼250 nm, which is consistent with Ni nanowires. The hollow structures are beneficial for the diffusion of substrate. Furthermore, the unique structure could relieve the irreversible agglomerates of nanoparticles and the large surface areas supported by the nanoparticles are good for the electro-oxidation reaction. The as-prepared 1 h product was designated as Pt–Ni NATs. Fig. 3c shows the morphology of the product with a reaction time of 2 h; we can observe a hill-like structure which is composed of small nanosheets with a thickness of about 50 nm. It can be seen from the EDS images that the content of Pt increases as the reaction continues, and reaches 93.45 At% in the nanosheet structures. Obviously, the aggregated structures lead to a large consumption of metal Pt, and thus increase the materials cost and induce the activity surface areas. We use the product as our comparison electrode in the following analysis and it is designated as the Pt nanosheets electrode.
 |
| | Fig. 3 SEM images and EDS images of (a) Pt-replaced Ni nanowires after 45 min; (b) Pt-replaced Ni nanowires after 1 h and (c) Pt-replaced Ni nanowires after 2 h. | |
Fig. 4a shows a TEM image of Pt–Ni NATs, an apparent hollow nanotube composed of many small nanoparticles can be seen and the diameter of the nanotube is about 250 nm which is in accordance with the SEM image (Fig. 3b). Both the rough surface and hollow tube structure provide large specific surface areas which is helpful to improve the electrochemical performance. This feature endows the catalysts with a large surface area and high accessibility to guest species. As depicted in Fig. 4b, the lattice spacing is observed to be 0.228 nm, slightly smaller than that of the (111) plane of Pt (0.23 nm), which may be due to the addition of Ni atom.22 The nanoparticles in the TEM image of Fig. 4a demonstrate a polycrystalline structure, which can be verified by the concentric diffraction rings composed of spots in the SAED (selected area electron diffraction) pattern, as shown in Fig. 4c.28
 |
| | Fig. 4 (a) TEM image (b) HR-TEM image and (c) SAED pattern of the Pt–Ni alloy nanotube. | |
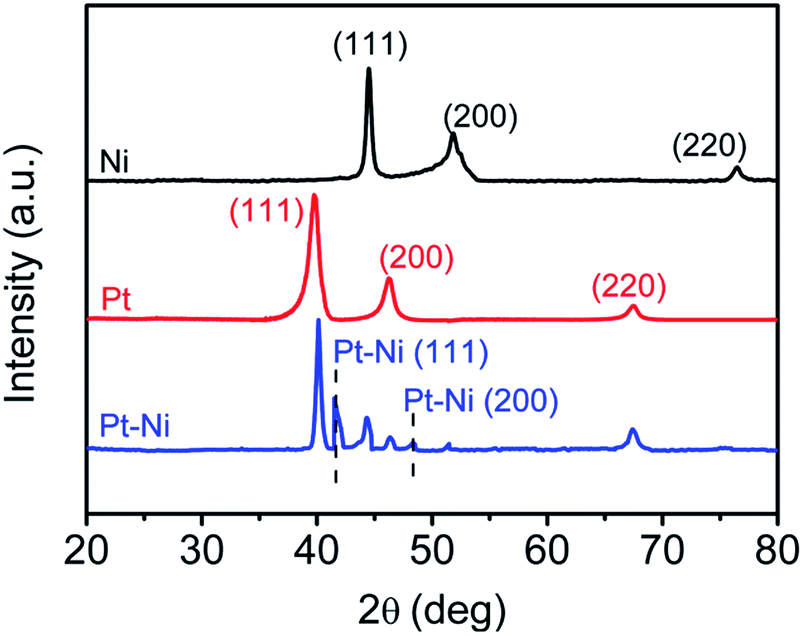
As shown in Fig. 5, the constitution of the Pt nanosheets, Ni NAWs and Pt–Ni NATs were further examined by XRD. For Pt nanosheets, the peaks at approximately 39.76°, 46.24°, 67.45° are characteristic peaks of the Pt fcc structure, corresponding to the planes (111), (200) and (220), respectively.29 For Ni NAWs, the diffraction peaks located at about 45°, 52° and 77° correspond to the (110), (200), (220) phases of the nickel phase,30 while for Pt–Ni NATs, the intensity of the Ni characteristic peaks decrease greatly. Furthermore, new small peaks appear between Pt (111) and Ni (200) which are designated as Pt–Ni (111) and Pt–Ni (200). These results indicate the formation of Pt–Ni alloy.
 |
| | Fig. 5 XRD patterns of Ni NAWs, Pt nanosheets and Pt–Ni NATs. | |
3.2. Evaluation of the electrochemical performance of the Pt–Ni NATs electrodes
Electrochemical impedance spectroscopy (EIS) is a well-known effective method for studying the impedance changes on the electrode surface during the modification process. Fig. 6a presents typical Nyquist plots of the bare Au electrode, Pt nanosheets electrode and Pt–Ni NATs electrode. Significant differences are observed from the impedance curve. The electron transfer resistance (Rct) at the electrode surface can be estimated by the diameter of the semicircle in EIS.31 For the bare Au electrode, a very small semicircle appears in the high frequency range, indicating a very low Rct to the redox probe dissolved in KCl solution. For the Pt nanosheets electrode, a large diameter semicircle can be observed at the high frequency part, which corresponds to the electron transfer limited process, followed by a linear part at low frequency attributable to a diffusion controlled process. Compared with the Pt nanosheets electrode, the Pt–Ni NATs electrode exhibits a lower Rct since a much smaller semicircle in the high frequency region and a steeper straight line in the low frequency region are observed. The results indicate that the Pt–Ni NATs electrode could act as a superior electron transfer interface between the electrode and the EIS probe, which is beneficial for improving the signals of the electrochemical oxidation reaction. The electroactive surface areas of the Pt nanosheets electrode and Pt–Ni NATs electrode were estimated by the cyclic voltammetry method by using K3[Fe(CN)6] as probe with a series of scan rates. Fig. 6b and c show the CVs of the Pt nanosheets electrode and Pt–Ni NATs electrode in 1 M KCl solution containing 5 mM K3[Fe(CN)6] and the insets are the relationships between the anodic peak current and the square root of the scan rate. For both Pt nanosheets electrode and Pt–Ni NATs electrode, the anodic peak current increases linearly with the square root of scan rate in the range of 10–90 mV s−1, indicating that the electro-oxidation of glucose at the Pt–Ni electrode is a typical diffusion-controlled process.32 The dependence of the peak current on the square root of the scan rate is described by the Randles–Sevcik equation:
| Ip = 0.4463(F3/RT)1/2n3/2AD01/2C0ν1/2 |
where n represents the number of electrons participating in the redox reaction, ν is the scan rate (V s−1), A is the electroactive area of the electrode (cm2), D0 is the diffusion coefficient of 5 mM K3[Fe(CN)6] in 1 M KCl (6.5 × 10⁻⁶ cm2 s−1), C0 is the concentration of the probe molecule in the bulk solution (mol cm−3), and Ip is the redox peak current (A). The linear regression equations between the anodic peak current versus the scan rate square for the Pt nanosheets electrode and Pt–Ni NATs electrode are I (mA) = 0.1832ν1/2 (V s−1) − 0.0751 (R2 = 0.9941) and I (mA) = 0.7986ν1/2 (V s−1) − 0.0394 (R2 = 0.9963), respectively. From this equation, the electroactive surface area of the Pt–Ni NATs electrode is calculated to be 4.36 times as large as the Pt nanosheets electrode.31
 |
| | Fig. 6 (a) EIS curves of bare Au electrode, Pt nanosheets electrode and Pt–Ni NATs electrode; CV responses of Pt nanosheets electrode (b) and Pt–Ni NATs electrode (c) at various scan rates from 10 to 90 mV s−1 in 1 M KCl solution containing 5 mM K3[Fe(CN)6], inset: plot of the oxidation peak current vs. square root of scan rate. | |
3.3. Glucose oxidation at the Pt–Ni NATs electrode
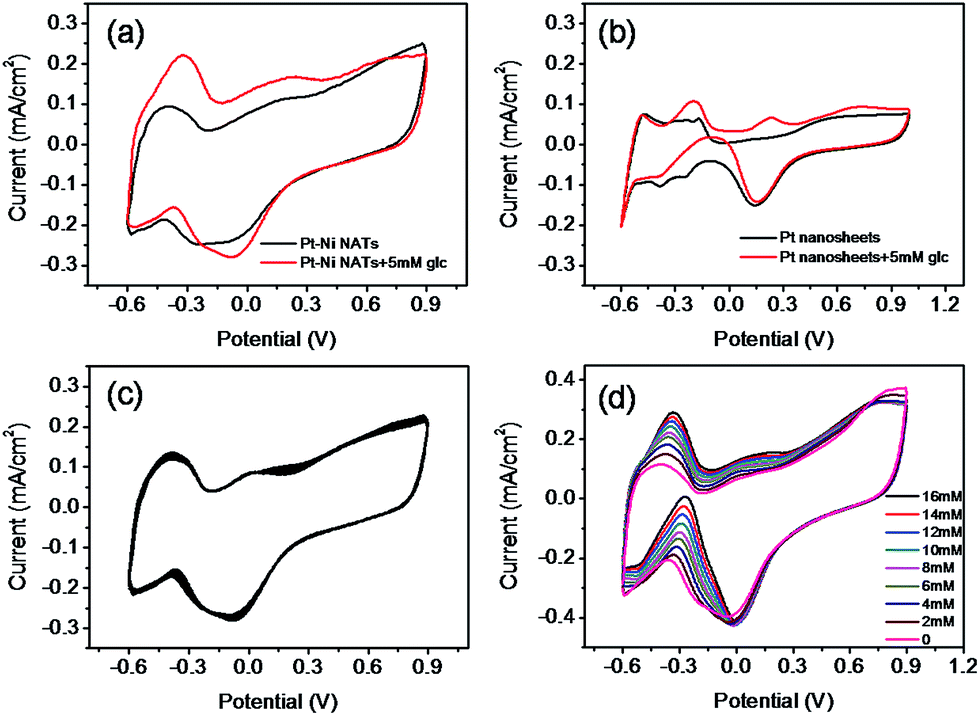
The electrocatalytic activity of the Pt nanosheets electrode and the Pt–Ni NATs electrode toward the oxidation of glucose is studied by the CV technique. Fig. 7a and b shows the CVs of the Pt nanosheets electrode and the Pt–Ni NATs electrode in the absence and presence of 5 mM glucose in 0.1 M PBS solution with a sweep rate of 50 mV s−1, respectively. For the Pt nanosheets electrode in the presence of 5 mM glucose, redox peaks with anodic peaks and cathodic peak at −0.2 V, +0.23 V and +0.15 V can be observed. For the Pt–Ni NATs electrode, a pair of well-defined redox peaks with anodic peaks and cathodic peak be observed at −0.35 V, +0.15 V and −0.1 V, respectively. The anodic peak at −0.35 V is ascribed to the formation and adsorption of intermediate compounds, while the anodic peak located at +0.15 V is caused by the direct oxidation of glucose in the anodic direction and the cathodic peak at −0.1 V is assigned to the direct oxidation of glucose in the cathodic direction.33 Compared with the Pt nanosheets electrode, the potential of redox peaks in the Pt–Ni NATs electrode shift to the negative directions, which may be caused by the addition of Ni atoms. According to related reports, the low potential is beneficial for enhancing anti-interference of the sensor.34 Furthermore, the larger background current in the Pt–Ni NATs electrode CV curves indicates higher electrochemical sensitivity.35 The above results suggest that the Pt–Ni NATs electrode has better electrocatalytic activity on glucose oxidation than the Pt nanosheets electrode, which is due to the large electrochemical active area of the Pt–Ni NATs electrode.
 |
| | Fig. 7 CV curves of the (a) Pt–Ni NATs electrodes and (b) Pt nanosheets electrode in the absence and presence of 5 mM glucose in 0.1 M PBS solution with a scan rate of 50 mV s−1; (c) 30 consecutive cycles of the Pt–Ni NATs electrode CV curves in 0.1 M PBS under a scan rate of 50 mV s−1; (d) CV response of the Pt–Ni NATs electrode for a series of glucose concentrations in 0.1 M PBS solution under a scan rate of 50 mV s−1. | |
In addition, the stability for the Pt–Ni NATs electrode after activation is also examined by recording 30 consecutive CV curves between −0.6 V and 0.9 V in 0.1 M PBS containing 3 mM glucose at the scan rate of 50 mV s−1 (Fig. 7c). No obvious peak current change is observed, which demonstrates that the electrode is electrochemically stable through the oxidation and reduction reactions.36 What’s more, the electrocatalytic activity of the Pt–Ni NATs electrode towards the oxidation of glucose with different concentrations in PBS solution was also investigated. Fig. 7d reveals the CV curves recorded at 50 mV s−1 with the glucose concentration ranging from 0 to 16 mM.
Obviously, the anodic current in the potential window of −0.6 to 0.9 V increases with addition of glucose concentration. The results confirm the feasibility of using the Pt–Ni NATs electrode as a glucose sensor.
3.4. Amperometric detection of glucose
In order to obtain the preferable potential of the Pt–Ni NATs electrode as a glucose sensor, experiments under different applied potentials were investigated. −0.4 V, −0.35 V, −0.3 V, −0.25 V are taken as the changed potentials with successive addition of 0.5 mM glucose into 0.1 M PBS solution to obtain different sensitivities via the amperometric i–t curve technology, and the results are presented in Fig. 8a. We can easily find that −0.35 V reveals the best performance, hence it is chosen as the detection potential in the following measurements.24 Fig. 8b shows a typical current–time response for the Pt–Ni NATs electrode with successive addition of glucose into constantly stirred PBS solutions at −0.35 V. From the stepwise shape curve we can observe that the current increases immediately with every addition of glucose and it quickly reaches a steady state. As shown in Fig. 8c, the Pt–Ni NATs electrode presents an excellent linear current concentration relationship at a low glucose concentration ranging from 6 μM to 980 μM. Fig. 8d reveals the plot of the relationship between the current response and the corresponding concentrations of injected glucose; the fitting linear regression equation is I (mA) = 0.03509c (mM) + 0.10094 (R2 = 0.9989). The Pt–Ni NATs electrode shows a linear detection range up to 13.5 mM with a detection limit of 32 μM (S/N = 3) and a sensitivity as high as 124.17 μA mM−1 cm−2. The detection range covers the normal glucose level in blood (3–8 mM). What’s more, the response time of the Pt–Ni NATs sensor is as short as 3.5 s (reaching 95% of the steady state current). The desirable performance may be attributed to the nanotube structure and sufficient active sites of Pt–Ni NATs. The former makes the diffusion during the catalytic process easier as well as relieving the agglomeration of nanoparticles, and the latter ensures that the analyte is oxidised effectively. Compared with other non-enzyme sensors based on Pt-related materials, as listed in Table 1, the as-synthesized Pt–Ni NATs sensor offer a quite low working potential and high sensitivity.
 |
| | Fig. 8 (a) Amperometric response of the Pt–Ni NATs electrodes on the addition of 0.5 mM glucose solution at different potentials; amperometric response of the Pt–Ni NATs electrode (b) upon successive addition of 1 mM glucose at −0.35 V vs. SCE under stirring (c) in a low glucose concentration ranging from 6 μM to 980 μM; (d) relationship between the obtained steady-state current and the glucose concentration (S/N = 3), inset of bottom right: response time towards glucose of the Pt–Ni NATs electrode. | |
Table 1 Comparison of the analytical performance of reported glucose sensors based on Pt-related materials
| Electrode materials |
Linear range/mM |
Sensitivity/μA mM−1 cm−1 |
Detection limit/μM |
Applied potential/V |
Reference |
| Pt–Pb nanowires |
Up to 11 |
11.25 |
8 |
−0.2 |
15 |
| Pt–Ni nanowires |
2–14 |
920 |
0.1 |
+0.45 |
16 |
| Pt–Pd nanotubes arrays |
Up to 10 |
41.5 |
— |
+0.2 |
21 |
| Pt nanotubes |
2–14 |
0.1 |
1 |
+0.4 |
22 |
| Pt nanoflowers |
1–16 |
1.87 |
48 |
+0.03 |
29 |
| Pt–Ni–RGO hollow nanospheres |
0.5–20 |
30.3 |
2 |
−0.35 |
34 |
| Pt-replaced porous Cu frameworks |
1–11 |
9.62 |
385 |
+0.4 |
37 |
| Pt/MCNT |
Up to 12 |
280 |
0.2 |
+0.5 |
38 |
| This work |
Up to 13.5 |
124.17 |
32 |
−0.35 |
— |
3.5. Selectivity and stability
As we all know, some active interferents may generate electrochemical signals at the applied potential of glucose detection, thus the influence of the interferents must be taken into consideration. The most common species of interferents which may be oxidized on the electrode include ascorbic acid (AA), dopamine (DA) and uric acid (UA). Therefore, we examined the current response of AA, DA and UA on the prepared Pt–Ni NATs electrode by i–t curve technology at −0.35 V. As displayed in Fig. 9a, the addition of 0.1 mM AA, DA and UA hardly has any amperometric response, while the addition of 0.5 mM glucose has an obvious current response. These results indicate that these interferents have almost no effect on the determination of glucose, which demonstrates the Pt–Ni NATs electrode can be employed to determine glucose selectively.39,40 This attractive anti-interference performance of the proposed sensor is possibly related to the quite low applied potential.34
 |
| | Fig. 9 (a) Effect of interferents containing 0.1 mM AA, 0.1 mM UA and 0.1 mM DA on the response of the Pt–Ni NATs electrode in the presence of 0.5 mM glucose at −0.35 V; the reusability (b), and stability (c) of the Pt–Ni NATs electrodes. | |
Additionally, the reproducibility and the long-term stability of the fabricated glucose sensors are investigated. As shown in Fig. 9b, five successive amperometric measurements of the same electrode for 2 mM glucose display a good reproducibility with an RSD (relative standard deviation) of 2.52%. Long-term stability of the fabricated sensor is also very important for better practical application. When the electrodes are not in use, they are stored in PBS solution at low temperature. The stability of the developed glucose sensor is evaluated by recording the current response of Pt–Ni NATs electrode to 2 mM glucose at a interval of three days over a period of 30 days (Fig. 9c). The electrode maintains ∼93.5% of its initial activity after one month, demonstrating that the as-prepared electrode could be used for a relatively long time. The excellent reproducibility and stability performances of Pt–Ni NATs electrode are mainly due to the good stability of metal Pt and the stable three-dimensional hollow nanotubes structure.
4. Conclusions
The Pt–Ni NATs electrode is fabricated as a glucose sensor by galvanic replacement reaction with Ni nanowires as sacrificial template. The ordered hollow nanotubes array structure and the large surface areas enable the electrode to have an effective substrate transport system and adequate active sites for electro-oxidation of glucose, which endow the electrode with high sensitivity as a glucose sensor. Furthermore, the chemical stability and excellent conductivity of metal Pt also afford a series of outstanding characteristics, including good stability, reproducibility and anti-interference. The simply prepared electrodes develop a new method in the fabrication of non-enzymatic glucose sensors.
Acknowledgements
This work was financially supported by the National Natural Science Foundation of China (no. 51143009 and 51273145).
Notes and references
- C. R. Lowe, M. C. Lee, S. Kabilan, A. Hussain, X. Yang and J. Blyth, Anal. Chem., 2004, 76, 5748 CrossRef PubMed.
- J. D. Newman and A. P. Turner, Biosens. Bioelectron., 2005, 20, 2435 CrossRef CAS PubMed.
- B. Zheng, G. Liu, A. Yao and Y. Xiao, Sens. Actuators, B, 2014, 195, 431 CrossRef CAS PubMed.
- L. Pan, G. Yu, D. Zhai, H. R. Lee, W. Zhao, N. Liu and H. Wang, Proc. Natl. Acad. Sci. U. S. A., 2012, 109, 9287 CrossRef CAS PubMed.
- B. Fang, C. Zhang, G. Wang, M. Wang and Y. Ji, Sens. Actuators, B, 2011, 155, 304 CrossRef CAS PubMed.
- L. Niu, C. Shan, H. Yang, D. Han, Q. Zhang and A. Ivaska, Biosens. Bioelectron., 2010, 25, 1070 CrossRef PubMed.
- I. Katakis and E. Dominguez, TrAC, Trends Anal. Chem., 1995, 17, 310 Search PubMed.
- S. Park, H. Boo and T. D. Chung, Anal. Chim. Acta, 2006, 556, 46 CrossRef CAS PubMed.
- Y. Mu, D. Jia, Y. He, Y. Miao and H. Wu, Biosens. Bioelectron., 2011, 26, 2948 CrossRef CAS PubMed.
- J. Luo, S. Jiang, H. Zhang, J. Jiang and X. Liu, Anal. Chim. Acta, 2012, 709, 47 CrossRef CAS PubMed.
- S. Park, T. D. Chung and H. C. Kim, Anal. Chem., 2003, 75, 3046 CrossRef CAS.
- P. Lu, J. Yu, Y. Lei, S. Lu and Q. Guo, Sens. Actuators, B, 2015, 208, 90 CrossRef CAS PubMed.
- F. Miao, B. Tao and P. K. Chu, Microelectron. Eng., 2015, 133, 11 CrossRef CAS PubMed.
- L. M. Lu, L. Zhang, F. L. Qu, H. X. Lu and R. Q. Yu, Biosens. Bioelectron., 2009, 25, 218 CrossRef CAS PubMed.
- Y. Bai, Y. Sun and C. Sun, Biosens. Bioelectron., 2008, 24, 579 CrossRef CAS PubMed.
- S. S. Mahshid, A. Dolati, M. Ghorbani and Q. Cai, Electrochim. Acta, 2011, 58, 551 CrossRef CAS PubMed.
- C. Zhu, S. Guo and S. Dong, Adv. Mater., 2012, 24, 2326 CrossRef CAS PubMed.
- M. Jamal, M. Hasan, A. Mathewson and K. M. Razeeb, Biosens. Bioelectron., 2013, 40, 213 CrossRef CAS PubMed.
- M. Yang, F. Qu, Y. Lu, Y. He, G. Shen and R. Yu, Biomaterials, 2006, 27, 5944 CrossRef CAS PubMed.
- G. Sauer, G. Brehm and S. Schneider, J. Appl. Phys., 2002, 91, 3243 CrossRef CAS PubMed.
- Y. Li, X. Niu, J. Tang, M. Lan and H. Zhao, Electrochim. Acta, 2014, 130, 1 CrossRef CAS PubMed.
- J. Yuan, K. Wang and X. Xia, Adv. Funct. Mater., 2005, 15, 803 CrossRef CAS PubMed.
- W. R. Hendren, A. Murphy, P. Evans, G. A. Wurtz and R. J. Pollard, J. Phys.: Condens. Matter, 2008, 20, 362203 CrossRef.
- L. X. Ding, A. L. Wang, G. R. Li, Z. Q. Liu, W. X. Zhao, C. Y. Su and Y. X. Tong, J. Am. Chem. Soc., 2012, 134, 5730 CrossRef CAS PubMed.
- H. Wang, C. Xu, F. Cheng, M. Zhang, S. Wang and S. P. Jiang, Electrochem. Commun., 2008, 10, 1575 CrossRef CAS PubMed.
- Y. Hu, Q. Shao, P. Wu and C. Cai, Electrochem. Commun., 2012, 18, 96 CrossRef CAS PubMed.
- B. Hamrakulov, I. S. Kim, M. G. Lee and B. H. Park, Trans. Nonferrous Met. Soc. China, 2009, 19, s83 CrossRef CAS.
- L. Tian, X. Zhong, W. Hu, B. Liu and Y. Li, Nanoscale Res. Lett., 2014, 9, 68 CrossRef PubMed.
- M. Q. Guo, H. S. Hong, X. N. Tang, H. D. Fang and X. H. Xu, Electrochim. Acta, 2012, 63, 1 CrossRef CAS PubMed.
- M. Jamal, M. Hasan, M. Schmidt, N. Petkov and K. M. Razeeb, J. Electrochem. Soc., 2013, 160, B207 CrossRef CAS PubMed.
- M. Q. Guo, R. Wang and X. H. Xu, Mater. Sci. Eng., C, 2011, 31, 1700 CrossRef CAS PubMed.
- A. S. Baranski, T. Krogulec, L. J. Nelson and P. Norouzi, Anal. Chem., 1998, 70, 2895 CrossRef CAS.
- S. Cherevko and C. H. Chung, Sens. Actuators, B, 2009, 142, 216 CrossRef CAS PubMed.
- Y. Hu, F. He, A. Ben and C. Chen, J. Electroanal. Chem., 2014, 726, 55 CrossRef CAS PubMed.
- H. Gao, F. Xiao, C. B. Ching and H. Duan, ACS Appl. Mater. Interfaces, 2011, 3, 3049 CAS.
- L. Zhang, C. Yang, G. Zhao, J. Mu and Y. Wang, Sens. Actuators, B, 2015, 210, 190 CrossRef CAS PubMed.
- Y. Hu, X. Niu, H. Zhao, J. Tang and M. Lan, Electrochim. Acta, 2015, 165, 383 CrossRef CAS PubMed.
- Y. Myung, D. M. Jang, Y. J. Cho, H. S. Kim and J. Park, J. Phys. Chem. C, 2009, 113, 1251 CAS.
- H. Li, C. Y. Guo and C. L. Xu, Biosens. Bioelectron., 2015, 63, 339 CrossRef CAS PubMed.
- J. Zhang, J. Ma, S. Zhang, W. Wang and Z. Chen, Sens. Actuators, B, 2015, 211, 385 CrossRef CAS PubMed.
|
| This journal is © The Royal Society of Chemistry 2015 |
Click here to see how this site uses Cookies. View our privacy policy here.