 Open Access Article
Charge carrier dynamics and photocatalytic behavior of TiO2 nanopowders submitted to hydrothermal or conventional heat treatment†
A. O. T.
Patrocinio
*a,
J.
Schneider
b,
M. D.
França
a,
L. M.
Santos
a,
B. P.
Caixeta
a,
A. E. H.
Machado
a and
D. W.
Bahnemann
bc
aLaboratory of Photochemistry and Materials Science, Institute of Chemistry, Universidade Federal de Uberlandia, Uberlandia, 38400-902, Brazil. E-mail: otaviopatrocinio@iqufu.ufu.br
bInstitut für Technische Chemie, Leibniz Universität Hannover, Callinstrasse 3, D-30167, Hannover, Germany
cLaboratory for Nanocomposite Materials, Department of Photonics, Faculty of Physics, Saint-Petersburg State University, Ulianovskaia str. 3, Peterhof, Saint-Petersburg, 198504, Russia
First published on 12th August 2015
Abstract
The sol–gel technique followed by conventional (TiO2-1) and hydrothermal (TiO2-2) thermal treatment was employed to prepare TiO2-based photocatalysts with distinct particle sizes and crystalline structures. The as prepared metal oxides were evaluated as photocatalysts for gaseous HCHO degradation, methanol, and dye oxidation reactions. Additionally, metallic platinum was deposited on the TiO2 surfaces and H2 evolution measurements were performed. The photocatalytic activities were rationalized in terms of morphologic parameters along with the electron/hole dynamics obtained from transient absorption spectroscopy (TAS). TiO2-2 exhibits smaller particle size, poorer crystallinity, and higher surface area than TiO2-1. Moreover the hydrothermal treatment leads to formation of the metastable brookite phase, while TiO2-1 exhibits only the anatase phase. TAS measurements show that the electron/hole recombination of TiO2-2 is faster than that of the latter. Despite that, TiO2-2 exhibits higher photonic efficiencies for photocatalytic oxidation reactions, which is attributed to its larger surface area that compensates for the decrease of the surface charge carrier concentration. For H2 evolution, it was found that the surface area has only a minor effect and the photocatalyst performance is controlled by the efficiency of the electron transfer to the platinum islands. This process is facilitated by the higher crystallinity of TiO2-1, which exhibits higher photonic efficiency for H2 evolution than that observed for TiO2-2. The results found here provide new insights into the correlations between thermal treatment conditions and photocatalytic activity and will be useful for the design of high performance photocatalysts.
Introduction
The research in renewable energy sources is intense due to concerns about global warming and other environmental issues related to the huge dependence of the global energy matrix on fossil fuels.1–3 Photocatalysis receives particular attention, due to the possibility of harvesting the abundant solar energy and converting it into fuels, such as hydrogen.4–6TiO2-based materials are the most intensely investigated photocatalytic systems following the breakthrough by Fujishima and Honda.7 They exhibit chemical stability, nontoxicity, high reactivity, and can be prepared in different forms and sizes with highly ordered porosity and crystallinity.8–10 Typically, the oxide is prepared from a molecular precursor, followed by a thermal treatment to ensure crystallinity. Conventional heating at atmospheric pressure as well as the use of pressurized hydrothermal reactors are the most popular thermal treatments employed.11–15
Through the use of molecular engineering, the main limitations of TiO2 have been superposed. For example, visible light activity has been obtained by the introduction of dopants16–20 or by the formation of nanocomposites.21–24 Moreover, H2 evolution without the necessity of an external bias has been observed in the presence of co-catalysts on the oxide surface.25–28
In parallel to the advances of material preparation, large research efforts have been devoted to investigations of well-defined photocatalytic reaction systems and their detailed reaction mechanisms and kinetics using a variety of spectroscopic techniques.29–37 Particularly, the use of time-resolved methods, such as transient absorption spectroscopy (TAS)38–41 and microwave conductivity measurements (TRMC)42,43 has allowed to enhance the fundamental understanding of electron/hole trapping and recombination, with the latter being recognized as the limiting step of the photocatalytic process.44
Despite the remarkable progress, it is not an easy task to establish clear relationships between the photocatalytic properties and the metal oxide's morphological and electronic properties. Serpone45 and Zhang,46 among others47,48 have investigated the role of particle size on charge carrier dynamics and photocatalytic activity with the results of these studies being not always similar. More recently, Carneiro and co-workers described the dependence of the methylene blue degradation rate on the concentration of hydroxyl groups and holes at the TiO2 surface along with their correlations with the particle size.43
In this work, two different TiO2-based photocatalysts were prepared by the sol–gel technique, which allows an easy control of the particle size. The as prepared TiO2 particles were submitted to a conventional thermal treatment at 400 °C in an oven and also to a hydrothermal reactor (200 °C, 12.4 bar), yielding different crystalline phases, surface defects, etc. The samples were fully characterized and evaluated by several photocatalytic oxidation tests and also for H2 evolution, with the aim to provide new insights into the underlying structure–reactivity relationship. The observed photonic efficiencies were rationalized in terms of the morphological properties of TiO2-based photocatalysts and the photogenerated charge carrier dynamics studied by nanosecond transient absorption spectroscopy.
Experimental
Materials
All chemicals were of analytical or HPLC grade and were used as received. TiO2 photocatalysts were prepared through the hydrolysis of Ti(IV) isopropoxide (Aldrich, 97%). 5 cm3 of the alkoxide were dissolved in 30 mL of isopropanol under argon atmosphere. The precursor solution was cooled in an ice bath and, under vigorous stirring, 50 cm3 of deionized water were slowly added dropwise to yield a white precipitate. The photocatalyst 1 (TiO2-1) was obtained by stirring the mixture for thirty minutes at low temperature. The resulting powder was separated by centrifugation (6000 rpm, 20 minutes), washed with deionized water and thermally treated at 400 °C for 6 hours in a conventional oven. The photocatalyst 2 (TiO2-2) was obtained by stirring the hydrolysed precursor solution for 12 hours at room temperature. The white powder was separated by centrifugation (6000 rpm, 20 minutes) and washed with deionized water to eliminate any residual alcohol. The powder was subsequently suspended in 100 mL of water and transferred to a stainless steel reactor, which was heated at 200 °C for 8 hours at 12.4 bar. Afterwards, the photocatalyst was separated by centrifugation and dried at 70 °C for 24 h.Deposition of metallic platinum on the TiO2 surfaces (0.5 wt%) was carried out as described elsewhere.49,50 Briefly, 50 mg of the photocatalyst were suspended in 50 cm3 of 10% (v/v) aqueous methanol solution in a borosilicate reactor. After purging the suspension with N2, 130 μL of a 0.1 mol L−1 H2PtCl6 aqueous solution was added and the system was exposed to UV-A light (Philips 90 W Hg lamps, 1 mW cm−2) for 8 hours. The resulting pale gray powders were separated by centrifugation and dried at 70 °C under reduced pressure.
Characterization
The powders were characterized by X-ray diffraction analysis (XRD) using an XRD600 powder diffractometer (Shimadzu) operating at 40 kV and 30 mA employing Cu Kα radiation. The diffractograms were collected between 20 to 90° at 0.5° min−1. Scanning transmission electron microscopy (STEM) images were obtained in a FEI Inspect F50 located at the Brazilian Nanotechnology National Laboratory (LNNano) and operated at 30 kV. N2 adsorption–desorption isotherms were obtained in an ASAP 2020 analyzer (Micrometrics). The sorption data were analyzed using the Barrett–Joyner–Halenda (BJH) model. Diffuse reflectance measurements were carried out in an UV-1650PC spectrometer (Shimadzu) with the band gap energy being estimated by the Tauc method.51Transient absorption spectroscopy (TAS) was carried out employing a LKS80 nanosecond laser flash photolysis spectrometer (Applied Photophysics) equipped with the proper diffuse reflectance accessory. The samples were excited in a quartz cuvette by a LPX 200 excimer laser (XeF; λexc = 351 nm; 14 mJ per pulse) from Lambda Physics. The transient signals were collected by a PMT connected to a computer interfaced to a DSO9064A oscilloscope (Agilent). The data points were converted to absorbance values according to eqn (1), where A = absorbance; I0 = analyzing light level; Ir = light reflected by the absorbing sample; Ia = light absorbed by the absorbing sample. In these experiments, the samples were employed as dry powders.
 | (1) |
Photocatalytic studies
The photocatalytic activity of the as prepared TiO2 powders was evaluated by different methods and compared to the activity of the well-known photocatalyst Evonik Degussa Aeroxide TiO2 P25 (TiO2–P25). Acetaldehyde photo-oxidation was carried out accordingly to the ISO 22197-2 standard method52 in an experimental setup described previously.21,53 The active area of the samples was 15 cm2. All samples were cleaned under UV-irradiation (10 W m−2, 365 nm) prior the experiments. The gaseous reaction mixture was prepared by mixing streams of dry air (500 mL min−1), wet air (500 mL min−1, relative humidity of 50%), and 10% of a CH3CHO/N2 mixture (approximately 50 mL min−1) to obtain a final CH3CHO concentration of 1 ppm at 297 K. Prior to the photocatalytic tests, the photoreactor was purged with the CH3CHO/water vapor/air mixture without illumination until a steady CH3CHO concentration was achieved at the reactor outlet. Afterwards, the sample was irradiated for approximately 120 min.For methanol photo-oxidation, 50 mg of TiO2 were suspended in 3.0 × 10⁻² mol L−1 aqueous methanol solution placed in a round borosilicate reactor. The system was irradiated using UV-A light (3.04 × 10⁻⁷ Einstein s−1). The amount of formaldehyde produced at different time intervals was determined by the Nash method.49,54,55 The photonic efficiency values (ξ), being defined as the ratio of CH3CHO degradation or HCHO formation rate and the incident photon flux, were calculated as previously described.53,56
The activity of the TiO2 samples was also evaluated through UV-A degradation of the azo-dye Ponceau-4R (P4R) or trisodium (8Z)-7-oxo-8-[(4-sulphonatonaphthalen-1-yl)hydrazinylidene]naphthalene-1,3-disulphonate. Detailed description of the experimental setup can be found elsewhere.57 The photon flux in the range between 300 and 815 nm was (3 ± 1) × 10−6 Einstein s−1 as determined by a radiometric/photometric setup described previously.58 The degradation rate was evaluated by Total Organic Carbon measurements (TOC) carried out in a Shimadzu TOC-VCPH Analyzer. Control experiments were taken in the absence of any photocatalyst to evidence the role of the TiO2 on the photochemical reaction.
Platinized samples were employed for hydrogen evolution measurements using the experimental setup described previously.25 Briefly, the TiO2 photocatalysts were suspended in 50 mL of 10% (v/v) aqueous methanol solution placed in a double jacket quartz reactor. The system was connected to a quadrupole mass spectrometer (QMS) for gas analysis (Hiden HPR-20) and purged with argon until no traces of O2 and N2 could be observed. UV-A irradiation was performed using a 150 W Xe lamp. The photon flux was 1.90 × 10⁻⁶ Einstein s−1.
Results
Electronic and morphological characterization
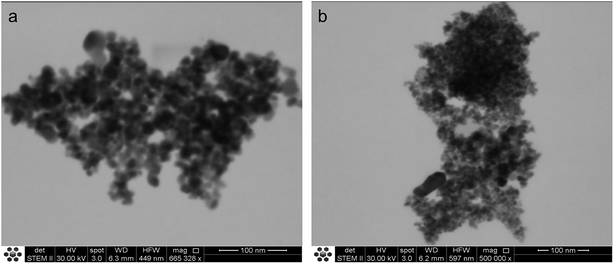
The two TiO2-based photocatalysts are constituted of agglomerates of spherical nanoparticles, as visualized in the respective STEM images (Fig. 1). The particle sizes estimated from these images are (25 ± 2) nm and (12 ± 3) nm, respectively, for TiO2-1 and TiO2-2.XRD analyses of the powders, Fig. 2, show that TiO2-1 is constituted only by the anatase polymorph, while TiO2-2 exhibits peaks characteristic of anatase and brookite. Rietveld refinement of the XRD data (see Table S1 and Fig. S1–S3 in the ESI†) reveals that the brookite content is approximately 45%. The appearance of the brookite phase in the TiO2 samples prepared by the hydrothermal method agrees with previous studies carried out by Isley and Penn,59 as well as by other authors.60,61 This photocatalyst also exhibits broader diffraction peaks as compared with TiO2-1 and the commercial sample (P25), which is in agreement to the smaller particle size observed in the STEM images. Crystallite sizes calculated by the Scherrer equation were 18 nm and 10 nm, respectively, for TiO2-1 and TiO2-2, similar to the values found by electron microscopy. Moreover, the lattice parameters obtained for TiO2-2 (Table S1†) indicate a more distorted structure in relation to TiO2-1 or TiO2–P25, especially in the c axis.
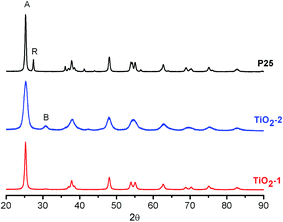 | ||
| Fig. 2 XRD patterns of TiO2 photocatalysts. The peaks marked as A, R, and B, refer to the main diffraction peaks of anatase, rutile and brookite, respectively. | ||
As expected, both photocatalysts exhibit absorption only in the UV region with an optical bandgap of 3.2 eV, similar to the values reported for TiO2 anatase.62 Diffuse reflectance spectra of the as prepared powders can be found in the ESI (Fig. S4†).
The samples were also characterized by N2-adsorption/desorption isotherms using the B.E.T. method (Fig. S5†). Type IV sorption curves were observed, according to the IUPAC classification,63 which are characteristic of mesoporous materials. The surface areas calculated for the samples were 66 and 164 m2 g−1, respectively, for TiO2-1 and TiO2-2. In addition to the higher surface area, the photocatalyst prepared via hydrothermal treatment also exhibits greater porosity, 27%, as compared with 15%, for TiO2-1.
The morphological characterization of the as synthesized photocatalysts confirmed the expected differences between samples thermally treated in a hydrothermal reactor at relatively low temperature and those treated in a conventional oven. TiO2-2 exhibits smaller particle size and higher surface area, since it was treated at low temperatures thus avoiding grain boundaries. Another consequence of the hydrothermal treatment at 200 °C is the smaller crystallinity of TiO2-2 in relation to TiO2-1, which was sintered at 400 °C and exhibited only anatase XRD patterns, with no signal from the metastable brookite phase.
Photocatalytic activity
The effectiveness of the TiO2 samples as photocatalysts was evaluated comparing the efficiency of the oxidation of a dye (Ponceau 4R), gaseous acetaldehyde, and methanol, and also the photocatalytic hydrogen evolution through the dehydrogenation of methanol, using platinum as co-catalyst. A summary of the observed rates and the respective photonic efficiencies is presented in Table 1 along with the main morphological data.| Sample | S BET (m2 g−1) | Particle diameter (nm) | Dye degradation | Gaseous CH3CHO degradation | MeOH oxidation | H2 evolution | |||
|---|---|---|---|---|---|---|---|---|---|
| C/C0 (%) | Ratea × 10−4 | ξ (%) | Rateb | ξ (%) | Rateb | ξ (%) | |||
| a In μmol s−1. b In μmol L−1 s−1 g−1. | |||||||||
| P25 | 42 | 30 ± 2 | 82 | 3.3 | 5.5 | 5.0 | 8.3 | ||
| TiO2-1 | 66 | 25 ± 2 | 33 | 2.0 | 3.4 | 4.8 | 7.9 | ||
| TiO2-2 | 164 | 12 ± 3 | 75 | 2.4 | 4.0 | 6.4 | 10.6 | ||
| P25–Pt | 5.2 | 8.5 | 0.15 | 7.7 | |||||
| TiO2-1–Pt | 5.2 | 8.5 | 0.11 | 5.6 | |||||
| TiO2-2–Pt | 3.5 | 5.8 | 0.10 | 5.0 | |||||
In Fig. 3, the time profile of the gaseous CH3CHO photodegradation is shown using the two photocatalysts prepared here in comparison to the commercial titanium dioxide P25. Apparently, the commercial photocatalyst exhibits a higher efficiency as compared with both samples prepared by the sol–gel method. Among the synthesized powders, TiO2-2 exhibits the best performance. The same trend is observed for the degradation of the Pounceau 4R dye (time profile TOC curves for the different photocatalysts can be found in the ESI, Fig. S6†).
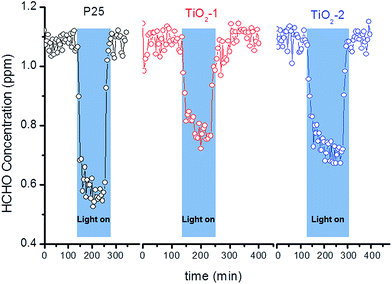 | ||
| Fig. 3 Time profiles of the CH3CHO photodegradation upon UV(A) irradiation (1 mW cm−2) in the presence of different TiO2-based photocatalysts. | ||
For the photocatalytic methanol oxidation, the performance of bare TiO2-2 is higher than that observed for the commercial oxide and approx. 35% better than that observed when using TiO2-1, Fig. 4. Interestingly, after platinization, the photocatalytic activity of TiO2-2 decays by 50%, while for TiO2-1 and P25, the photonic efficiencies increase by 7.5% and 2.4%, respectively.
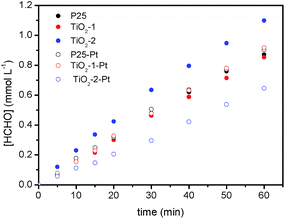 | ||
| Fig. 4 Time evolution of the HCHO concentration as a result of the photocatalytic methanol oxidation under UV(A) irradiation (1 mW cm−2) in the presence of bare and platinized TiO2 photocatalysts. | ||
The time profiles of the photocatalytic hydrogen evolution obtained by mass spectrometry are shown in Fig. 5. For both samples, one can observe a fast increase of the H2 production rate after the light is turned on. Then, the H2 evolution rate reaches a plateau and remains almost constant until the irradiation is turned off. The slight decrease on H2 evolution rate over time is likely related to the decrease of the sacrificial agent concentration. The photocatalytic production of hydrogen follows the same trend as that observed for the methanol oxidation, with TiO2-1–Pt exhibiting a higher performance than TiO2-2–Pt. It is worthwhile to note that the efficiency of TiO2-2 decreases after Pt deposition.
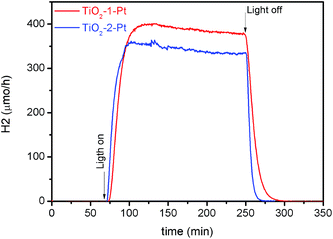 | ||
Fig. 5 Time profile for the H2 evolution rate from 10% (v/v) aqueous methanol solution upon UV(A) irradiation in the presence of the platinized TiO2-1 ( ) and TiO2-2 ( ) and TiO2-2 ( ) photocatalysts. ) photocatalysts. | ||
Time-resolved absorption spectroscopy (TAS)
In order to better understand the role of morphological parameters and thermal treatment conditions on the photocatalytic performance of the TiO2 photocatalysts, the reaction dynamics of the photogenerated charge carriers were investigated by means of nanosecond TAS, employing bare and platinized samples. In TAS measurements carried out at the nanosecond time domain, the absorption signatures originate from trapped electrons and holes, since free charge carriers tend to recombine (or be trapped) at the picosecond time scale.4 Typical transient absorption spectra obtained under N2 atmosphere for the TiO2 photocatalysts prepared here are shown in Fig. 6.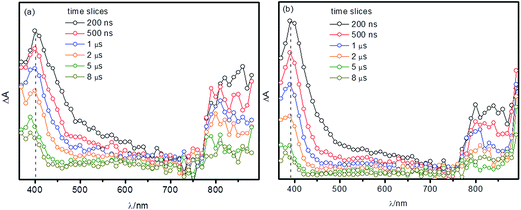 | ||
| Fig. 6 Transient absorption spectra measured for TiO2-1 (a) and TiO2-2 (b) under N2 atmosphere at different time scales following the laser pulse. | ||
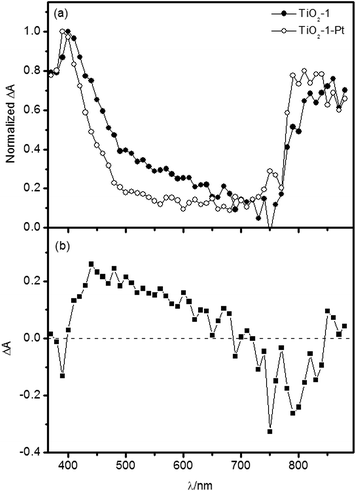
One can observe a peak at 380–500 nm, a broad band between 500 and 700 nm and a further peak at 760–890 nm. For TiO2-1, the high energy absorption maximum exhibits a hypsochromic shift at longer times after the laser excitation, which is not observed for TiO2-2. The introduction of metallic platinum at the photocatalyst surface induces some changes on the transient absorption spectra, as exemplified for TiO2-1 in Fig. 7.
It is well known that metallic platinum acts as electron acceptor on the TiO2 surface, with electrons being transferred within 10 ps.4 Thus, in ns-transient absorption spectra of the TiO2–Pt photocatalysts, the signals from trapped electrons should be greatly reduced in comparison to the bare photocatalysts. The difference spectrum shown in Fig. 7b thus evidences a strong contribution of the trapped electron absorption between 400 and 650 nm. Below 400 nm and above 700 nm, the transient absorption spectra seem to be dominated by trapped holes. Such interpretations are corroborated by previous studies carried out by Serpone et al.45 attributing the transient absorption in the range of 490–650 nm to electrons trapped as Ti3+ centers and also in different energy midgap levels. However, absorption features of trapped holes have also been reported in the 400–700 nm region,11 overlapping with the contribution of photogenerated electrons and hence making it difficult to identify the individual absorption signatures of the trapped carriers in the investigated spectral range.
Zawadzki64 performed calculations based on the Density Functional Theory and assigned the transient hole absorption in the 400–700 nm range to interpolaron transitions from O− centers located in the bulk to neighboring oxygen lattice sites. This author showed that holes trapped in the bulk are responsible for the lower energy transient absorption signals and that this feature is blue-shifted as the holes migrate to the surface. Hence, these calculations can explain the hypsochromic shift observed for the high energy band in the TiO2-1 transient absorption.
The TAS decay traces observed at three selected wavelengths (400, 500, and 780 nm) are presented in Fig. 8 for the bare as well as for the platinized photocatalysts. As shown in Fig. 8c, in the presence of platinum (as electron scavenger), the transient absorption signal at 780 nm does not even decay in the microsecond time-range. This behavior is different to that observed at 400 nm and evidences that the broad band observed in the range between 750 and 890 nm contains a strong contribution of holes located in a different trap state as compared with those responsible for the peak at higher photon energies (Fig. 8a). The lifetime of the photogenerated holes increases considerably once the electrons are transferred to the Pt islands on the oxide surface. This result is qualitatively similar to that reported by Yoshihara et al.33 for TiO2 nanoparticles with diameters of 10–15 nm. These authors observed two transient absorption peaks at 520 nm and 1200 nm, both of which were attributed to trapped holes. The high energy feature was ascribed to holes trapped more deeply than the ones responsible for the transient absorption at 1200 nm. This conclusion is corroborated by the observations made here. The decay at 400 nm is less affected by the presence of metallic platinum than the signal at 780 nm, which is indicative for the assumption that the holes responsible for the lower energy absorption signature are also the main species responsible for the photocatalytic activity.
 | ||
| Fig. 8 Absorption time profiles of bare and platinized photocatalysts at (a) 400 nm, (b) 500 nm, and (c) 780 nm. | ||
Other interesting features can be taken from the decay profiles at 400 nm and 500 nm (Fig. 8a and b, respectively). Both decay curves do not exhibit single exponential behavior, with some residual absorption still being observed after 10 μs. Results for the biexponential fits of the transient absorption data are shown in Table 2.
| Sample | λ probe | τ 1 (μs) | τ 2 (μs) |
|---|---|---|---|
| TiO2-1 | 400 | 1.0 (38%) | 9.0 (62%) |
| TiO2-1–Pt | 0.78 (50%) | 7.1 (50%) | |
| TiO2-2 | 0.73 (67%) | 5.0 (33%) | |
| TiO2-2–Pt | 0.80 (69%) | 6.0 (31%) | |
| TiO2-1 | 500 | 0.51 (65%) | 15 (35%) |
| TiO2-1–Pt | 0.46 (77%) | 13 (23%) | |
| TiO2-2 | 0.29 (80%) | 12 (20%) | |
| TiO2-2–Pt | 0.30 (95%) | >10 (5%) | |
| TiO2-1 | 780 | 2.2 (46%) | 29 (54%) |
| TiO2-2 | 0.88 (58%) | 6.6 (42%) |
At all investigated wavelengths the decay kinetics of the TiO2-2 photocatalyst are approx. 30% faster than those observed for TiO2-1. For TiO2-2, the decay at 400 nm does not change after platinum deposition, thus the signal can possibly be related to strongly trapped holes that do not contribute to any photocatalytic reaction. For TiO2-1, the presence of platinum increases the rate of these decay processes in relation to the bare powder. This can be explained by the migration of holes between different trapping sites, once the electrons have been transferred to the platinum islands.
At 500 nm, where the contribution of trapped electrons is higher, one can observe that the initial decay is faster than that at 400 nm, particularly for the TiO2-2 photocatalyst. Such faster decay rate can be clearly seen in the normalized time-resolved absorption spectra (see ESI, Fig. S7 and S8†) and can be related to a faster charge carrier recombination rate in this photocatalyst. As can be seen in Fig. 8b and also in the transient spectra (Fig. 6), the relative intensity of the TiO2-1 transient absorption between 500 and 600 nm is higher than that in TiO2-2. Apparently, more electron/hole pairs are recombining in TiO2-2 than in TiO2-1.
The charge carrier dynamics observed for TiO2-2 can be correlated to the hydrothermal treatment applied during its preparation. The low temperature employed (200 °C) should lead to the formation of more defects in the crystalline structure. These defects may act as recombination centers, decreasing the electron/hole lifetime. Another key aspect influencing the efficiency of the charge separation in TiO2 is the particle size. Serpone et al. studied the influence of the particle size on the charge carrier dynamics and found that the fastest recombination rate is observed for the smallest TiO2 nanoparticles.45 Herein TiO2-2 exhibits the smallest particle size.
Discussion
One of the objectives of this work is to establish relationships between the photocatalyst preparation, its morphological and electronic properties, and, finally, its photocatalytic activity. Given the large number of variables and factors that have to be taken into account, such task can be puzzling and it is usually not easy to establish a direct correlation valid for all photocatalysts. However, the data collected herein allow us to determine some interesting features that can be helpful for the development of highly efficient materials for photocatalysis.The photocatalytic tests performed showed that in comparison to TiO2-1 the TiO2-2 photocatalyst exhibits better efficiencies for dye degradation, gaseous acetaldehyde oxidation, and methanol oxidation. The performance of the photocatalyst prepared via hydrothermal treatment was even better than that observed for the commercial photocatalyst P25 for methanol oxidation. In these experiments the higher surface area of TiO2-2 seems to play the major role determining the photocatalytic effectiveness. All these processes involve the transfer of photogenerated holes to adsorbed species or the indirect transfer to an adsorbed water molecule yielding ˙OH radicals at the surface, which will further oxidize the substrate molecules.65 In both mechanisms, higher surface areas should lead to higher photonic efficiencies and, additionally, faster hole transfer processes should result in increased degradation rates. In the case of the photocatalytic methanol oxidation, the interfacial charge transfer occurs within 300 ps (ref. 4) and partially compensates the faster recombination rate observed for TiO2-2 in relation to TiO2-1.
If we normalize the degradation rates by the surface areas of the respective photocatalysts, the role of the electron/hole dynamics turns more evident. Taking the methanol oxidation, the normalized rates are 12 × 10−2, 7 × 10⁻² and 4 × 10⁻² μmol L−1 s−1 m−2, respectively for TiO2–P25, TiO2-1, and TiO2-2. These values follow the same trend observed for the electron/hole lifetimes obtained by TAS. Thus, in a given time after excitation, more charge carriers are available on TiO2-1 than on TiO2-2, but as the surface area of the former is lower, fewer molecules are oxidized.
Another interesting relationship that can be established between the TAS data and the photocatalytic activity arise from the comparison of the degradation rates (corrected by the respective surface area) and the relative intensity of the peaks at low and high energy. The ΔA (800 nm)/ΔA (400 nm) ratio immediately after the laser pulse is around 0.7 in TiO2-1 and 0.45 in TiO2-2. This decrease is in the same order than that observed for the corrected degradation rates for methanol oxidation and confirms that the holes responsible for the absorption signature at lower energy are the photoactive ones.
The crystal structure as well as the crystallinity also plays an important role for the observed photocatalytic behaviour. Initially, TiO2-2 was expected to exhibit a more efficient charge separation as compared with TiO2-1, as the former contains both, brookite and anatase crystallites in its structure. As reported earlier,66,67 the conduction band edge of brookite TiO2 is approx. 0.14 eV more negative than that of anatase, which should impose an energy barrier for the back electron transfer. However, in the case of TiO2-2 the larger amount of defects within its crystalline structure along with its smaller particle size seem to facilitate the charge recombination, reducing the charge carriers available for photocatalytic processes.
Charge carrier recombination can obviously be expected to be dependent on the light intensity employed in the laser experiments and further studies are necessary to understand more deeply the reason of the faster recombination rates observed for TiO2-2. As stated previously,68 the electron/hole recombination kinetics depend on the number of charge carriers generated per particle, being much faster at very high concentrations of electron/hole pairs in each TiO2 particle. Therefore, it can be expected that light intensity effects will be more evident in TiO2-2 due to its smaller primary particle size. The results found here for the bare photocatalysts are in good agreement with those reported by Carneiro et al.43 These authors concluded that, for powders consisting of primary particles with 7–15 nm diameter, the surface area and the available adsorption sites play a major role for the photocatalytic performance, while for 15–35 nm particles, the higher hole concentration and the greater crystallinity decreases the dependency on the surface area.
After platinum deposition on the TiO2 surface, the photocatalytic activities for methanol oxidation and H2 evolution increase for TiO2-1 and TiO2–P25, as a result of the improved charge separation efficiency. However, the photonic efficiency of TiO2-2 for methanol oxidation decreases by 50% in relation to the bare photocatalysts with its performance for H2 evolution being the worst among the investigated powders. Metal deposition leads to a decrease of the available adsorption sites on the TiO2 surface, as previously observed for other TiO2-based photocatalysts.69 In fact, the surface areas of the as synthesized TiO2 powders decrease by ca. 10% after Pt deposition. However as the surface area reduction is observed for all catalysts, the decrease in the TiO2-2 photocatalytic activity should be related to the concentration of charge carriers on each catalyst surface.
For all samples, the presence of platinum leads to a decrease in the charge carrier recombination rates in relation to those of the bare photocatalysts, since the metal islands act as efficient electron acceptors. Therefore, the results indicate that the lower crystallinity and the reduced particle size of TiO2-2 lead to a smaller concentration of electrons effectively transferred to the Pt islands. It has previously been shown that the so-called antenna mechanism provides an important pathway for H2 evolution on Pt–TiO2 photocatalysts.69 This mechanism is based on the interparticle charge carrier transport within TiO2 agglomerates until the electrons reach the Pt islands (or the holes reach oxidizable adsorbed substrate molecules, respectively). Hence, the difference in the conduction band energies of anatase and brookite present in TiO2-2 impedes the electron mobility, further decreasing the amount of H2 evolved, see Scheme 1. For the bare TiO2-2 photocatalyst, the larger surface area compensates the decrease of the charge carrier concentration resulting in an overall efficiency higher than that observed for the other oxides. However, this parameter only has a minor effect on the H2 evolution in the presence of a co-catalyst.
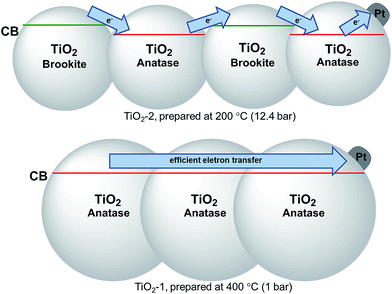 | ||
| Scheme 1 Diagram illustrating the effect of the as prepared TiO2 crystal structures on the electron transfer process to Pt islands. | ||
Conclusions
In this work two different TiO2 powders were prepared by the sol–gel method followed by thermal treatment in a conventional oven at 400 °C (TiO2-1) or in a hydrothermal reactor at 200 °C and 12.4 bar (TiO2-2). The later material exhibited higher surface area than the former, and its XRD pattern evidences the presence of approx. 45% of brookite along with the anatase polymorph. Rietveld refinement indicates a higher distortion on the TiO2-2 crystalline structure. The photocatalytic activities of the as prepared powders were evaluated using different reactions and were compared to those of the commercial photocatalyst TiO2–P25. The bare TiO2-2 exhibited better performance in photocatalytic processes involving an adsorption step, which can be directly related to its higher surface area. When metallic platinum was deposited on the TiO2 surfaces and the samples were tested for H2 evolution using methanol as the hole scavenger, the photonic efficiency of TiO2-1 was approx. 10% higher than that of TiO2-2. These results were rationalized using nanosecond transient absorption spectroscopy (TAS). It was found that:1. The electron/hole recombination rates in TiO2-2 are faster than those in TiO2-1 due to the more distorted crystalline structure and smaller particle size of the former. This negative aspect is overcompensated by the higher surface area of TiO2-2 in the absence of any co-photocatalyst.
2. In the presence of platinum as co-catalyst, the photocatalytic efficiency is dominated by the availability of charge carriers at the metal oxide surface.
Thus, the thermal treatment conditions determine two main factors, which influence very strongly the photocatalytic activity of the samples studied here, namely, the crystallinity and the surface area. The high crystallinity, obtained at higher temperatures, is particularly important for the transport of the charge carriers and this seems to be crucial for the production of molecular hydrogen, in which the electrons need to be transported through the oxide particles to the Pt islands.
On the other side, defects (lower crystallinity) are important for the harvesting of the charge carriers after they reach the particle surface, where a higher surface area yields an increase of the reaction rate constants. This behaviour is clearly observed for the TiO2 particles prepared by the hydrothermal treatment. An important conclusion of this work is that the best photocatalyst for a given photoreaction will not necessarily be the best choice for all photocatalytic processes! This will become particularly critical in the case of the photocatalytic H2 evolution where the presence of co-catalysts is necessary.
Acknowledgements
This work was supported by Fundacão de Amparo à Pesquisa do Estado de Minas Gerais (FAPEMIG), Conselho Nacional de Desenvolvimento Cientifíco e Tecnologíco (CNPq) and Coordenacão de Aperfeiçoamento de Pessoal de Nível Superior (CAPES). AOTP is thankful to the DLR Green Talents program for the research stay in Germany. Financial support by the Deutsche Forschungsgemeinschaft (DFG) is gratefully acknowledged (Project Number BA 1137/8-2). The authors are thankful to I. Ivanova and P. Esteban, respectively, for the assistance on H2 evolution measurements and TAS experiments.References
- S. Styring, Faraday Discuss., 2012, 155, 357–376 RSC.
- D. G. Nocera, Acc. Chem. Res., 2012, 45, 767–776 CrossRef CAS PubMed.
- K. W. Guo, Int. J. Environ. Res., 2012, 36, 1–17 Search PubMed.
- J. Schneider, M. Matsuoka, M. Takeuchi, J. Zhang, Y. Horiuchi, M. Anpo and D. W. Bahnemann, Chem. Rev., 2014, 114, 9919–9986 CrossRef CAS PubMed.
- N. Serpone and A. V. Emeline, J. Phys. Chem. Lett., 2012, 3, 673–677 CrossRef CAS PubMed.
- D. Ollis, P. Pichat and N. Serpone, Appl. Catal., B, 2010, 99, 377 CrossRef CAS.
- A. Fujishima and K. Honda, Nature, 1972, 238, 37–38 CrossRef CAS PubMed.
- X. B. Chen and S. S. Mao, J. Nanosci. Nanotechnol., 2006, 6, 906–925 CrossRef CAS PubMed.
- J. B. Joo, M. Dahl, N. Li, F. Zaera and Y. Yin, Energy Environ. Sci., 2013, 6, 2082–2092 CAS.
- C. Deiana, M. Minella, G. Tabacchi, V. Maurino, E. Fois and G. Martra, Phys. Chem. Chem. Phys., 2013, 15, 307–315 RSC.
- H. Zhan, X. Yang, C. Wang, C. Liang and M. Wu, J. Phys. Chem. C, 2010, 114, 14461–14466 CAS.
- S. L. Isley, D. S. Jordan and R. L. Penn, Mater. Res. Bull., 2009, 44, 119–125 CrossRef CAS.
- A. Zaban, S. T. Aruna, S. Tirosh, B. A. Gregg and Y. Mastai, J. Phys. Chem. B, 2000, 104, 4130–4133 CrossRef CAS.
- M. P. Finnegan, H. Zhang and J. F. Banfield, Chem. Mater., 2008, 20, 3443–3449 CrossRef CAS.
- W.-Y. Cheng, J. R. Deka, Y.-C. Chiang, A. Rogeau and S.-Y. Lu, Chem. Mater., 2012, 24, 3255–3262 CrossRef CAS.
- A. Hakki, R. Dillert and D. W. Bahnemann, Phys. Chem. Chem. Phys., 2013, 15, 2992–3002 RSC.
- M. V. Dozzi and E. Selli, J. Photochem. Photobiol., C, 2013, 14, 13–28 CrossRef CAS.
- Y.-C. Nah, I. Paramasivam and P. Schmuki, ChemPhysChem, 2010, 11, 2698–2713 CrossRef CAS PubMed.
- G. Sheng, J. Li, S. Wang and X. Wang, Prog. Chem., 2009, 21, 2492–2504 CAS.
- A. Bumajdad and M. Madkour, Phys. Chem. Chem. Phys., 2014, 16, 7146–7158 RSC.
- A. O. T. Patrocinio, L. F. Paula, R. M. Paniago, J. Freitag and D. W. Bahnemann, ACS Appl. Mater. Interfaces, 2014, 6, 16859–16866 CAS.
- F. Riboni, L. G. Bettini, D. W. Bahnemann and E. Selli, Catal. Today, 2013, 209, 28–34 CrossRef CAS.
- A. A. Ismail, R. A. Geioushy, H. Bouzid, S. A. Al-Sayari, A. Al-Hajry and D. W. Bahnemann, Appl. Catal., B, 2013, 129, 62–70 CrossRef CAS.
- H.-I. Kim, G.-H. Moon, D. Monllor-Satoca, Y. Park and W. Choi, J. Phys. Chem. C, 2012, 116, 1535–1543 CAS.
- T. A. Kandiel, I. Ivanova and D. W. Bahnemann, Energy Environ. Sci., 2014, 7, 1420–1425 CAS.
- C. Acar, I. Dincer and C. Zamfirescu, Int. J. Environ. Res., 2014, 38, 1903–1920 CAS.
- A. Valdes, J. Brillet, M. Graetzel, H. Gudmundsdottir, H. A. Hansen, H. Jonsson, P. Kluepfel, G.-J. Kroes, F. Le Formal, I. C. Man, R. S. Martins, J. K. Norskov, J. Rossmeisl, K. Sivula, A. Vojvodic and M. Zach, Phys. Chem. Chem. Phys., 2012, 14, 49–70 RSC.
- D. Y. C. Leung, X. L. Fu, C. F. Wang, M. Ni, M. K. H. Leung, X. X. Wang and X. Z. Fu, ChemSusChem, 2010, 3, 681–694 CrossRef CAS PubMed.
- D. Bahnemann, A. Henglein and L. Spanhel, Faraday Discuss. Chem. Soc., 1984, 78, 151–163 RSC.
- D. W. Bahnemann, M. Hilgendorff and R. Memming, J. Phys. Chem. B, 1997, 101, 4265–4275 CrossRef CAS.
- M. A. Henderson, Surf. Sci. Rep., 2011, 66, 185–297 CrossRef CAS.
- V. N. Kuznetsov, A. V. Emeline, N. I. Glazkova, R. V. Mikhaylov and N. Serpone, J. Phys. Chem. C, 2014, 118, 27583–27593 CAS.
- T. Yoshihara, R. Katoh, A. Furube, Y. Tamaki, M. Murai, K. Hara, S. Murata, H. Arakawa and M. Tachiya, J. Phys. Chem. B, 2004, 108, 3817–3823 CrossRef CAS.
- D. Wang, H. Wang and P. Hu, Phys. Chem. Chem. Phys., 2015, 17, 1549–1555 RSC.
- B. Ohtani, Phys. Chem. Chem. Phys., 2014, 16, 1788–1797 RSC.
- B. Liu, X. Zhao, C. Terashima, A. Fujishima and K. Nakata, Phys. Chem. Chem. Phys., 2014, 16, 8751–8760 RSC.
- B. Liu and X. Zhao, Phys. Chem. Chem. Phys., 2014, 16, 22343–22351 RSC.
- Y. Tamaki, K. Hara, R. Katoh, M. Tachiya and A. Furube, J. Phys. Chem. C, 2009, 113, 11741–11746 CAS.
- V. N. Kuznetsov and N. Serpone, J. Phys. Chem. C, 2009, 113, 15110–15123 CAS.
- Y. Tamaki, A. Furube, M. Murai, K. Hara, R. Katoh and M. Tachiya, Phys. Chem. Chem. Phys., 2007, 9, 1453–1460 RSC.
- M. Zhu, Y. Mi, G. Zhu, D. Li, Y. Wang and Y. Weng, J. Phys. Chem. C, 2013, 117, 18863–18869 CAS.
- A. Saeki, Y. Yasutani, H. Oga and S. Seki, J. Phys. Chem. C, 2014, 118, 22561–22572 CAS.
- J. T. Carneiro, T. J. Savenije, J. A. Moulijn and G. Mul, J. Phys. Chem. C, 2010, 114, 327–332 CAS.
- M. R. Hoffmann, S. T. Martin, W. Y. Choi and D. W. Bahnemann, Chem. Rev., 1995, 95, 69–96 CrossRef CAS.
- N. Serpone, D. Lawless, R. Khairutdinov and E. Pelizzetti, J. Phys. Chem., 1995, 99, 16655–16661 CrossRef CAS.
- Z. Zhang, C.-C. Wang, R. Zakaria and J. Y. Ying, J. Phys. Chem. B, 1998, 102, 10871–10878 CrossRef CAS.
- C. B. Almquist and P. Biswas, J. Catal., 2002, 212, 145–156 CrossRef CAS.
- H. Gerischer, Electrochim. Acta, 1995, 40, 1277–1281 CrossRef CAS.
- L. M. Ahmed, I. Ivanova, F. H. Hussein and D. W. Bahnemann, Int. J. Photoenergy, 2014, 475713 Search PubMed.
- T. A. Kandiel, A. A. Ismail and D. W. Bahnemann, Phys. Chem. Chem. Phys., 2011, 13, 20155–20161 RSC.
- D. L. Wood and J. Tauc, Phys. Rev. B: Solid State, 1972, 5, 3144–3151 CrossRef.
- International Organisation for Standardization, 2011, vol. ISO 22197-2:2011, p. 14.
- A. A. Ismail and D. W. Bahnemann, Chem. Eng. J., 2012, 203, 174–181 CrossRef CAS.
- T. Nash, Biochem. J., 1953, 55, 416–421 CrossRef CAS PubMed.
- A. A. Ismail and D. W. Bahnemann, Green Chem., 2011, 13, 428–435 RSC.
- A. A. Ismail, S. A. Al-Sayari and D. W. Bahnemann, Catal. Today, 2013, 209, 2–7 CrossRef CAS.
- D. F. M. Oliveira, P. S. Batista, P. S. Muller Jr, V. Velani, M. D. Franca, D. R. de Souza and A. E. H. Machado, Dyes Pigm., 2012, 92, 563–572 CrossRef CAS.
- A. E. H. Machado, M. D. Franca, V. Velani, G. A. Magnino, H. M. M. Velani, F. S. Freitas, P. S. Mueller Jr, C. Sattler and A. Schmuecker, Int. J. Photoenergy, 2008, 482373 Search PubMed.
- S. L. Isley and R. L. Penn, J. Phys. Chem. B, 2006, 110, 15134–15139 CrossRef CAS PubMed.
- G. Liu, H. G. Yang, J. Pan, Y. Q. Yang, G. Q. Lu and H. M. Cheng, Chem. Rev., 2014, 114, 9559–9612 CrossRef CAS PubMed.
- M. J. Lopez-Munoz, A. Revilla and G. Alcalde, Catal. Today, 2015, 240, 138–145 CrossRef CAS.
- U. Diebold, Surf. Sci. Rep., 2003, 48, 53–229 CrossRef CAS.
- K. S. W. Sing, Pure Appl. Chem., 1982, 54, 2201–2218 CrossRef.
- P. Zawadzki, J. Phys. Chem. C, 2013, 117, 8647–8651 CAS.
- A. Y. Ahmed, T. A. Kandiel, I. Ivanova and D. Bahnemann, Appl. Surf. Sci., 2014, 319, 44–49 CrossRef CAS.
- T. A. Kandiel, L. Robben, A. Alkaim and D. Bahnemann, Photochem. Photobiol. Sci., 2013, 12, 602–609 CAS.
- T. A. Kandiel, A. Feldhoff, L. Robben, R. Dillert and D. W. Bahnemann, Chem. Mater., 2010, 22, 2050–2060 CrossRef CAS.
- G. Rothenberger, J. Moser, M. Gratzel, N. Serpone and D. K. Sharma, J. Am. Chem. Soc., 1985, 107, 8054–8059 CrossRef CAS.
- T. A. Kandiel, R. Dillert, L. Robben and D. W. Bahnemann, Catal. Today, 2011, 161, 196–201 CrossRef CAS.
Footnote |
| † Electronic supplementary information (ESI) available: Rietveld analysis of XRD diffraction patterns, UV-Vis reflectance spectra and N2 adsorption/desorption isotherms of the TiO2 samples, time–profile curves for dye degradation in the presence of different photocatalysts and additional time-resolved absorption data. See DOI: 10.1039/c5ra13291f |
| This journal is © The Royal Society of Chemistry 2015 |

