Insights into the corrosion inhibition of copper in hydrochloric acid solution by self-assembled films of 4-octylphenol

Shi Mo, Ting Ting Qin, Hong Qun Luo and Nian Bing Li*
Key Laboratory of Eco-environments in Three Gorges Reservoir Region (Ministry of Education), School of Chemistry and Chemical Engineering, Southwest University, Chongqing 400715, China. E-mail: linb@swu.edu.cn; Fax: +86-23-68253237; Tel: +86-23-68253237

Received 5th July 2015 , Accepted 16th October 2015

First published on 16th October 2015


Abstract

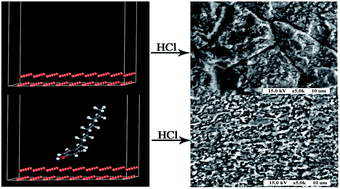
4-Octylphenol (OP) was used to form self-assembled films on copper to inhibit its corrosion in 0.5 M HCl solution. The corrosion protection ability of the OP films was evaluated using potentiodynamic polarization and electrochemical impedance spectroscopy studies. It was found that the highest inhibition efficiency was obtained when copper was self-assembled in a 1.0 mM OP solution for 24 h. The films on copper were characterized by scanning electron microscopy, contact angle tests, and Fourier transform infrared spectroscopy. Molecular simulations provided the adsorption model of OP molecules on the Cu (111) surface.

1. Introduction

The corrosion inhibition of copper has always been a significant research topic due to its important application in chemical and electronic industries.1 However, the dissolution of copper in the acidic solution limits its application in acid pickling, industrial cleaning and petrochemical processes.2 Organic compounds containing nitrogen, sulfur or oxygen atoms are effective inhibitors in suppressing metal corrosion.3–10 These organic compounds tend to be adsorbed on the metal surface and form compact films due to their good affinity to the transition metals.11–15 The molecular structures and the polar groups of the compounds play very important roles in the adsorption process.16 Therefore, the organic compounds containing polar group were self-assembled on metal surface by chemisorption to form protective films for inhibiting metal corrosion in the corrosive media.17,18

Self-assembly technique has attracted considerable attention because of the easy modification of surface through the chemisorption. Organic compounds could be adsorbed on metal surface chemically between hydroxyl group and metal atom, such as aluminium, etc. However, the application of 4-octylphenol (OP) as an anti-corrosion agent for metal has not been reported. In this paper, OP was self-assembled on copper surface to inhibit corrosion of copper in 0.5 M HCl solution. Electrochemical experiments were conducted to observe the inhibiting effect of OP films on the corrosion of copper in hydrochloric acid solution. The effects of self-assembly time and concentration of OP solution on the inhibition efficiency were assessed. The self-assembled films on copper were characterized by scanning electron microscope (SEM), contact angle tests, and Fourier transform infrared (FTIR) spectroscopy. Moreover, the adsorption model of OP molecule on the Cu (111) surface was established by molecular simulation.

2. Experimental

2.1. Preparation of the samples and films

4-Octylphenol (OP) (purity > 99%, Sigma-Aldrich Chemie) was used as received. OP was dissolved in absolute ethanol to prepare 0.05–5.0 mM solutions. The aqueous solution of 0.5 M HCl was freshly prepared by diluting 37% (v/v) HCl with doubly distilled water. HCl and ethanol used were of analytical reagent grade. The working electrodes were made from a 99.99 wt% pure copper specimen. The copper specimen was mechanically cut into 1 cm × 1 cm × 1 cm dimensions, embedded in epoxy resin, and only 1 cm2 area was exposed to air. Prior to all experiments, the samples were ground with a series of SiC waterproof abrasive papers (800, 1200, 1500, and 2000) and then polished by 1.0 and 0.5 μm Al2O3 powders on a felt cloth. These samples were degreased and washed ultrasonically in absolute ethanol and doubly distilled water for 5 min each.

The prepared copper electrodes were immersed into the OP solution immediately. The pH of the 1.0 mM OP ethanol solution was measured to be 5.0. After the formation of the films, the electrodes were taken out, rinsed with absolute ethanol, and dried in a stream of N2. Finally, the samples were stored under a dried nitrogen atmosphere.

2.2. Surface characterization

The surface morphologies of samples were observed on a scanning electron microscope (HITACHI S-3000 N, Japan) at 15.0 kV. The contact angles (CA) on the blank copper and OP covered copper electrodes were measured using a contact angle goniometer (JC2000C1, Shanghai Zhongchen Digital Technical Equipment Ltd., China) at ambient temperature. The FTIR spectra were recorded in a single reflection mode using a TENSOR 27 FT-IR spectrometer (BRUKER, Germany) with a resolution of 2 cm−1.

2.3. Electrochemical measurements

The electrochemical measurements were performed using an Autolab PGSTAT 302 electrochemical workstation (Eco Chemie BV, the Netherlands) in 0.5 M HCl solution at room temperature. A standard three-electrode cell was used containing platinum foil as the counter electrode (1.0 cm2), the saturated calomel electrode (SCE) as the reference electrode, and the modified copper electrode as the working electrode. Prior to the electrochemical measurements, the samples were stabilized at the open-circuit potential (OCP) for 30 min and the OCP versus exposure time was recorded. The polarization scans were carried out by polarizing to ±250 mV with respect to the OCP at a scan rate of 1 mV s−1 from the cathodic side. Electrochemical impedance spectra (EIS) measurements were carried out in a frequency range of 100 kHz to 10 mHz with the ac voltage amplitude of 5 mV at the OCP. The impedance data were analyzed using Zsimpwin 3.10 software and fitted to appropriate equivalent circuits. The experimental results were reproduced and each experiment was performed three times where a very good agreement was obtained.

2.4. Molecular simulation

The molecular simulation was performed by means of density functional theory (DFT) using Dmol3 from the Materials Studio program package. The gradient corrected generalized gradient approximation (GGA)19 function was employed. A (5 × 9) surface unit cell with a slab of two layers (45 Cu atoms per super cell) was chosen to model the Cu (111) surface. The Cu (111) surface and OP molecule were first optimized to their minimum energies, respectively, and then the adsorption model of OP molecule on the Cu (111) surface was simulated. The geometrical structure was optimized by allowing relaxation of OP molecule and all the Cu atoms at the upper layer. The adsorption energy, Eads, of the copper surface with OP molecule was calculated according to the following equation:20
 
Eads = Etotal − (ECu + EOP) (1)
where Etotal is the total energy of Cu (111) together with the adsorbed OP molecule after simulation, ECu and EOP are the energies of copper crystal and free OP molecule, respectively.

3. Results and discussion

3.1. Open-circuit potential measurements

Open-circuit potential (Eocp) is the potential of an electrode measured with respect to a reference electrode at equilibrium without the application of external current or potential.21 In this study, the variation of the Eocp as a function of immersion time was measured in 0.5 M HCl solution. Fig. 1 presents potential–time curves for the blank copper and the OP covered copper electrodes self-assembled in 1.0 mM OP solution for different time. The initial Eocp value was measured to be −0.085 V for the blank copper, and the Eocp value started to decrease drastically in a short time and attained a constant Eocp value, which was more negative than the initial Eocp value, after 60 min immersion time. This phenomenon may be related to the surface activation of copper which leads to the formation of intermediate species such as CuCl and followed by the formation of CuCl film.22 For the OP covered copper electrodes, the values of Eocp in steady-state were more negative compared with that of the blank copper, and the longer the self-assembly time of the electrode in 1.0 mM OP solution within 24 h was, the more negative the values of Eocp in steady-state were. However, when the self-assembly time was 30 h, the value of Eocp shifted to less negative value.
image file: c5ra13074c-f1.tif
Fig. 1 Potential–time curves in 0.5 M HCl solution for the blank copper and the OP covered copper electrodes self-assembled for different time in 1.0 mM OP solution.

It is noted that the values of Eocp in the steady-state are more negative than the initial Eocp value in this study. This result may be explained that some defects may form on the film and/or desorption of the inhibiting film is in progress after long immersion time.

The potential–time curves for the blank copper and the OP covered copper electrodes self-assembled in different concentrations of OP solutions for 24 h have also been recorded but not presented. The experimental results showed that the values of Eocp of the OP covered copper electrodes after 60 min were more negative than that of the blank copper. Thus, the adsorption of the OP molecules on the copper surface changed the Eocp to more negative values, indicating that the OP films acted as a cathodic type inhibitor.23

3.2. Effect of OP concentration on the film properties

3.2.1. Potentiodynamic polarization measurements. Fig. 2 presents the potentiodynamic polarization curves of the blank copper and the OP covered copper electrodes in 0.5 M HCl solution. It can be seen from Fig. 2 that the corrosion current densities (jcorr) of the OP covered copper electrodes reduced markedly compared with that of the blank copper electrode. Furthermore, the corrosion potential (Ecorr) shifted in the negative direction in the presence of the OP films due to the decrease in the rate of the cathodic reaction.
image file: c5ra13074c-f2.tif
Fig. 2 Polarization curves in 0.5 M HCl solution for the blank copper and the OP covered copper electrodes self-assembled for 24 h in OP solution with different concentrations.

The results also indicated that the inhibitor acted as a cathodic type inhibitor for copper in 0.5 M HCl solution. This may be due to the fact that the inhibitor had a stronger influence on the cathodic reaction than that on the copper dissolution. This effect was significantly enhanced with increasing the concentration of OP solution.

The electrochemical parameters, jcorr and Ecorr, were obtained by extrapolating the anodic and cathodic Tafel segments in the polarization curves up to their intersection and are presented in Table 1. The values of anodic Tafel slope (ba), cathodic Tafel slope (bc), and polarization resistance (Rp) obtained from the polarization curves are also listed in Table 1. The inhibition efficiency (ηj) was calculated by the following equation:21

 
image file: c5ra13074c-t1.tif(2)
where j0corr and jcorr represent the corrosion current densities of the blank copper and OP covered copper electrodes, respectively. It can be seen from Table 1 that value of jcorr of the blank electrode is the highest. When the electrodes were covered with OP films, the values of jcorr decreased markedly. The value of jcorr decreased from 35.6 to 4.4 μA cm−2 when the OP concentration was changed from 0.05 to 1.0 mM, in which the ηj value reached the maximum, 91.7%. This suggests that the films on the copper surface are densely packed films, thus inhibiting the corrosion of copper. However, when the OP concentration is 5.0 mM, the jcorr value decreases slightly, implying that the OP concentration has the optimum value when self-assembled on the copper samples. Further increase in the inhibitor concentration shows a slight decrease in the inhibition efficiency. This phenomenon is consistent with the results obtained from other inhibitors and may be caused by the “steric effect” that the adsorbed molecules rearrange on the substrate after the number of the adsorbed molecules reaches a certain value, which make it easy for the corrosive chloride ions to attack the electrode through the interface.24

Table 1 Polarization parameters for the blank copper and copper electrodes self-assembled in different concentrations of OP solutions for 24 h in 0.5 M HCl solution
C (mM) Ecorr (mV per SCE) bc (mV per dec) ba (mV per dec) jcorr (μA cm−2) Rp (Ω cm2) ηj (%)
0 −189 269 71 52.9 460
0.05 −203 240 66 35.6 630 32.8
0.1 −199 257 60 16.6 1269 68.6
1.0 −234 191 56 4.4 4270 91.7
5.0 −229 217 61 6.4 3276 88.0


3.2.2. Electrochemical impedance spectroscopy measurements. In order to investigate the anticorrosion properties of the OP film as well as the kinetics of corrosion reaction process, EIS tests were performed. The EIS diagrams of the blank copper and OP covered copper electrodes in 0.5 M HCl solutions are shown in Fig. 3. The electrical equivalent circuits shown in Fig. 4 were used to fit the experimental data and interpret the EIS spectra. It can be seen from Fig. 3a that the impedance of samples increased in the presence of OP films.
image file: c5ra13074c-f3.tif
Fig. 3 EIS in 0.5 M HCl for the blank copper and the OP covered copper electrodes immersed in OP solution for 24 h with different concentrations: (a) Nyquist plots; (b) Bode plots.

image file: c5ra13074c-f4.tif
Fig. 4 Equivalent circuits used for fitting the impedance data.

In Fig. 3a, the Nyquist plots display an obvious capacitive loop in high frequencies and a straight line in low frequencies, which is named as “Warburg impedance”. The slightly depressed capacitive loop is indicative of the roughness and the inhomogeneity of the copper electrode surface.25 The Warburg impedance reflects the anodic diffusion process of the soluble copper species (CuCl2) from the copper electrode surface to the bulk solution26,27 and the cathodic diffusion process of dissolved oxygen from the bulk solution to the electrode surface.28

For the blank copper and the electrodes self-assembled in 0.05 mM OP solution, lower resistances were observed and the data were well fitted by the equivalent circuit shown in Fig. 4a. In the circuit, Rs represents the solution resistance, Rct is the charge transfer resistance relative to the corrosion reaction at the copper/solution interface, and W represents the Warburg impedance. In addition, Qdl represents the constant phase element (CPE), which was used for replacing the double-layer capacitance (Cdl) to achieve more precise fitting results. The impedance of CPE was defined as

 
image file: c5ra13074c-t2.tif(3)
where Y0 is modulus, j is the imaginary root, ω is the angular frequency, and n is the deviation parameter, which is related to the surface morphology.29 For n = 1, the CPE is pure capacitance.

The fitted results indicate that only one time constant displayed in the Nyquist plots and the corrosion reaction process was under charge transfer control for the blank copper and the sample self-assembled in 0.05 mM OP solution. For the blank copper, the value of Rct was 69.5 Ω cm2, which is lower than that of the OP covered copper electrode. Viewing the impedance results in the format of the Bode plots, Fig. 3b shows that there is one phase angle maximum for the blank copper electrode.

In the Bode plots shown in Fig. 3b, clear resistive region in the low frequency shows that the Rp values (the sum of Rs, Rct and Rf, where Rf represents the transfer resistance of electrons through the films) increased with increasing the OP concentration from 0.05 to 1.0 mM. This result implies that the higher the OP concentration is, the denser the films packed on the copper surface is. The data for the electrodes self-assembled in 0.1, 1.0 and 5.0 mM OP solutions were well fitted by the equivalent circuit shown in Fig. 4b, in which Qf is the constant phase elements modeling the capacitance of the films. The impedance parameters obtained by fitting the experimental data with different equivalent circuits are listed in Table 2. It is noted that the coefficients, n1 and n2 listed in the table denote the deviation exponents of Qf and Qdl, respectively. The values of n fell between 0.5 and 0.9, which indicated the deviation of pure capacitance. Besides, when the value was close to 0.5, the diffusion effect was remarkable. Furthermore, the Rct values increased, whereas the Qdl values decreased with increasing the OP concentration within 1.0 mM. The Rct values increased from 100.8 to 358.2 Ω cm2 with the samples self-assembled in 0.05 to 1.0 mM OP solutions. The inhibition efficiency (ηR) value was calculated using the charge transfer resistance from the following equation:21

 
image file: c5ra13074c-t3.tif(4)
where R0 and Rinh are the sum of Rf and Rct of the blank copper and the OP covered copper electrodes, respectively. The ηR reached the maximum value, 86.3%, when the OP concentration was 1.0 mM. The increase of the ηR value implies the enhancement of the anticorrosion ability of the films. However, the ηR value decreased when the electrode was self-assembled in 5.0 mM OP solution. This result is in accordance with that from the polarization measurements.

Table 2 Impedance parameters for the blank copper and copper electrodes self-assembled in different concentrations of OP solution for 24 h in 0.5 M HCl solution
C (mM) Qf (μS sn cm−2) n1 Rf (Ω cm2) Qdl (μS sn cm−2) n2 Rct (Ω cm2) W (mΩ cm2) ηR (%)
0 1452.0 0.60 69.5 101.0
0.05 3251.0 0.53 100.8 56.4 31.1
0.1 469.6 0.67 21.4 651.3 0.66 166.8 48.2 63.1
1.0 665.8 0.73 34.65 192.5 0.83 472.1 18.1 86.3
5.0 353.2 0.76 17.8 612.3 0.69 312.7 48.9 78.9


3.3. Effect of self-assembly time on the film properties

3.3.1. Potentiodynamic polarization measurements. It can be observed from Fig. 5 that the corrosion current density (jcorr) obtained on the OP covered copper is lower than that of the blank copper and the value of corrosion potential undergoes a shift to negative direction markedly. For the blank copper, the value of jcorr was as high as 52.9 μA cm−2 in 0.5 M HCl solution. The blank sample was less resistant to the corrosion reaction and corroded dramatically in the HCl solution. When the copper was covered with OP films, the jcorr value decreased with an increase in the self-assembly time and reached the lowest value of 4.4 μA cm−2 after self-assembled for 24 h in 1.0 mM OP solution.
image file: c5ra13074c-f5.tif
Fig. 5 Polarization curves in 0.5 M HCl for the blank copper and OP covered copper electrodes self-assembled in 1.0 mM OP solution for different time.

The electrochemical parameters jcorr, Ecorr, ba, bc, and Rp obtained from the polarization curves are listed in Table 3, in which ηj was calculated by eqn (2). Table 3 shows that the ηj value increased with the increase of OP self-assembly time ranging from 1 to 24 h. It is suggested that the longer the self-assembly time is, the denser the film is, which results in more effective corrosion inhibition of copper. However, when the self-assembly time increased to 30 h, the ηj value decreased slightly. This result may also be caused by the “steric effect”24 mentioned above.

Table 3 Polarization parameters for the blank copper and copper electrodes self-assembled in 1.0 mM OP solution for different time in 0.5 M HCl solution
t (h) Ecorr (mV per SCE) bc (mV per dec) ba (mV per dec) jcorr (μA cm−2) Rp (Ω cm2) ηj (%)
0 −189 269 71 52.9 460
1 −200 216 63 24.2 748 54.3
6 −206 263 62 19.4 992 63.3
12 −221 212 58 10.9 1931 79.4
24 −234 191 56 4.4 4270 91.7
30 −226 238 55 7.8 2714 85.3


3.3.2. Electrochemical impedance spectroscopy measurements. The EIS spectra of the blank copper and OP covered copper electrodes self-assembled for different time are shown in Fig. 6. It can be seen from Fig. 6a that the Nyquist plots display an obvious capacitive loop in high frequencies and Warburg impedance in low frequencies. The experimental data fitted by the equivalent circuits shown in Fig. 4 are listed in Table 4.
image file: c5ra13074c-f6.tif
Fig. 6 EIS in 0.5 M HCl for the blank copper and OP covered copper electrodes immersed in 1.0 mM OP solution for different time: (a) Nyquist plots; (b) Bode plots.
Table 4 Impedance parameters for the blank copper and copper electrodes self-assembled in 1.0 mM OP solution for different time in 0.5 M HCl solution
t (h) Qf (μS sn cm−2) n1 Rf (Ω cm2) Qdl (μS sn cm−2) n2 Rct (Ω cm2) W (mΩ cm2) ηR (%)
0 1452 0.60 69.5 101
1 4791 0.52 127.8 37.0 45.6
6 1961 0.61 7.4 1937 0.76 149.2 28.3 55.6
12 743.4 0.67 11.2 982.5 0.81 220.8 21.6 70.0
24 665.8 0.73 34.65 192.5 0.83 472.1 18.1 86.3
30 312.9 0.74 21.1 655.2 0.68 331.5 22.3 80.3


For the blank copper and the sample self-assembled in 1.0 mM OP solution for 1 h, low Rct values were observed at 10 mHz in the low frequency in the Bode plots shown in Fig. 6b and the data were fitted by the equivalent circuit shown in Fig. 4a. For the copper electrodes modified in 1.0 mM OP solution for 6 to 30 h, their impedance spectra were fitted by the equivalent circuit shown in Fig. 4b. The diameter of the capacitive loop increased with increasing the immersion time ranging from 1 to 24 h. And, in the Bode plots shown in Fig. 6b, the logarithm of Z modulus reached to the maximum value when the self-assembly time was 24 h.

Table 4 shows the impedance parameters, which their interpretations have been mentioned in Section 3.2.2. Besides, the ηR values were calculated by eqn (4) mentioned above. It can be seen from Table 4 that the Rct values of copper increased with increasing the self-assembly time from 1 to 24 h and the anticorrosion ability of the films enhanced gradually.

When the self-assembly time reached 24 h, ηR increased to the highest value of 86.3% with the Rct value of 472.1 Ω cm2. However, ηR decreased slightly with the increase of the self-assembly time up to 30 h. Additionally, in order to verify whether a higher concentration can lead to a more rapid formation of self-assembled film on copper surface and enhance the protection ability of the film or not, the species were immersed into 5.0 mM OP solution for 12 and 18 h, respectively. As shown in ESI (Fig. S1 and Table S1), the inhibition efficiencies did not reach to 80%. These results indicate that the self-assembly of OP molecules on copper surface has an optimum time of 24 h. In conclusion, the copper self-assembled in 1.0 mM OP solution for 24 h has the highest resistance against corrosion.

3.4. SEM analyses

SEM is widely used for studying the morphological features of metal surface.11,21,27,30,31 Fig. 7 shows the SEM images of the blank copper and copper electrodes self-assembled in 1.0 mM OP solution for 24 h before and after immersion in 0.5 M HCl solution for 1 h. It can be seen from Fig. 7a that the blank copper surface is covered with nicks and lines because of the treatment of copper surface with SiC abrasive papers. However, the surface morphology changed and many cracks and holes occurred after immersion in 0.5 M HCl for 1 h as shown in Fig. 7b, indicating that the copper surface was dramatically damaged in HCl solution.
image file: c5ra13074c-f7.tif
Fig. 7 SEM images of: (a) the blank copper, (b) the blank copper after immersion in 0.5 M HCl solution for 1 h, (c) the OP covered copper electrode self-assembled in 1.0 mM OP solution for 24 h and, (d) the OP covered copper electrode self-assembled in 1.0 mM OP solution for 24 h after immersion in 0.5 M HCl solution for 1 h.

In Fig. 7c, the OP modified copper displays a smooth surface with some pores randomly distributed on the substrate. This phenomenon may result from the defect of the self-assembled film after a long immersion time, and the observation is in accordance with the result discussed in Section 3.1, and similar observation was reported.32 In Fig. 7d, the OP modified copper displays a surface without cracks or nicks after immersed in 0.5 M HCl solution for 1 h, indicating that the OP films could inhibit copper corrosion to some extent. All the images suggest that the OP films can be formed on the copper surface, which is responsible for the corrosion inhibition.

3.5. CA measurements

Fig. 8 shows the optical micrographs of a drop of sessile water on the blank copper and the OP covered copper electrode self-assembled in 1.0 mM OP solution for 24 h. The contact angle (the mean value of three measurements) of the blank copper was 72° (Fig. 8a), whereas the contact angle of OP covered copper was 96° (Fig. 8b), showing the surface become more hydrophobic. The hydrophobic property of the film is due to anchoring of the hydrocarbon chain on the copper surface. The results suggested that the OP molecules were adsorbed on copper surface with exposing the hydrocarbon chain outward and formed well oriented films. Therefore, it is reasonable to assume that the inhibitors were adsorbed chemically on copper surface through the –OH group or both the –OH group and the aromatic moiety. Further confirmation of the molecular orientation has been performed by the FTIR measurements and molecular simulation.
image file: c5ra13074c-f8.tif
Fig. 8 Optical micrographs of a drop of water on (a) the blank copper and (b) OP covered copper self-assembled in 1.0 mM OP solution for 24 h.

3.6. FTIR measurements

FTIR analyses serve as an effective method for the identification of the functional groups on the metal surface participating in the adsorption reaction.33,34 The measurements of FTIR spectra were performed on the OP powder and the copper electrode self-assembled in 1.0 mM OP solution for 24 h to confirm the presence of the OP film and to obtain more detailed information about the adsorbent. Fig. 9a and b show the FTIR spectra of the OP powder and the OP film adsorbed on copper. It is evident that the spectra have some matching bands. In Fig. 9a, the characteristic bands of OP observed around 2849 and 2920 cm−1 are attributed to the asymmetric and symmetric –CH3 stretching vibrations. The bands around 1614, 1515, 1461, 1259, and 820 cm−1 can be assigned to the vibrations of the aromatic ring,35 which are also presented in Fig. 9b. According to the literature,36 the presence of bands caused by vibrations of the aromatic rings indicates that the aromatic rings do not adopt an absolutely flat orientation; rather they are tilted to the substrate surface. So it can be deduced that the aromatic ring in the OP molecule is tilted to the copper surface. Furthermore, it is easy to find that the characteristic band of O–H stretching vibration at 3414 cm−1 in Fig. 9a almost disappears in Fig. 9b, indicating that OP can be chemisorbed on the copper surface and the adsorption of OP would take place solely through the hydroxyl group.
image file: c5ra13074c-f9.tif
Fig. 9 FTIR spectra of (a) OP powder and (b) the OP film on the copper substrate self-assembled in 1.0 mM OP solution for 24 h.

3.7. Molecular simulation results

Molecular simulation has already increasingly been applied to explore the adsorption mechanism of molecules on the metal surface.15,17,18 To further investigate the adsorption behavior of OP on the copper electrodes, molecular simulation was performed, and the Cu (111) was considered to be the most stable low miller indices surface and selected for analysis in this study.37 Fig. 10 shows the side and top views of the adsorption model of OP on Cu (111) surface after optimization. When the OP molecules were adsorbed on Cu (111) surface, the aromatic ring and the long hydrocarbon chain were tilted to the copper surface with different angles. And such phenomenon was also observed in the adsorption of 3-alkyl-4-amino-5-mercapto-1,2,4-triazole on the iron surface.38
image file: c5ra13074c-f10.tif
Fig. 10 Adsorption model of OP molecule on the surface of Cu (111) after optimization: (a) the side view and (b) the top view.

The adsorption energy Eads calculated by eqn (1) is −167.25 kJ mol−1, indicating that the OP molecule can be strongly adsorbed on copper surface. Furthermore, the oxygen atom has the most negative value of the Mulliken atomic charge in the OP molecule of −0.469, which changes to −0.426 after adsorption. This result indicates that the oxygen atom in the OP molecule can donate the unshared pair of electrons to the vacant d orbital of copper and form a coordination bond. Therefore, there is a competition between the π-electron of the aromatic ring and electron-donation by the oxygen atom, which affects the orientation of the molecule and changes it from lying flat to tilting away from the Cu surface.36 This result is in agreement with that from the FTIR spectra. In conclusion, the OP molecules can be adsorbed on the copper surface through the oxygen atom of hydroxyl group with the hydrocarbon chain tilted to the copper surface.

4. Conclusions

The inhibition of copper corrosion in HCl solution by OP self-assembled film has been studied using a series of electrochemical techniques along with SEM, CA, and FTIR. The results are listed as follows: (1) the SEM and CA analyses indicate that copper corrosion can be inhibited evidently by OP self-assembled film formed on the copper surface. Moreover, the OP film on the Cu surface was characterized by FTIR. (2) OP is a cathodic inhibitor for copper in 0.5 M HCl. The inhibition efficiency reached to the maximum value at 1.0 mM OP ethanol solution by self-assembling for 24 h. (3) EIS measurement data also indicate that the Rinh values of OP self-assembled film covered copper electrodes increase remarkably compared with that of the blank copper electrode. (4) Molecular simulation suggests that OP was adsorbed on copper with the aromatic ring and the hydrocarbon chain tilted to the copper surface with different angle. (6) All of the electrochemical data are in good agreement with the morphology characteristics, showing that OP acts as an inhibitor by forming a protective film on the copper surface. Compounds containing similar functional groups to OP may be adsorbed chemically on other metal surfaces, thus this work may play a role in developing other anti-corrosion films for other metals.

Acknowledgements

This work was financially supported by the National Natural Science Foundation of China (No. 21273174) and the Municipal Natural Science Foundation of Chongqing City (No. CSTC–2013jjB00002).

Notes and references

  1. D. Q. Zhang, H. J. Zeng, L. Zhang, P. H. Liu and L. X. Gao, Colloids Surf., A, 2014, 445, 105–110 CrossRef CAS PubMed.
  2. Z. H. Tao, S. T. Zhang, W. H. Li and B. R. Hou, Corros. Sci., 2009, 51, 2588–2595 CrossRef CAS PubMed.
  3. R. Fuchs-Godec and V. Dolecek, Colloids Surf., A, 2004, 244, 73–76 CrossRef CAS PubMed.
  4. H. Otmačić and E. Stupnišek-Lisac, Electrochim. Acta, 2003, 48, 985–991 CrossRef.
  5. P. Lowmunkhong, D. Ungthararak and P. Sutthivaiyakit, Corros. Sci., 2010, 52, 30–36 CrossRef CAS PubMed.
  6. J. F. Walsh, H. S. Dhariwal, A. Gutiérrez-Sosa, P. Finetti, C. A. Muryn, N. B. Brookes, R. J. Oldman and G. Thornton, Surf. Sci., 1998, 415, 423–432 CrossRef CAS.
  7. Z. L. Quan, S. H. Chen and S. L. Li, Corros. Sci., 2001, 43, 1071–1080 CrossRef CAS.
  8. D. S. Kong, S. L. Yuan, Y. X. Sun and Z. Y. Yu, Surf. Sci., 2004, 573, 272–283 CrossRef CAS PubMed.
  9. D. Jayaperumal, Mater. Chem. Phys., 2010, 119, 478–484 CrossRef CAS PubMed.
  10. G. K. Jennings and P. E. Laibinis, Colloids Surf., A, 1996, 116, 105–114 CrossRef CAS.
  11. D. K. Yadav, D. S. Chauhan, I. Ahamad and M. A. Quraishi, RSC Adv., 2013, 3, 632–646 RSC.
  12. D. H. Wang, Y. H. Ni, Q. Huo and D. E. Tallman, Thin Solid Films, 2005, 471, 177–185 CrossRef CAS PubMed.
  13. D. Taneichi, R. Haneda and K. Aramaki, Corros. Sci., 2001, 43, 1589–1600 CrossRef CAS.
  14. T. Osaka and M. Yoshino, Electrochim. Acta, 2007, 53, 271–277 CrossRef CAS PubMed.
  15. S. John and A. Joseph, RSC Adv., 2012, 2, 9944–9951 RSC.
  16. E. E. Oguzie, V. O. Njoku, C. K. Enenebeaku, C. O. Akalezi and C. Obi, Corros. Sci., 2008, 50, 3480–3486 CrossRef CAS PubMed.
  17. Y. Zhou, S. Y. Xu, L. Guo, S. T. Zhang, H. Lu, Y. L. Gong and F. Gao, RSC Adv., 2015, 5, 14804–14813 RSC.
  18. T. Tuken, N. Kicir, N. T. Elalan, G. Sigircik and M. Erbil, Appl. Surf. Sci., 2012, 258, 6793–6799 CrossRef CAS PubMed.
  19. J. J. Mortensen, M. V. Ganduglia-Pirovano, L. B. Hansen, B. Hammer, P. Stoltze and J. K. Nørskov, Surf. Sci., 1999, 422, 8–16 CrossRef CAS.
  20. M. A. Amin, K. F. Khaled and S. A. Fadl-Allah, Corros. Sci., 2010, 52, 140–151 CrossRef CAS PubMed.
  21. S. J. Yuan, S. O. Pehkonen, B. Liang, Y. P. Ting, K. G. Neoh and E. T. Kang, Corros. Sci., 2010, 52, 1958–1968 CrossRef CAS PubMed.
  22. K. M. Ismail, Electrochim. Acta, 2007, 52, 7811–7819 CrossRef CAS PubMed.
  23. K. D. Allabergenov and F. K. Kurbanov, Prot. Met., 1979, 15, 378 Search PubMed.
  24. W. J. Guo, S. H. Chen and H. Y. Ma, J. Serb. Chem. Soc., 2006, 71, 167–175 CrossRef CAS.
  25. H. Ashassi-Sorkhabi, N. Ghalebsaz-Jeddi, F. Hashemzadeh and H. Jahani, Electrochim. Acta, 2006, 51, 3848–3854 CrossRef CAS PubMed.
  26. W. J. Guo, S. H. Chen, B. D. Huang, H. Y. Ma and X. G. Yang, Electrochim. Acta, 2006, 52, 108–113 CrossRef CAS PubMed.
  27. Y. Feng, K.-S. Siow, W.-K. Teo, K.-L. Tan and A.-K. Hsieh, Corrosion, 1997, 53, 389–398 CrossRef CAS.
  28. H. Ma, S. Chen, L. Niu, S. Zhao, S. Li and D. Li, J. Appl. Electrochem., 2002, 32, 65–72 CrossRef CAS.
  29. G. Y. Li, H. Y. Ma, Y. L. Jiao and S. H. Chen, J. Serb. Chem. Soc., 2004, 69, 791–805 CrossRef CAS.
  30. F. Noli, P. Misaelides, A. Hatzidimitriou, E. Pavlidou and A. D. Pogrebnjak, Appl. Surf. Sci., 2006, 252, 8043–8049 CrossRef CAS PubMed.
  31. Y. F. Zhang, X. Q. Yu, Q. H. Zhou, F. Chen and K. N. Li, Appl. Surf. Sci., 2010, 256, 1883–1887 CrossRef CAS PubMed.
  32. S. S. Wu, Z. Y. Chen, Y. B. Qiu and X. P. Guo, J. Electrochem. Soc., 2012, 159, C277–C282 CrossRef CAS PubMed.
  33. S. M. York, S. Haq, K. V. Kilway, J. M. Phillips and F. M. Leibsle, Surf. Sci., 2003, 522, 34–46 CrossRef CAS.
  34. N. Karthik and M. G. Sethuraman, RSC Adv., 2015, 5, 8693–8705 RSC.
  35. C. Namasivayam and D. Kavitha, Microchem. J., 2006, 82, 43–48 CrossRef CAS PubMed.
  36. Y. S. Tan, M. P. Srinivasan, S. O. Pehkonen and S. Y. M. Chooi, Corros. Sci., 2006, 48, 840–862 CrossRef CAS PubMed.
  37. S. Q. Sun, Y. F. Geng, L. Tian, S. H. Chen, Y. G. Yan and S. Q. Hu, Corros. Sci., 2012, 63, 140–147 CrossRef CAS PubMed.
  38. X. Y. Liu, S. H. Chen, H. Y. Zhai, L. X. Shen, J. J. Zhou and L. Wu, Electrochem. Commun., 2007, 9, 813–819 CrossRef CAS PubMed.

Footnote

Electronic supplementary information (ESI) available. See DOI: 10.1039/c5ra13074c

This journal is © The Royal Society of Chemistry 2015