Tribological behavior of a TiAl matrix composite containing 10 wt% Ag investigated at four wear stages
Kang Yanga,
Xiaoliang Shi*a,
Da Zhengb,
Wenzheng Zhaia,
Ahmed Mohamed Mahmoud Ibrahima and
Zhihai Wanga
aSchool of Mechanical and Electronic Engineering, Wuhan University of Technology, 122 Luoshi Road, Wuhan 430070, China. E-mail: sxl071932@126.com; Fax: +86-27-87651793; Tel: +86-27-87651793
bSchool of Mechanical Engineering, Shanghai Jiao Tong University, 1954 Huashan Road, Shanghai 200030, China
First published on 2nd September 2015
Abstract
The useful longevity of mechanical components, such as gears and sliding bearings, were related with their tribological behaviors. The tribological behavior of a TiAl matrix composite containing 10 wt% Ag (TiAl–10 wt% Ag) was investigated at the four different wear stages. Wear stages, which were identified by the obtained friction coefficient and wear rate, were divided into the initial wear stage (INITIAL), fast wear stage (FAST), stable wear stage (STABLE) and severe wear stage (SEVERE). The results showed that tribological behavior at INITIAL was improved for work hardening. The friction coefficient and wear rate at FAST were small for the formation of mixed layers containing a solid lubricant Ag. Excellent tribological behavior at STABLE was attributed to the existence of lubricant films containing massive amounts of solid lubricant Ag. Poor tribological behavior of TiAl–10 wt% Ag at SEVERE was obtained for the lubricant film destroyed by the propagation of fatigue cracks. It was found that TiAl–10 wt% Ag, because of the excellent tribological behavior at STABLE, could be chosen as a promising structural material for mechanical components.
1. Introduction
TiAl alloy, for its eminent mechanical behaviors and thermal properties, was accepted as a promising structure material for aerospace components such as turbine blades, divergent flaps, and turbochargers or nozzles.1–5 Mechanical components were fabricated using materials of poor tribological performance, resulting in the wasting of materials and energy sources. TiAl alloy, because of its poor tribological properties, was also limited from further development in the aerospace and automotive industries.6–9Tribological performance of materials could be significantly improved by fabricating self-lubricating composites containing solid lubricants. Solid lubricants, such as MoS2,10 multilayer graphene,11 graphite,12–15 boron nitride,16 Ti3SiC2,17,18 multi-walled carbon nanotubes (MWCNTs)19 and silver (Ag),20 have been demonstrated to significantly improve the tribological properties of self-lubricating composites. Shi et al.20 fabricated TiAl matrix self-lubricating composites containing 10 wt% Ag (TiAl–10 wt% Ag) by adding solid lubricant Ag into TiAl alloy, and found that the tribological performances of TiAl–10 wt% Ag were excellent at the temperatures of 25–800 °C and better when compared to those of TiAl alloy, TiAl–5 wt% Ag and TiAl–15 wt% Ag.
After the three wear stages of fast wear, stable wear and severe wear,21 the failure of mechanical components was caused due to the excessive wear of materials. It was generally thought that the period of stable wear was in closer relation with the useful longevity of mechanical components when compared to that of fast wear or severe wear. The period of stable wear could be significantly prolonged by shortening the periods of fast wear and severe wear, resulting in the improvement of the useful longevity of materials. To explore the useful longevity of mechanical components (gears and sliding bearings) of TiAl–10 wt% Ag, the tribological behavior of TiAl–10 wt% Ag was discussed at the different wear stages. To the best of our knowledge, the tribological test of 600 min sliding divided into four wear stages according to the obtained friction coefficients and wear rates has been rarely reported. In this study, the tribological behavior of TiAl–10 wt% Ag was discussed at the different four wear stages.
In this study, TiAl–10 wt% Ag was chosen as the material of sliding tribological tests because of its excellent thermal properties and mechanical performance. The friction coefficients and wear rates were continuously obtained during the 600 min sliding wear test. The four wear stages of TiAl–10 wt% Ag were judged by the acquired friction coefficient and wear rate. The tribological behaviors of TiAl–10 wt% Ag at the four different wear stages were respectively analyzed by studying the subsurface hardness of wear scars, wear mechanisms, surface texture of wear scars and cross-section micrographs of wear scars, as well as the distribution of the solid lubricant Ag.
2. Experimental details
2.1 Materials
Spark plasma sintering (SPS) of D.R. Sinter® SPS3.20 apparatus (Sumitomo Coal & Mining, now SPS Syntex Inc.) was adopted to fabricate TiAl–10 wt% Ag (48 at% Ti–47 at% Al–2 at% Cr–2 at% Nb–1 at% B–10 wt% Ag). TiAl–10 wt% Ag consists of Ti (20 μm in average size (IAS), 99.9% in purity (IP)), Al (20 μm IAS, 99.9% IP), B (25 μm IAS, 99.9% IP), Nb (10 μm IAS, 99.9% IP), Cr (10 μm IAS, 99.9% IP) and Ag (74 μm IAS, 99.95% IP). Before the SPS process, the powders of Ti, Al, B, Nb, Cr and Ag were mixed using vibration milling with a frequency of 45 Hz. The mixed powders were loaded into graphite molds with an inner diameter of 25 mm and sintered for 10 min at 1100 °C and 30 MPa in a pure Ar atmosphere for protection. The heating rate of 100 °C min−1 was chosen in this study.2.2 Vicker's microhardness and density
ASTM standard E92-82 was strictly executed to test the Vicker's hardness of TiAl–10 wt% Ag using the Vicker's hardness apparatus of HVS-1000.22 Ten tests were executed to obtain a mean hardness of 5.97 GPa. In accordance with the ASTM standard B962-08,23 the Archimedes' principle was employed to attain a mean density of 4.22 g cm−3.2.3 Tribological test
To explore the tribological behavior of TiAl–10 wt% Ag, the sliding tribological tests were repeatedly carried out on the high temperature tribometer of HT-1000 (Zhong Ke Kai Hua Corporation, China) on the basis of ASTM Standard G99-95.24 At a sliding velocity of 0.5 m s−1 and applied load of 12 N, TiAl–10 wt% Ag with a diameter of 25 mm was rotated against Si3N4 balls of 6 mm diameter. Three tribological tests were tautologically executed for 600 min to acquire the mean wear rate at 45–65% relative humidity. During the 600 min sliding wear test, the friction coefficient was automatically recorded by the computer system of HT-1000. The wear rates of TiAl–10 wt% Ag at the different sliding times were calculated using the formula of wear rate shown in eqn (1):25
 | (1) |
Fig. 1 shows the representative morphologies of the wear scar of TiAl–10 wt% Ag sliding against Si3N4 balls. As shown in Fig. 1, when the measuring stylus of surface profilometer (ST400) was slowly moved across the wear scar along the straight line AA (see 3D profile of the wear scar in Fig. 1a), the coordinate positions of the measuring stylus was continuously recorded to form a 2D cross-section profile (see Fig. 1b). Similarly, three tests were repeatedly executed to acquire the mean cross-section area A of the wear scar. Wear volume V of the wear scar could be calculated using the formula of wear volume V (V = A × L), where A is the cross-section area of the wear scar and L is the perimeter of the wear scar.20
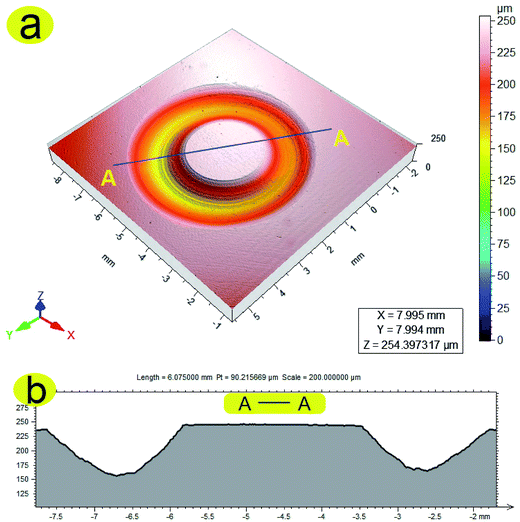 | ||
| Fig. 1 Representative morphologies of the wear scar of TiAl–10 wt% Ag sliding against Si3N4 balls: 3D profile of wear scar (a) and 2D profile of wear scar (b). | ||
2.4 Microstructure analysis
TiAl–10 wt% Ag was examined by XRD with CuKα radiation at the scanning velocity of 0.01° s−1. Cross-section area A of the wear scar was measured by the surface profiler of ST400 (Nanovea). Morphologies of wear scar of TiAl–10 wt% Ag were analyzed by electron probe microanalysis using JAX-8230 (EPMA). The cross-section micrographs of wear scars were obtained by a SIRION 200 field emission scanning electron microscope (FESEM).3. Results and discussion
3.1 Compositions of TiAl–10 wt% Ag
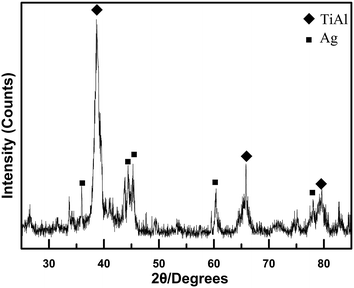
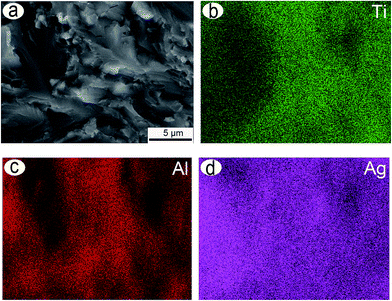
Fig. 2 shows the typical XRD pattern of TiAl–10 wt% Ag fabricated by SPS. As obvious in Fig. 2, TiAl–10 wt% Ag is mainly composed of TiAl and Ag, according to the intensities of different diffraction peaks.Fig. 3 exhibits the microstructure and elemental distribution of the cross-section of TiAl–10 wt% Ag. As shown in Fig. 3, the solid lubricant Ag was uniformly distributed in TiAl–10 wt% Ag.
3.2 Friction coefficient and wear rate
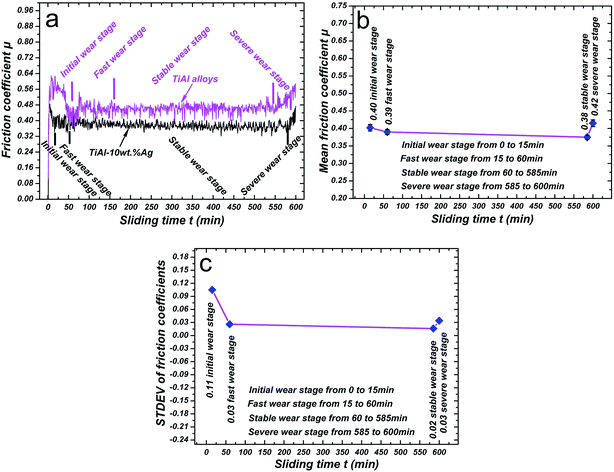
Fig. 4 shows the representative friction coefficients of TiAl–10 wt% Ag at four different wear stages. As shown in Fig. 4a, the smaller friction coefficients of TiAl–10 wt% Ag were obtained as compared to those of TiAl alloy. According to the acquired friction coefficients, the tribological test of 600 min sliding could be approximately divided into the initial wear stage (INITIAL) from 0 to 15 min, fast wear stage (FAST) from 15 to 60 min, stable wear stage (STABLE) from 60 to 585 min and severe wear stage (SEVERE) from 585 to 600 min.Mean friction coefficients and STDEV of friction coefficients continually decreased with increasing sliding time between 0 and 585 min (INITIAL from 0 to 15 min, FAST from 15 to 60 min and STABLE from 60 to 585 min), and then increased with increasing sliding time in the range of 585–600 min (SEVERE from 585 to 600 min). The period of stable wear (from 60 to 585 min) was prolonged up to 525 min because of the existence of solid lubricant Ag as compared to that of 390 min (from 160 to 550 min) for pure TiAl alloy. A smaller mean friction coefficient (0.38) and a lower STDEV (0.02) of friction coefficients were obtained at STABLE as compared to those at INITIAL, FAST and SEVERE.
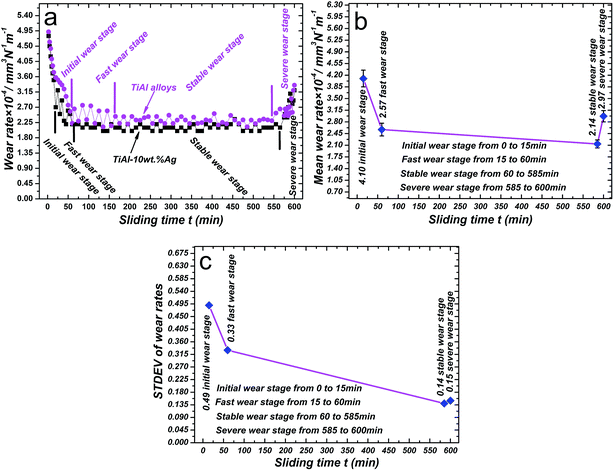
Fig. 5 shows the typical wear rates of TiAl–10 wt% Ag at the four different wear stages. As shown in Fig. 5a, smaller wear rates for TiAl–10 wt% Ag were obtained as compared to those of TiAl alloy. In terms of the acquired wear rates, the tribological test of 600 min sliding was also divided into INITIAL from 0 to 15 min, FAST from 15 to 60 min, STABLE from 60 to 585 min and SEVERE from 585 to 600 min.
Mean wear rate and STDEV of wear rates gradually decreased with increasing sliding time in the range of 0–585 min (INITIAL from 0 to 15 min, FAST from 15 to 60 min and STABLE from 60 to 585 min), and then increased with increasing sliding time in the range of 585–600 min (SEVERE from 585 to 600 min). The smaller mean wear rate of 2.14 × 104 mm3 N−1 m−1 and the lower STDEV of 0.14 were obtained at STABLE.
At STABLE, the excellent tribological behavior of TiAl–10 wt% Ag was obtained due to a smaller friction coefficient, wear rate and STDEV. The period of stable wear (from 60 min to 585 min) was significantly prolonged up to 525 min by the existence of the solid lubricant Ag as compared to 390 min (from 160 to 550 min) for TiAl alloy.
The wear resistance of materials was in proportion to its hardness.26 Subsurface hardness of the wear scar could be continually altered with evolving subsurface microstructures.27 Thus, it was significant to study the effect of subsurface hardness on the tribological performance of TiAl–10 wt% Ag.
3.3 Influence of subsurface hardness of a wear scar on the tribological behavior of TiAl–10 wt% Ag
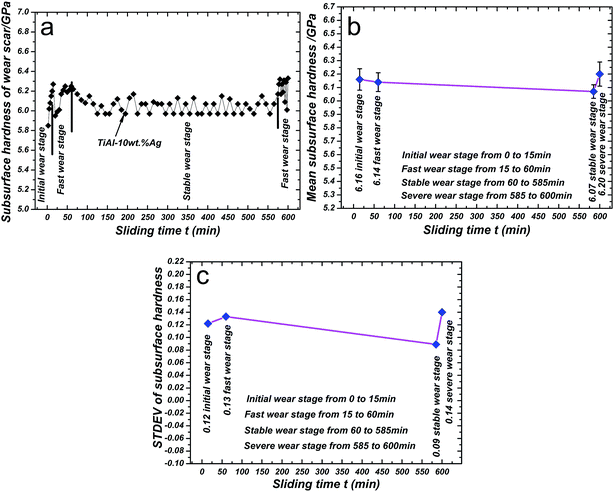
Fig. 6 shows the representative subsurface hardness of a wear scar of TiAl–10 wt% Ag at the four different wear stages. As shown in Fig. 6, the subsurface hardness of the wear scar was studied at all four stages of INITIAL from 0 to 15 min, FAST from 15 to 60 min, STABLE from 60 to 585 min and SEVERE from 60 to 585 min.Mean subsurface hardness and STDEV of subsurface hardness was gradually lowered with increasing sliding time in the range of 0–585 min (INITIAL from 0 to 15 min, FAST from 15 to 60 min and STABLE from 60 to 585 min), and then was significantly improved with increasing sliding time between 585 and 600 min (SEVERE from 585 to 600 min). The small mean subsurface hardness of 6.07 GPa and the smaller STDEV of 0.09 were obtained at STABLE.
When the subsurface hardness of the wear scar was continually improving due to work hardening during the 15 min sliding wear, the friction coefficient and wear rate of TiAl–10 wt% Ag at INITIAL showed a gradual downward tendency. When sliding time was increased from 15 to 60 min, the subsurface hardness of the wear scar at FAST exhibited a gradual upward trend, leading to further improvements in the tribological behavior of TiAl–10 wt% Ag. When the sliding time was increased from 60 min to 585 min, the subsurface hardness of the wear scar showed a slight fluctuation for the smaller STDEV (0.09) of subsurface hardness, resulting in the acquiring of a small friction coefficient and wear rate at STABLE. The subsurface hardness of the wear scar rapidly improved with increasing sliding time from 585 to 600 min, and the tribological behavior of TiAl–10 wt% Ag at SEVERE was significantly lowered. Excellent tribological behavior of TiAl–10 wt% Ag was obtained at STABLE, which was better as compared to those at INITIAL, FAST and SEVERE. Evan et al.26 thought that the lower subsurface hardness of a wear scar corresponded to the high friction coefficient and wear rate. The view of Evan et al. was consistent with our research results at INITIAL and FAST, but was inconsistent with our research conclusions at STABLE and SEVERE. Thus, to obtain a reasonable explanation, the tribological behavior of TiAl–10 wt% Ag was further investigated by analyzing the morphology of a wear scar, the surface texture of a wear scar, the cross-section morphologies of a wear scar and the distribution of the solid lubricant Ag.
3.4 Effect of wear mechanism and surface texture on the tribological behavior of TiAl–10 wt% Ag
Wear mechanisms at the four wear stages could be judged by the morphologies of a wear scar of TiAl–10 wt% Ag. The morphology of the wear scar was examined by the surface texture of the height parameters. The height parameters used in this study mainly contained the arithmetical mean height of surface (Sa), the root mean square height (Sq) and the kurtosis of height distribution (Sku). Mean roughness of the wear scar was measured using the Sa. Standard deviation of the height distribution of the wear scar could be evaluated using the Sq. The flatness of the wear scar was measured by the Sku.Fig. 7 shows a typical electron probe morphology and surface texture of a wear scar of TiAl–10 wt% Ag at INITIAL. As shown in Fig. 7a, massive peeling pits and big grooves exist on the wear scar. It was apparent that the primary wear mechanisms were peeling and ploughing at INITIAL. In Fig. 7b, the poor surface texture of the wear scar was obtained for the high Sa (0.518), Sq (0.478) and Sku (8.166).
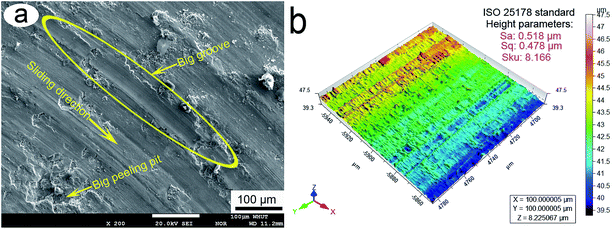 | ||
| Fig. 7 Typical electron probe morphology and surface texture of a wear scar of TiAl–10 wt% Ag at INITIAL: morphologies of the wear scar (a) and surface texture of the wear scar (b). | ||
Fig. 8 shows a representative electron probe morphology and surface texture of a wear scar of TiAl–10 wt% Ag at FAST. Massive abrasive debris and continuous grooves were present on the wear scar at FAST. It was obvious that the dominant wear mechanism was abrasive wear. The surface texture of Sa (0.478), Sq (0.438) and Sku (7.666) was improved at FAST as compared to that at INITIAL.
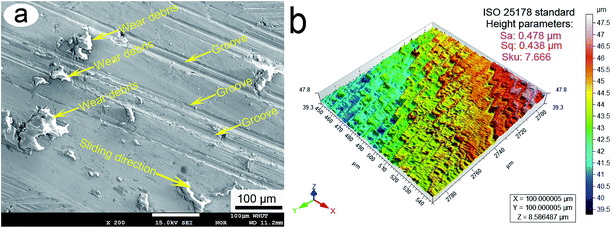 | ||
| Fig. 8 Representative electron probe morphology and surface texture of a wear scar of TiAl–10 wt% Ag at FAST: morphologies of the wear scar (a) and surface texture of the wear scar (b). | ||
Fig. 9 shows a typical electron probe morphology and surface texture of a wear scar of TiAl–10 wt% Ag at STABLE. Small and flat wear debris as well as shallow grooves existed on the smooth wear scar. It is evident that the main wear mechanism was plastic deformation at STABLE. Excellent surface texture was obtained for the smaller Sa (0.398), Sq (0.359) and Sku (6.866) at STABLE.
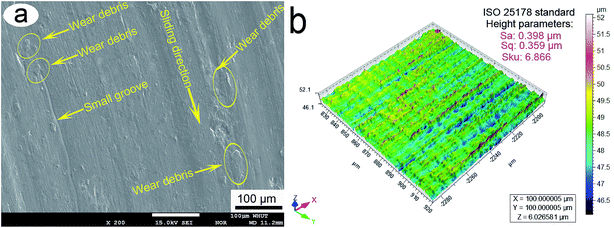 | ||
| Fig. 9 Typical electron probe morphology and surface texture of a wear scar of TiAl–10 wt% Ag at STABLE: morphologies of the wear scar (a) and surface texture of the wear scar (b). | ||
Fig. 10 shows a typical electron probe morphology and surface texture of a wear scar of TiAl–10 wt% Ag at SEVERE. Big peeling and massive wear debris appeared on the wear scar. It is obvious that the primary wear mechanisms are severe peeling and abrasive wear at SEVERE. The poor surface texture of Sa (0.486), Sq (0.445) and Sku (7.865) caused the severe peeling at SEVERE.
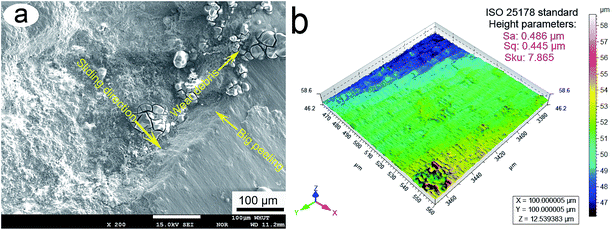 | ||
| Fig. 10 Typical electron probe morphology and surface texture of a wear scar of TiAl–10 wt% Ag at SEVERE: morphologies of the wear scar (a) and surface texture of the wear scar (b). | ||
At STABLE, the wear mechanism of plastic deformation was obtained. The morphology of the wear scar was significantly improved due to the plastic deformation of soft metal Ag during the sliding process, resulting in improvements in the surface texture of the wear scar (Sa (0.398), Sq (0.359) and Sku (6.866)), decreased frictional resistance, and the improving of tribological behavior of TiAl–10 wt% Ag. Thus, excellent tribological behavior of TiAl–10 wt% Ag was acquired at STABLE. To further explore the tribological behavior of TiAl–10 wt% Ag, the cross-section of the wear scar needed to be investigated at the four different wear stages.
3.5 Effect of cross-section of a wear scar on the tribological behavior of TiAl–10 wt% Ag
Fig. 11 shows the representative FESEM micrographs of cross-sections of wear scars of TiAl–10 wt% Ag at the four different wear stages. Fig. 12 exhibits the typical XRD patterns of wear debris obtained at the four different wear stages. At the four different wear stages, the effect of the cross-section morphologies of wear scars on the tribological behavior of TiAl–10 wt% Ag was analyzed.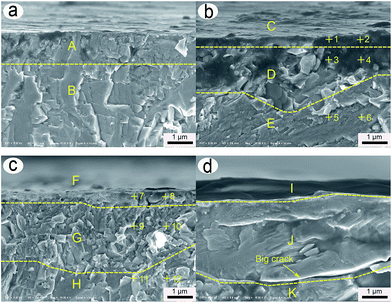 | ||
| Fig. 11 Representative FESEM micrographs of the cross-sections of wear scars of TiAl–10 wt% Ag at the four different wear stages: INITIAL (a), FAST (b), STABLE (c) and SEVERE (d). | ||
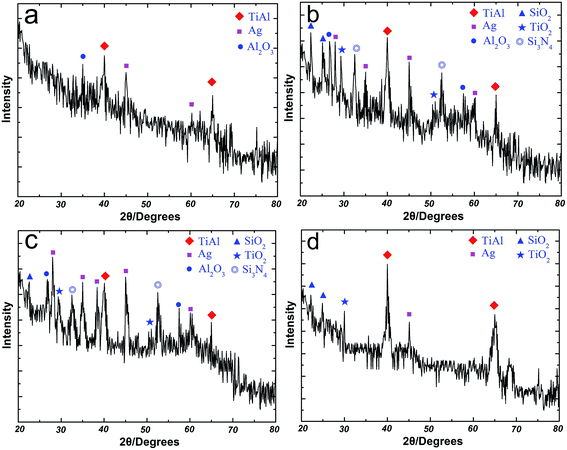 | ||
| Fig. 12 Typical XRD patterns of wear debris obtained at the four different wear stages: INITIAL (a), FAST (b), STABLE (c) and SEVERE (d). | ||
| Element | 1 | 2 | 3 | 4 | 5 | 6 |
|---|---|---|---|---|---|---|
| Ti | 31.24 | 33.67 | 36.76 | 37.66 | 45.97 | 48.89 |
| Al | 22.75 | 20.53 | 27.62 | 25.31 | 38.42 | 37.61 |
| Ag | 46.01 | 45.80 | 35.62 | 37.03 | 15.61 | 13.50 |
| Element | 7 | 8 | 9 | 10 | 11 | 12 |
|---|---|---|---|---|---|---|
| Ti | 14.13 | 16.23 | 43.87 | 42.37 | 47.38 | 46.36 |
| Al | 11.66 | 13.75 | 34.40 | 37.41 | 42.51 | 45.41 |
| Ag | 74.21 | 70.02 | 21.73 | 20.22 | 10.11 | 8.23 |
At STABLE, the lubricant film containing massive amounts of the solid lubricant Ag (see Table 2 and Fig. 11c) was beneficial for the improvement of tribological performance and the lowering of subsurface hardness. The smooth morphology of the wear scar was formed because of the plastic deformation of soft metal Ag. The excellent surface texture of the wear scar was obtained for the smaller Sa (0.398), Sq (0.359) and Sku (6.866). To further study the effect of the lubricant film containing massive amounts of Ag on tribological performance, the distribution of the solid lubricant Ag at STABLE needed to be studied.
3.6 Effect of distribution of the solid lubricant Ag on the tribological behavior of TiAl–10 wt% Ag
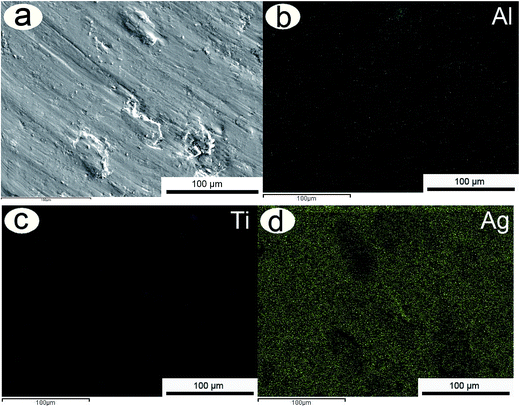
Fig. 13 shows the microstructure and elemental distributions of a wear scar of TiAl–10 wt% Ag at STABLE. As shown in Fig. 13, massive amounts of the solid lubricant Ag was uniformly distributed on the wear scar to form a lubricant film at STABLE. The smooth morphology of the wear scar was formed because of the plastic deformation of Ag during the sliding wear.3.7 Mechanism analysis of TiAl–10 wt% Ag at the four different wear stages
To better analyze the tribological behavior of TiAl–10 wt% Ag, the wear mechanisms needed to be analyzed at the wear stages of INITIAL, FAST, STABLE and SEVERE.Fig. 14 shows the schematic diagrams of the cross-section microstructures of wear scars of TiAl–10 wt% Ag at the four different wear stages. As shown in Fig. 14a, big plough debris appear on the wear scar of TiAl–10 wt% Ag under the wear mechanisms of peeling and ploughing at INITIAL. By the repeating effect of high pressure stress, the compacted layer was gradually formed because of work hardening, resulting in the gradual improvement of subsurface hardness, and the slow lowering of the friction coefficients and wear rates. As clearly observed in Fig. 14b, the big plough debris was refined into small and hard wear debris at FAST. Due to the repeating effect of high pressure stress, the downward trend of small wear debris and the upward tendency of the solid lubricant Ag were obtained because of the plastic deformation of Ag, resulting in the formation of a mixed layer, onset of the abrasive wear mechanism, and improvements to the subsurface hardness of the wear scar. Thus, the tribological behavior of TiAl–10 wt% Ag was improved because of the existence of the mixed layer containing massive amounts of Ag as compared to that at INITIAL. As shown in Fig. 14c, during the sliding process, the solid lubricant Ag was uniformly spread out on the wear scar to form a lubricant film with antifriction and antiwear behaviors. The small wear debris was continuously compacted to form a compacted layer under the effect of high pressure stress. Thus, the main wear mechanism was plastic deformation, and smaller friction coefficients and wear rates were obtained at STABLE. The subsurface hardness of the wear scar was lowered because of the existence of lubricant film containing massive amounts of soft metal Ag. As shown in Fig. 14d, big peeling appears on the wear scar because of the propagation of fatigue crack, and was removed from the wear scar of TiAl–10 wt% Ag by inertial force, leading to the improvement of subsurface hardness of the wear scar, improvements to the friction coefficient and wear rate, and lowering of the stability of the tribological tests.
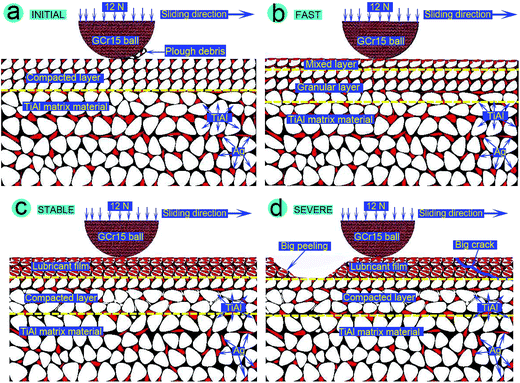 | ||
| Fig. 14 Schematic diagrams of the cross-section microstructures of wear scars of TiAl–10 wt% Ag at the four different wear stages: INITIAL (a), FAST (b), STABLE (c) and SEVERE (d). | ||
In this study, the sliding tribological behavior of TiAl–10 wt% Ag was investigated. In accordance with the obtained friction coefficients and wear rates, the tribological test of 600 min sliding was divided into four wear stages: INITIAL from 0 to 15 min, FAST from 15 to 60 min, STABLE from 60 to 585 min and SEVERE from 585 to 600 min. The tribological behavior of TiAl–10 wt% Ag and the period of stable wear were significantly improved as compared to those of TiAl alloy. At INITIAL, the wear mechanisms of peeling and ploughing were obtained. The subsurface hardness of a wear scar of TiAl–10 wt% Ag gradually improved due to work hardening during the 15 min sliding wear, resulting in the gradual formation of a compacted layer and the slow lowering of the friction coefficient and wear rate. At FAST, the wear mechanism of abrasive wear was acquired. During the sliding tribological test between 15 and 60 min, the hard wear debris showed a downward motion tendency, and the solid lubricant Ag exhibited the upward migration trend due to the plastic deformation of soft metal Ag, thus resulting in the formation of a mixed layer, improvements to subsurface hardness of the wear scar, and improvement of tribological behavior of TiAl–10 wt% Ag. At STABLE, under the condition of the wear mechanism of plastic deformation, the solid lubricant Ag was uniformly spread out on the wear scar to form a lubricant film, and the excellent surface texture of Sa (0.398), Sq (0.359) and Sku (6.866) was obtained, leading to improved contact between TiAl–10 wt% Ag and Si3N4 balls, the lowering of subsurface hardness of the wear scar, decreasing of friction coefficient and wear rate, as well as improving of tribological test stability. At SEVERE, the severe peeling was caused because of the propagation of fatigue cracks during the sliding wear between 585 and 600 min, and the poor surface texture of Sa (0.486), Sq (0.445) and Sku (7.865) was obtained, thus resulting in the lowering of the contact area between TiAl–10 wt% Ag and Si3N4 balls, the destroying of lubricant film, the improving of the subsurface hardness of a wear scar, and improving of friction coefficient and wear rate. Thus, the poor tribological behavior of TiAl–10 wt% Ag was the cause for the propagation of fatigue crack. The friction coefficient and wear rate slowly decreased, and the STDEV of friction coefficients and wear rates gradually lowered with increasing sliding time between 0 and 585 min (INITIAL from 0 to 15 min, FAST from 15 to 60 min and STABLE from 60 to 585 min). The friction coefficient and wear rate, as well as the STDEV of friction coefficient and wear rate, rapidly improved with increasing sliding time between 585 and 600 min (SEVERE from 585 to 600 min). Thus, excellent tribological behavior was obtained because of the existence of a lubricant film at STABLE.
4. Conclusions
In this study, the tribological behavior of TiAl–10 wt% Ag was studied at the four wear stages of INITIAL from 0 to 15 min, FAST from 15 to 60 min, STABLE from 60 to 585 min and SEVERE from 60 to 585 min. The following conclusions were obtained:(1) At INITIAL, the main wear mechanisms of peeling and ploughing were obtained. TiAl–10 wt% Ag was repeatedly squeezed by the effect of high pressure stress, resulting in the strengthening of work hardening and the improving of subsurface hardness of a wear scar, as well as the gradual lowering of the friction coefficient and wear rate.
(2) At FAST, the primary wear mechanism was abrasive wear. The solid lubricant Ag showed an upward tendency during this plastic deformation, and wear debris exhibited a downward trend, leading to the formation of a mixed layer containing massive amounts of Ag, and the gradual lowering of the friction coefficient and the wear rate.
(3) At STABLE, under the condition of the wear mechanism of plastic deformation, the lubricant film provided antifriction and antiwear behaviors, and was formed because of the plastic deformation of the soft metal Ag. The excellent surface texture of Sa (0.398), Sq (0.359) and Sku (6.866) was obtained. The contact area between TiAl–10 wt% Ag and Si3N4 balls was improved, and the frictional resistance was decreased during the sliding wear, thus leading to a lowering of the subsurface hardness of the wear scar, and the improving of the tribological behavior of TiAl–10 wt% Ag.
(4) At SEVERE, the main wear mechanisms were severe peeling and abrasive wear. The lubricant film, with excellent lubricating properties, was gradually destroyed during the propagation of fatigue crack. The poor surface texture of Sa (0.486), Sq (0.445) and Sku (7.865) was obtained. The contact area between TiAl–10 wt% Ag and Si3N4 balls was decreased, and the frictional resistance was improved during the sliding wear, thus resulting in the improving of the subsurface hardness of the wear scar and the lowering of the tribological behavior of TiAl–10 wt% Ag.
(5) The excellent tribological behavior at STABLE was obtained because of the existence of a lubricant film with excellent lubricating property as compared to those at INITIAL, FAST and SEVERE.
(6) The period of stable wear of TiAl–10 wt% Ag was significantly prolonged for the lubricant film with antifriction and antiwear behavior as compared to that of TiAl alloy.
(7) TiAl–10 wt% Ag, because of its excellent tribological behavior, could be chosen as a promising structural material for mechanical components in the aerospace and automotive industries.
Acknowledgements
This study was supported by the National Natural Science Foundation of China (51275370); Self-determined and Innovative Research Funds of WUT (135204008); Fundamental Research Funds for the Central Universities (2015-yb-008 and 2015-zy-051); Authors also wish to thank the Material Research and Testing Center of the Wuhan University of Technology for their assistance.References
- S. Y. Sung and Y. J. Kim, Intermetallics, 2007, 15, 468 CrossRef CAS PubMed.
- X. H. Wu, Intermetallics, 2006, 14, 1114 CrossRef CAS PubMed.
- C. M. Austin, Curr. Opin. Solid State Mater. Sci., 1999, 4, 239 CrossRef.
- F. H. Fores, C. Suryanarayana and D. Eliezer, J. Mater. Sci., 1992, 27, 5113 CrossRef.
- T. Kawabata, H. Fukai and O. Izumi, Acta Mater., 1998, 46, 2185 CrossRef CAS.
- A. Rastkar, A. Bloyce and T. Bell, Wear, 2000, 240, 19 CrossRef CAS.
- C. Li, J. Xia and H. Dong, Wear, 2006, 261, 693 CrossRef CAS PubMed.
- K. Miyoshi, B. Lerch and S. Draper, Tribol. Int., 2003, 36, 145 CrossRef CAS.
- T. Sun, Q. D. Wang, L. Sun, G. H. Wu and Y. Na, Wear, 2010, 268, 693 CrossRef CAS PubMed.
- W. Z. Zhai, X. L. Shi, M. Wang and Z. S. Xu, Tribol. Trans., 2014, 57(3), 416 CrossRef CAS PubMed.
- Z. S. Xu and L. Chen, Tribol. Trans., 2015, 58, 668 CrossRef CAS PubMed.
- D. W. Dareing and S. Atluri, Tribol. Trans., 1997, 40(3), 413 CrossRef CAS PubMed.
- Y. T. Peng and Z. Q. Wang, RSC Adv., 2014, 4, 9980 RSC.
- Y. Zhang, H. Tang, X. R. Ji, C. S. Li, L. Chen and D. Zhang, RSC Adv., 2013, 3, 26086 RSC.
- K. Yang, X. L. Shi, W. Z. Zhai, L. Chen and Q. X. Zhang, RSC Adv., 2015, 5, 44618 RSC.
- Y. Ming, X. Chen, V. P. Lin and Y. W. Dravid, Tribol. Trans., 1993, 36(3), 491 CrossRef PubMed.
- Z. S. Xu, X. L. Shi, Q. X. Zhang and W. Z. Zhai, Tribol. Trans., 2014, 57(6), 1017 CrossRef CAS PubMed.
- Z. S. Xu, B. Xue, X. L. Shi and Q. X. Zhang, Tribol. Trans., 2015, 58, 87 CrossRef CAS PubMed.
- I. Ahmad, A. Kennedy and Y. Q. Zhu, Wear, 2010, 269, 71 CrossRef CAS PubMed.
- X. L. Shi, Z. S. Xu, M. Wang, W. Z. Zhai and J. Yao, Wear, 2013, 303(1–2), 486 CrossRef CAS PubMed.
- Y. M. Xu, H. F. Zuo and M. Zheng, Journal of Computational Information Systems, 2013, 9(11), 4239 Search PubMed.
- ASTM E92-82, Standard test method for vickers hardness of metallic materials, ASTM International, 2003 Search PubMed.
- ASTM B962-08, Standard test methods for density of compacted or sintered powder metallurgy (PM) products using Archimedes' principle, ASTM International, 2008 Search PubMed.
- ASTM G99-95, Standard test method for wear testing with a pin-on-disk apparatus, ASTM International, 1995 Search PubMed.
- R. D. Tyagi, S. Xiong and J. L. Li, Wear, 2011, 270, 423 CrossRef CAS PubMed.
- G. Evan, B. J. Hockey and R. W. Rice, The science of ceramics machining and surface finishing, US Govt. Printing Office, 1979, p. 1 Search PubMed.
- C. Rynio, H. Hattendorf, J. Klöwer and G. Eggeler, Wear, 2014, 315, 1 CrossRef CAS PubMed.
| This journal is © The Royal Society of Chemistry 2015 |

