
Ultrathin tungsten oxide nanowires: oleylamine assisted nonhydrolytic growth, oxygen vacancies and good photocatalytic properties†
Fenglin Liua,
Xianjie Chena,
Qinghua Xiaa,
Lihong Tian*ab and
Xiaobo Chen*b
aHubei Collaborative Innovation Center for Advanced Organochemical Materials, Ministry-of-Education Key Laboratory for the Synthesis and Applications of Organic Functional Molecules, Hubei University, Wuhan 430062, China. E-mail: tian7978@hubu.edu.cn
bDepartment of Chemistry, University of Missouri – Kansas City, Kansas City, Missouri 64110, USA. E-mail: chenxiaobo@umkc.edu
First published on 7th September 2015
Abstract
Ultrathin tungsten oxide nanowires with diameter of around 1.1 nm have been fabricated through a simple oleylamine (OA) assisted nonhydrolytic process. In the process, the amount of OA, reaction temperature and time impacted on controlling the formation of tungsten oxide ultrathin nanowires. At high W/OA molar ratios (>1![[thin space (1/6-em)]](https://www.rsc.org/images/entities/char_2009.gif) :1), oriented attachment of OA molecules resulted in the preferential growth of nanowires along the [001] direction. At low W/OA molar ratios, small nanoparticles self-assembled into ultrathin nanowires. The ultrathin tungsten oxide nanowires exhibited a high photocatalytic activity for the degradation of Rhodamine B under visible light, likely due to their enhanced visible-light absorption and the presence of oxygen vacancies.
:1), oriented attachment of OA molecules resulted in the preferential growth of nanowires along the [001] direction. At low W/OA molar ratios, small nanoparticles self-assembled into ultrathin nanowires. The ultrathin tungsten oxide nanowires exhibited a high photocatalytic activity for the degradation of Rhodamine B under visible light, likely due to their enhanced visible-light absorption and the presence of oxygen vacancies.
1. Introduction
Photocatalytic oxidation technology utilizing solar energy has attracted increasing interest in decomposing various environmental contaminants.1 Compared with TiO2, the most popular photocatalyst, tungsten oxide can extend the absorbance to the blue region of the solar spectrum, as it has a band gap energy of around 2.4–2.8 eV (ref. 2) and its deep valence band edge (3.1 eV) is much more positive than the H2O/O2 oxidation potential and suitable for photo-oxidising organic pollutants under visible light.3 Nevertheless, conduction band level of WO3 (0.5 eV vs. NHE) is more positive than the potential for the single-electron reduction of oxygen, leading to the low light energy conversion efficiency because of high recombination of excited electrons and holes.4 Up to now, several approaches have been taken to solve the problem: such as platinum loading to induce a multielectron O2 reduction;5 carbon materials (carbon nanotube and graphene) composites to improve the photocatalytic activity by forming W–C bond to benefit the electron transfer;6 advanced nanoarchitecture tuning to increase surface area and pores, etc.7One-dimension (1D) nanomaterials, such as nanowires, nanobelts and nanorods are one of the hot research topics in modern materials science, chemistry, and physics, due to their high surface area, reduced grain boundaries, direct charge transfer pathways, and strong quantum size effects.8 Especially, the short charge diffusion length and more reactive sites in ultrathin nanowires bring in fantastic properties in photocatalysis.9 Non-hydrolytic approaches have been successfully taken to control the morphology, dimensions and particle size of nanomaterials. Recently, some achievements on ultrathin nonstiochiometric tungsten oxide was also obtained through it, particularly, W18O49 nanowires. For instance, Moshofsky et al. synthesized the nonstiochiometric tungsten oxide nanowires with diameter of 1–4 nm by controlling the ratios of W(CO)6, octadecanol and octadecene.10 Ye et al. obtained W18O49 nanowires with diameter of 0.9 nm with WCl6 precursor in ethanol.11 Niederberger and co-workers achieved the preferential growth of W18O49 along [010] direction and obtained nanowires with a diameter of 1.3 nm with deferoxamine coordinating with tungsten atoms.12 However, controlled synthesis of ultrathin tungsten oxide nanowires with the diameter closing to one cell unit size (<2 nm) is of great interest for enhancing photocatalytic activity. Moreover, it is also vital to clarify their growth mechanism for extending their applications.
In this work, we presented an oleylamine (OA)-assisted synthesis of ultrathin tungsten oxide nanowires in benzyl alcohol (BA) solution. Three critical factors, the amount of oleylamine, reaction temperature and time, were investigated to figure out the growth mechanism of ultrathin nanowires in detail. The diameter of nanowires could be reduced to around 1 nm and the length could reach several micrometers. Moreover, the photocatalytic performance of ultrathin nanowires was also studied in visible light region.
2. Results and discussion
2.1 XRD patterns and Raman spectra
The simple one-spot synthesis with tungsten chloride in benzyl alcohol resulted in the formation of a yellow-green powder (reference sample), which was characterized by XRD and shown in Fig. 1a. The sharp and intensive peaks indicated a highly crystalline nanostructure. The obvious diffractive peaks with 2θ at 23.1°, 23.7°, 24.2°, 34.1° corresponded to the (002), (020), (200), and (202) crystal planes of monoclinic phase of WO3 with lattice parameters of a = 7.297, b = 7.539, and c = 7.688 Å (JCPDS no. 43-1035),13 respectively, which is different from Niederberger's report.14 Interestingly, with the addition of oleylamine and when the molar ratio of WCl6 to OA was 0.5, only the diffractive peaks of (002) plane was observed and the other reflections were much weak, thus manifesting tungsten oxide nanowires selectively grew along the [002] direction.15 Here, it was difficult to assign the nanowire to special crystal structure from XRD pattern because amount of stoichiometric or nonstoichiometric tungsten oxide had rather similar structure.16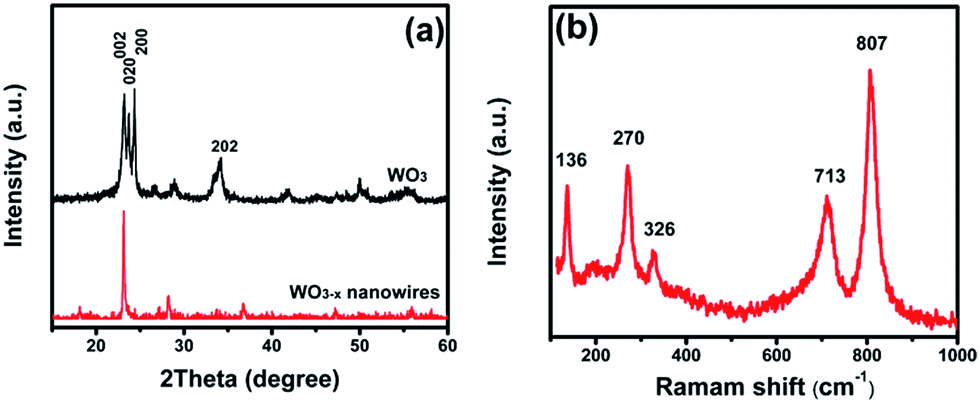 | ||
| Fig. 1 (a) XRD patterns of WO3 (reference sample) and WO3−x (1–2) nanowires, and (b) Raman spectrum of the WO3−x (1–2) nanowires. | ||
The Raman spectrum of the tungsten oxide nanowires is shown in Fig. 1b. The strong and well-defined bands at 807, 713, 326, 270 cm−1 could be assigned to monoclinic tungsten oxide, which could support the XRD results. The bands at 270 cm−1 corresponded to O–W–O bending modes, and the bands at 713 and 807 cm−1 were ascribed to the stretching modes of the W–O–W.17 The relatively strong peak observed at low frequency (136 cm−1) and the weak band at 326 cm−1 were attributed to the O–O deformation and W–O deformation modes, respectively,18 indicating the anisotropic atoms aligning on the surface of nanowires.
2.2 XPS and FT-IR spectra
XPS spectra were conducted to detect the surface composition and valence of elements in tungsten oxide nanowires. It can be seen from Fig. 2a that W and O were the main constituent elements and carbon probably came from the impurity of XPS detect and residual organic molecule. The W 4f XPS spectra in Fig. 2b presented two strong peaks at the binding energy of 35.3 eV and 37.3 eV matched well with reported values of the W6+ oxidation state for WO3 nanosheets,19 whereas a distinct difference shown in the fitted curves of WO3−x nanowires that two peaks corresponding to W6+ shifted to much higher binding energy (35.8 eV and 37.8 eV), indicating the presence of W–O–N bond.20 The linkage of W atoms and oleylamine (W–O–N) likely induced the charge imbalance of W–O and resulted in the surface defect, even the color change (see following UV-vis DRS results). More importantly, two peaks occurred at relatively low binding energy (34.8 eV and 33.3 eV), revealing the existence of W5+ and W4+ in nanowires, accompanying with the appearance of oxygen vacancy.21 Also, an obvious difference was shown in Fig. 2c: the O 1s spectrum of WO3 nanosheets demonstrated the obvious peaks ascribed to lattice oxygen (530.0 eV) and the hydroxyl groups (532.0 eV). Unlike WO3 nanosheets, the band of lattice oxygen up-shifted to 530.7 eV and a new peak at 528.7 eV was possibly attributed to the W–O–N bond. The shifts of both W 4f and O 1s in nanowires indicated that the chemical environment of W and O atoms in nanowires changed compared with that in WO3 nanosheets and likely resulted in the deformation of W–O and O–O bond, coincident with the Raman investigation.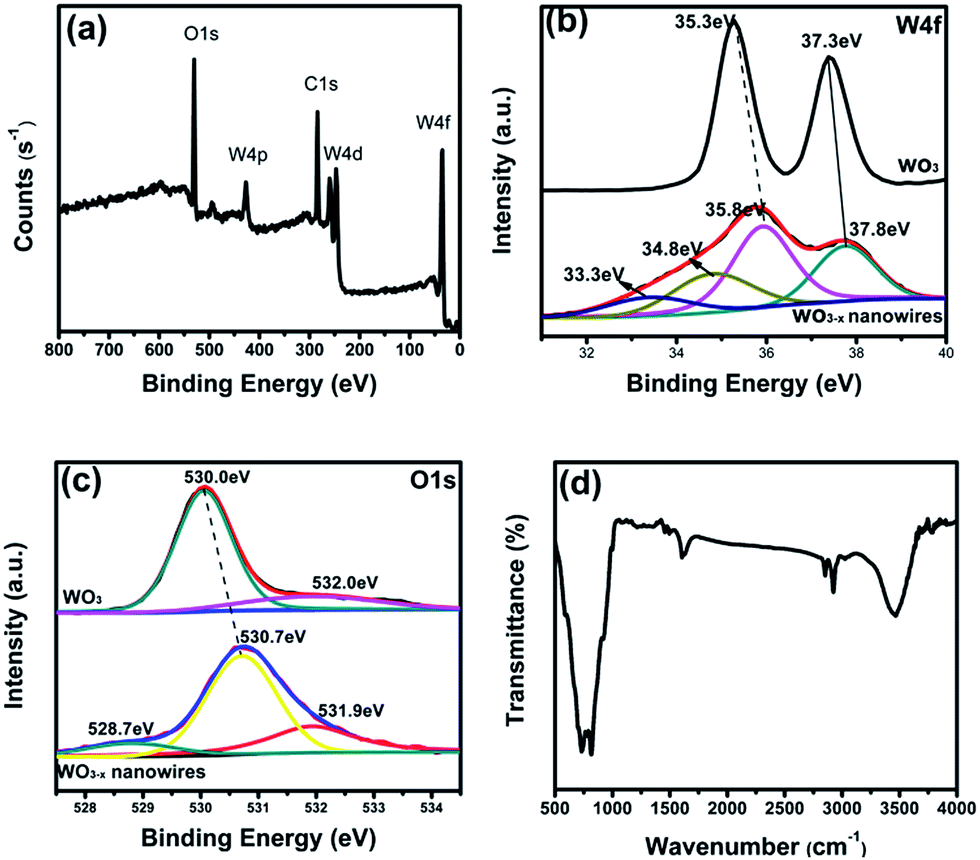 | ||
| Fig. 2 (a) The whole spectroscopy of WO3−x (1–2) nanowires, (b) W 4f and (c) O 1s XPS spectra of WO3 (reference sample) and WO3−x (1–2) nanowires, (d) FT-IR spectrum of WO3−x (1–2) nanowires. | ||
The FT-IR spectrum of tungsten oxide nanowires was shown in Fig. 2d. The strong bands in the region of 1000–500 cm−1 were assigned to the characteristic stretching vibrations of W–O (950 cm−1) units and the bridging oxygen atoms O–W–O (600–780 cm−1).22 The peaks at 1626 and 3400 cm−1 came from the physically adsorbed water and the hydroxyl groups. Two vibrations at 2921 cm−1 and 2844 cm−1 were attributed to the –CH3 and –CH2 stretching vibrations, indicating the presence of residual oleylamine molecule on the surface of tungsten oxide.
2.3 Morphology and structure
For further investigate the structure of WO3−x nanowires, TEM and HRTEM micrographs were performed and shown in Fig. 3. The reference sample WO3 synthesized by benzyl alcohol route was nanosheets with size of 100–200 nm (Fig. 3a). Nevertheless, WO3−x nanowires were achieved with the control of oleylamine (Fig. 3b). The diameter of nanowires was uniform and around 1.9 nm, but the length, from 200 nm to several micrometers, could not be estimated accurately on account of the twisted bundles in Fig. 3b. Also, the clear lattice fringes in Fig. 3c (HRTEM) verified the highly crystalline tungsten oxide nanowires. An interplanar d-spacing of 0.383 nm should be ascribed to (002) crystal plane of monoclinic WO3, revealing nanowires grew along the c axis (Fig. 3d), which was in good agreement with the XRD results. The selected area electron diffraction pattern in the inset only showed one intense diffraction ring, corresponding to the 002 reflection of the WO3−x nanowires. All other diffuse and broad diffraction rings were attributed to the much weak reflections. The electron-induced X-ray fluorescence (EDX) analysis was employed to determine the composition of the tungsten oxide nanowires (see ESI Fig. S1†). There were oxygen, tungsten and carbon elements existed in the nanowires. The signal of carbon probably came from the residual organic compound.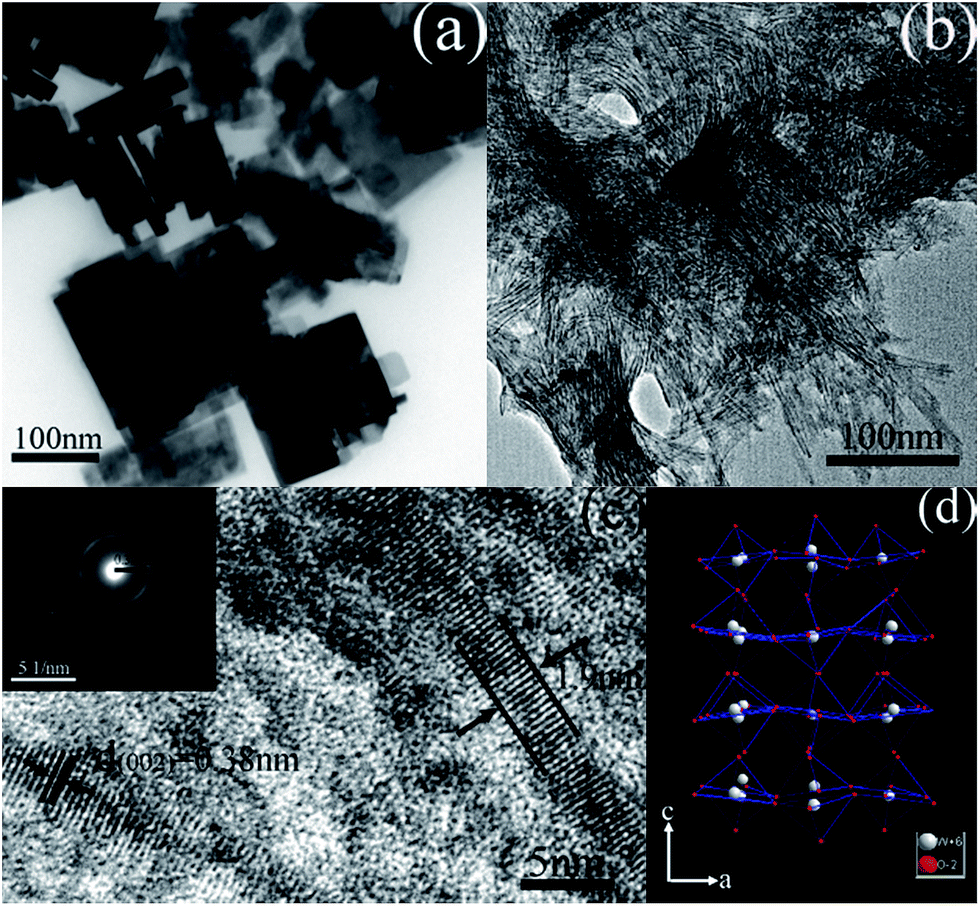 | ||
| Fig. 3 (a) TEM image of WO3 (reference sample), (b) TEM image of WO3−x (1–2) nanowires, (c) HRTEM micrograph, and SAED pattern (the inset) of WO3−x (1–2) nanowires, and (d) schematic representation of monoclinic WO3 along c axis. | ||
2.4 TG-DTA analysis
The thermal behaviour of the samples was studied by TG-DTA analyses in an air atmosphere with a heating rate of 10 °C min−1 and displayed in Fig. 4. The weight loss up to 350 °C might be assigned to desorption of surface-adsorbed water, structural water elimination and physically adsorbed organic molecule for both samples.23 It is noteworthy that WO3 (1–2) nanowires showed a dramatic weight loss about 17% compared to that of WO3 nanosheets between 350–500 °C, attributed to the loss of surface capped OA molecule.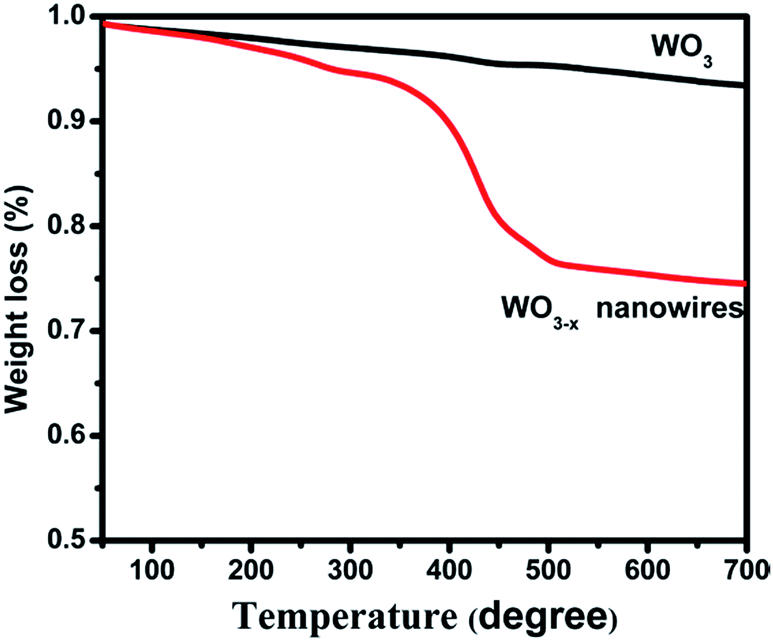 | ||
| Fig. 4 TG-DTA curves of the WO3 (reference sample) and WO3−x (1–2) nanowires. | ||
2.5 Growth of WO3−x nanowires
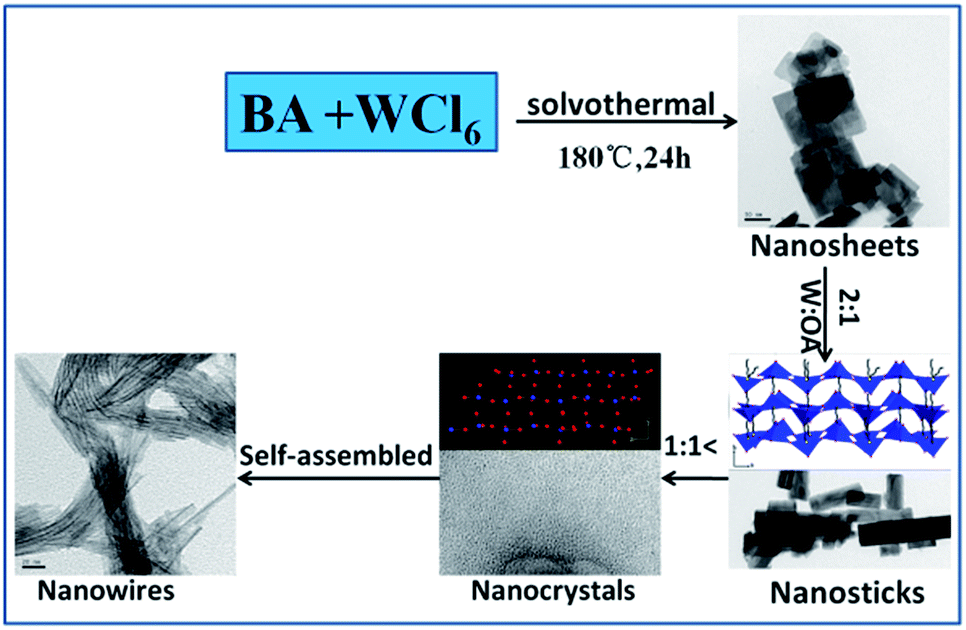
It is known that the synthesis of nanostructure usually encounters with many sensitive reaction parameters. In order to clarify the growth mechanism of WO3−x nanowires, three main factors, the concentration of oleylamine, reaction temperature and time, are investigated in detail here.Using benzyl alcohol (BA) as the solvent and WCl6 as the precursor, the controllable synthesis of tungsten oxide nanowires could be achieved by straightforward solvothermal method with the aid of OA. Fig. 5 clearly demonstrated the morphology transfer of tungsten oxide from nanosheets to nanowires with increasing the amount of oleylamine. WO3 nanosheets assembled by small grains were obtained via benzyl alcohol route under the condition of 180 °C and 24 h (Fig. 5a). However, with low concentrations of OA (i.e. molar ratio of W:OA = 2:1), nanosticks with widths of 15–30 nm and lengths of around 63–200 nm were formed, and moreover, the surface of nanosticks were crude (Fig. 5b). At higher OA concentrations, such as molar ratio of W:OA = 1:1, it seemed that nanosticks were stripped into the nanowires gradually and some short wires were visible in Fig. 5c. When the molar ratio reached 1:1.5, uniform nanowires were formed with the diameter of about 1.1 nm and length of 100 nm (Fig. 5d), which was roughly same to the length of nanosticks in Fig. 5b. Much longer nanowires (>300 nm) grew at the molar ratio of W:OA = 1:2, but the diameter did not change (Fig. 5e). Nanowires began to be cut into short segments with the excess OA content (W:OA = 1:2.5) (Fig. 5f). Accordingly, oleylamine contributed to the formation of ultrathin tungsten oxide nanowires, and their diameter and length could be tailored by simply adjusting the molar ratio of WCl6 to OA.
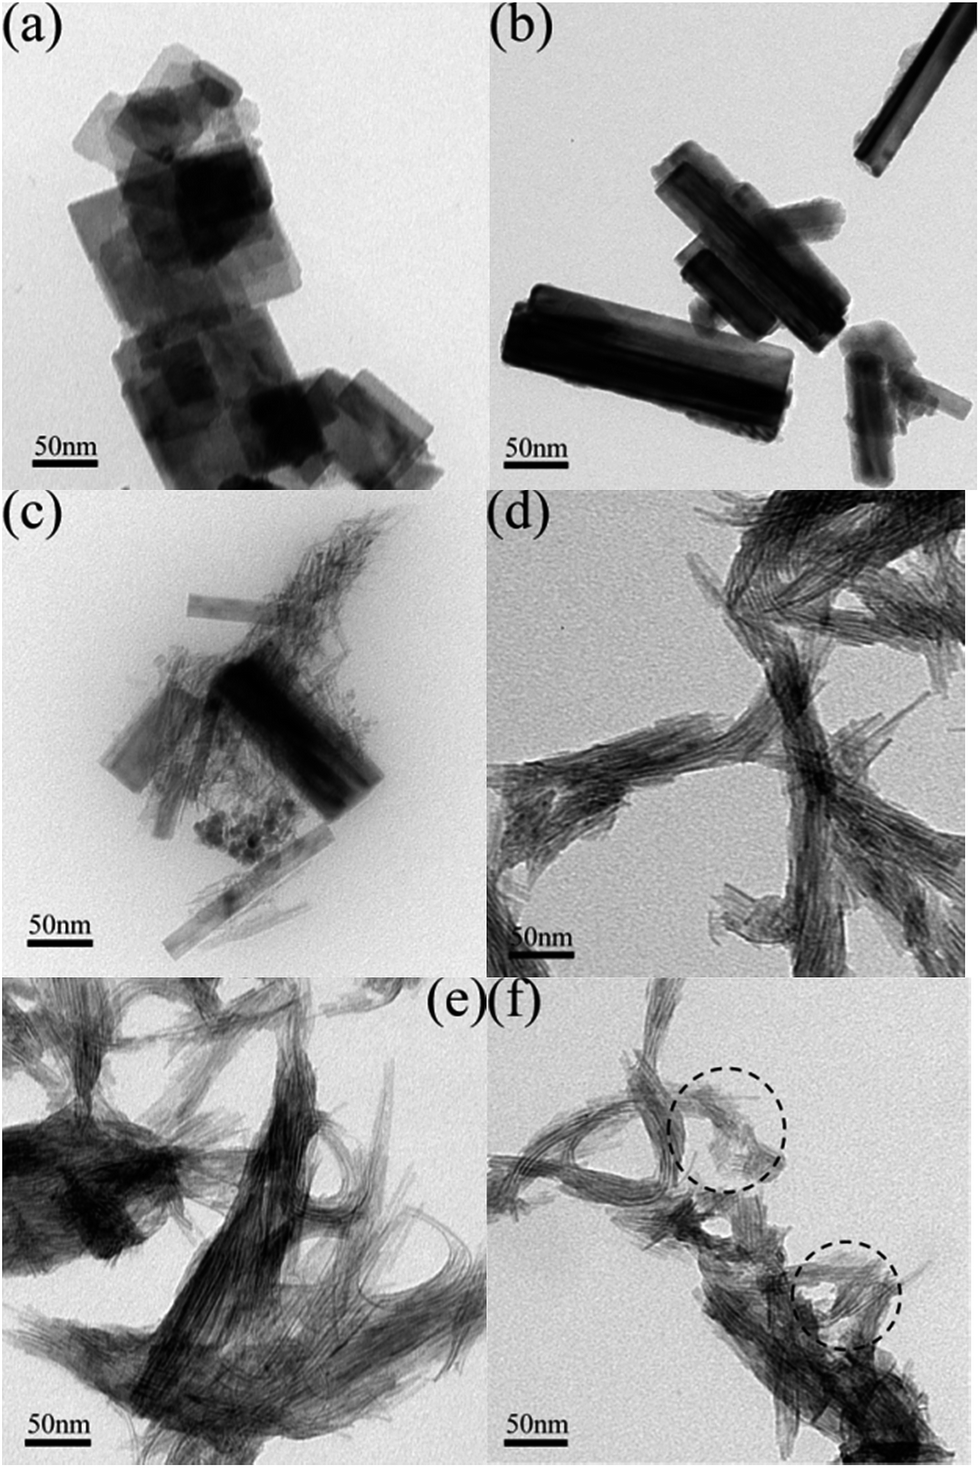 | ||
| Fig. 5 TEM images of all tungsten oxide synthesized with different molar ratio of WCl6 to OA at 180 °C, 24 h. (a) Without OA, (b) W:OA = 2:1, (c) W:OA = 1:1, (d) W:OA = 1:1.5, (e) W:OA = 1:2, and (f) W:OA = 1:2.5. | ||
In addition, an interesting shift of XRD diffractive peaks of tungsten oxides took place in the presence of oleylamine (see the ESI Fig. S2†). At the low OA concentration (molar ratio of W:OA = 2:1), the main diffractive peaks of (002), (020) and (200) shifted 4° to low diffraction angle, indicating the OA molecule entered into the crystal lattice and likely resulting in the lattice expansion of tungsten oxide. With the increasing of OA concentration, the peaks ascribed to (020) and (200) planes wore off and the (002) peak intensified, ultimately monoclinic WO3−x nanowires grew.
Also, the effects of reaction time and temperature on the formation of nanowires were studied at the condition of W:OA = 1:2 (molar ratio) to figure out the optimal growing condition of tungsten oxide nanowires. We found that reaction time impacted the length of nanowires. As shown in Fig. 6, after the solvothermal reaction for 6 h at 180 °C, only short WO3 nanorods with an average length of 20–50 nm accompanying nanoparticles formed (Fig. 6a); the 18 h reaction led to slightly longer WO3−x nanowires and small amount of them attained 160 nm (Fig. 6b); growth for 24 h produced nanowires with length > 300 nm (Fig. 5e). However, the longer reaction time (i.e. 30 h) resulted in the nanowires tangled with each other (Fig. 6c). In addition, relatively low temperature brought about tungsten oxide bundles (Fig. 6d), which was likely related to high boil point of OA and not fully extended C–C chain in low temperature.24
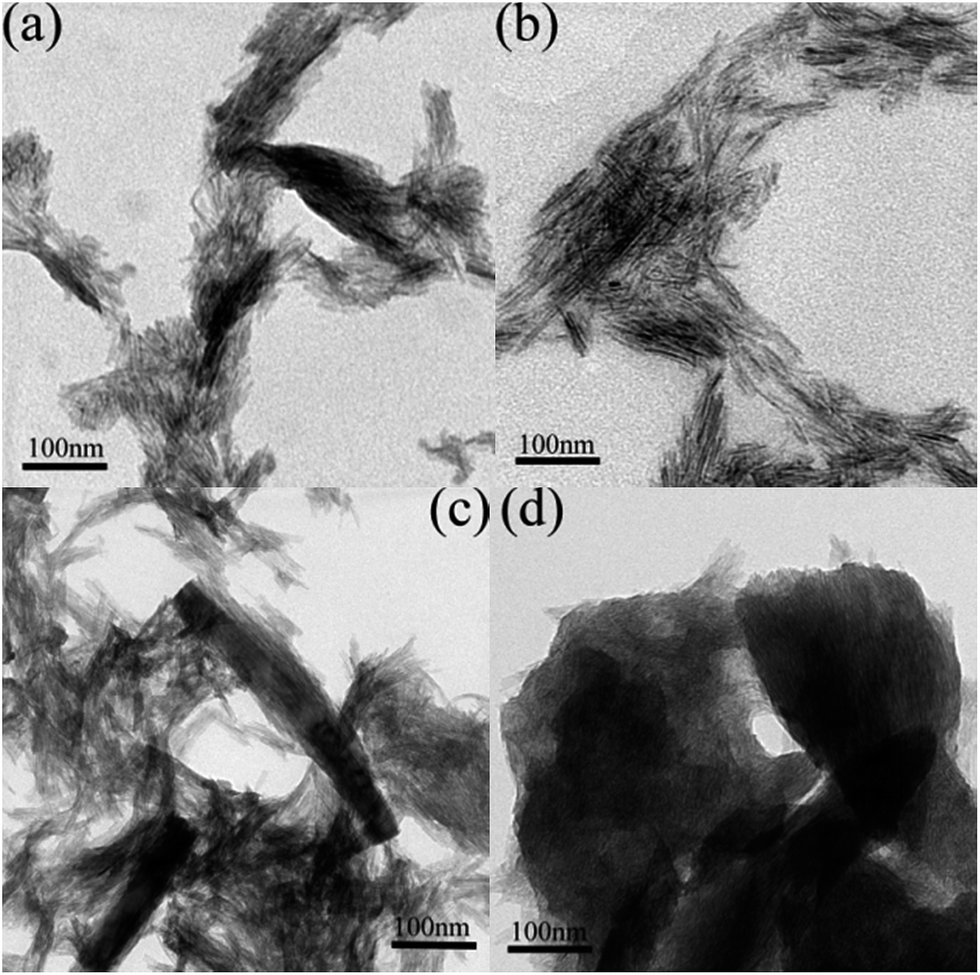 | ||
| Fig. 6 TEM images of WO3 (1–2) synthesized with different reaction time and temperature at 180 °C. (a) 6 h, (b) 18 h, (c) 30 h, (d) at 150 °C, 24 h. | ||
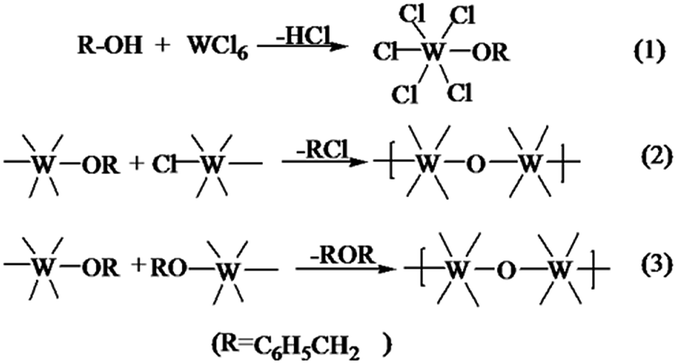
Benzyl alcohol solvent has been proven to provide a decent environment to synthesize and tailor the shape and structure of metal oxide nano-architectures with the help of organic capping regents.25 In our experiments, byproducts, benzaldehyde (m/z = 106), benzyl chloride (m/z = 126) and benzyl ether (m/z = 198), were detected (GC-MS results). Accordingly, the growth of tungsten oxide underwent the process that WCl6 reacted with benzyl alcohol firstly to produce the tungsten alkoxide, then the condensation of tungsten alkoxide to form W–O–W unit, thus WO3 nanosheets emerged. This process is proposed as follows:
It was similar to the other reported synthesis of metal oxide by nonhydrolytic method.26 However, in the presence of oleylamine, the preferential growth direction of tungsten oxide surprisingly changed. So it is interesting to see through the growth pathway of nanowires clearly. Based on the above results and the crystal structure of monoclinic WO3, we inferred that oriented attachment of OA molecule on the (020) plane of monoclinic WO3 was responsible to the tungsten oxide nanowires, as a large number of tungsten atom centrally located in (020) plane and oxygen atom mainly distributed in the cross section of (002) and (200) planes (see the ESI Fig. S3†). As shown in Scheme 1, at low OA concentration, OA molecule inserted into lamellar spacing and coordinated with the W atom in (020) plane, limiting the crystal growth along b axis at a certain extent, thus leading to the nanosticks (Fig. 5b). While increasing the amount of OA molecule could destroy the nanosticks because of the strong mutual repulsion between the long C–C chains of OA, and prevent the formation of W–O–W unit along a axis due to the coordination of W atoms and OA. Consequently, small nanocrystals produced and self-assembled into ultrathin nanowires along c axis. This could be confirmed by TEM image of nanowires in formamide, where only small uniform nanoparticles can be observed (see ESI Fig. S4†).
 | ||
| Scheme 1 The proposed growth process of WO3−x nanowires. | ||
2.6 Photocatalytic activity of WO3−x nanowires
The photocatalytic activity of WO3−x nanowires was evaluated by the photodegradation of RhB dye under visible light irradiation. As seen from Fig. S5a (see ESI†), WO3 nanosheets showed very poor visible-light photocatalytic activity. The obtained products in the presence of OA manifested only slightly enhanced activity until the molar ratio of W:OA attained the 1:1.5, that is, ultrathin nanowires presented the significantly increased photoactivity under visible light. Apparently, the ultrathin WO3 (1–2) nanowires with diameter about 1.1 nm showed the highest photocatalytic activity of WO3−x nanowires. In our experiment, BET surface area is not the main contribution to the high photocatalytic activity because nanowires showed a relatively low BET surface area compared with reference WO3 nanosheets (see the ESI Table S1†), which likely related to the capped OA molecule on the surface WO3−x nanowires. Thus, the high photocatalytic activity possibly ascribed to the enhanced absorption and oxygen vacancy. As shown in Fig. S5b (see ESI†), all samples obtained with the existence of OA had enhanced absorption in visible light region, matching with the color change from yellow-green to blue. Moreover, it is noted that all tungsten oxide nanowires (W:OA < 1:1.5) exhibited a tailed absorption, likely indicating the existence of oxygen vacancy on nanowires. They can likely promote the enhanced absorption and separation of electrons and holes and led to the enhanced photocatalytic activity.27
3. Experimental section
3.1 Synthesis of ultrathin tungsten oxide nanowires
The tungsten oxide nanowires were synthesized by OA assisted solvothermal method. All chemicals were of analytical grade and used without further purification. Briefly, 0.8 g WCl6 was quickly placed into mixed solution of 40 mL benzyl alcohol and a desired content of OA by vigorously stirring. The color of solution changed from yellow to dark blue. Subsequently, the solution was transferred into a Teflon-lined, stainless autoclave at 180 °C for 24 h. The powders were washed with acetone, absolute ethanol and deionized water several times, then dried at 70 °C for a day. The final product was collected and denoted as WO3−x (a–b), wherein a–b is the molar ratio of WCl6 to OA. The reference WO3 sample was prepared under the same condition without oleylamine.3.2 Characterizations
The crystalline structure of as-prepared samples was determined by X-ray powder diffraction (XRD, Bruker D8 advance), with Cu Kα radiation (λ = 1.54 Å) at the scan rate of 5° min−1 with a step of 0.02°. Morphologies of samples were studied by transmission electron microscopy (TEM, FEI, Tecnai G20) and a JEM-2100UHR high-resolution transmission electron microscope (HRTEM). X-ray photoelectron spectroscopy (XPS) measurements were carried out using a VG Multilab 2000 spectrometer with an Al Kα X-ray source (Thermo Electron Corporation), and all the spectra were calibrated to the C 1s peak at 284.6 eV. The UV-vis diffuse reflection spectra were obtained for the dry-pressed disk samples on a UV-vis spectrophotometer (UV-2550) by BaSO4 as the reflectance sample. Raman spectra were recorded on a laser micro-Raman spectrometer (Invia, Renishaw). Fourier transform infrared spectroscopy (FT-IR) spectra were obtained on a Nicolet IS10 spectroscope to investigate the surface organic species on all tungsten oxide. Simultaneous thermogravimetric and differential thermal analyses (TGA/DTA) of the samples were performed on a thermal analyzer (SDT Q600) in air with a heating rate of 10 °C min−1 in air atmosphere. Gas chromatography-mass spectrometry (GC/MS, QP2010, Ultra) was used to analyzed the by-products in the nonhydrolytic synthesis. BET surface area of samples was performed on a surface area and porosity analyzer (GWGB SCI & TECH, BK112T). Prior to the BET analysis, the powder samples were degassed at 200 °C for 2 h to remove the adsorbed H2O from the surface.3.3 Photocatalytic test
The photocatalytic performance of all samples was evaluated by degrading Rhodamine B (RhB) using a 300 W high-pressure xenon lamp (CEL-HXF300). In a typical experiment, 10 mg of photocatalysts were suspended in 50 mL of 10 mg L−1 RhB aqueous solution. Before light irradiation, the suspension was sonicated for 30 min and stirred for an hour in the dark to ensure the establishment of the adsorption/desorption equilibrium of RhB on the catalyst surface. Then, the solution was placed in a quartz reaction vessel and bubbled with air. At given time intervals, 5 mL solution was taken out and centrifuged. The concentration of RhB was monitored by colorimetry using a UV-vis spectrophotometer (UV-2550).4. Conclusions
In conclusion, we have successfully prepared ultrathin tungsten oxide nanowires with the aid of OA. The molar ratio of WCl6 to OA played an important role on controlling the formation of tungsten oxide nanowires. At low OA concentration, OA selectively attached on the (020) plane of monoclinic WO3, resulting in WO3 nanosheets changed into nanosticks. However, when the molar ratio of W:OA < 1:1.5, small nanocrystals self-assembled into ultrathin nanowires. Reaction time only decided the length and temperature had a significant effect on the dispersion of nanowires, thus the optimal reaction condition is that molar ratio of W:OA = 1:2, 180 °C for 24 h to obtain uniform tungsten oxide nanowires with the diameter of around 1.1 nm and length of several micrometers. In addition, ultrathin tungsten oxide nanowires exhibited larger absorption in visible light than WO3 nanosheets and high photocatalytic performance on degradation of RhB under visible light.
Acknowledgements
L. Tian gratefully acknowledges the support from National Natural Science Foundation of China (No. 51302072), Natural Science Foundation of Hubei Provincial Department of Education (No. Q20131010), Natural Science Fund for Creative Research Groups of Hubei Province of China (No. 2014CFA015). X. Chen thanks the support from College of Arts and Sciences, University of Missouri – Kansas City and the University of Missouri Research Board.Notes and references
- (a) M. R. Hoffmann, S. T. Martin, W. Choi and D. W. Bahnemannt, Chem. Rev., 1995, 95, 69 CrossRef CAS; (b) X. Chen, S. Shen, L. Guo and S. S. Mao, Chem. Rev., 2010, 110, 6503 CrossRef CAS PubMed.
- (a) Z. Zhao and M. Miyauchi, Angew. Chem., 2008, 120, 7159 CrossRef PubMed; (b) X. Chen and S. S. Mao, Chem. Rev., 2007, 107, 2891 CrossRef CAS PubMed.
- R. Abe, H. Takami, N. Murakami and B. Ohtani, J. Am. Chem. Soc., 2008, 130, 7780 CrossRef CAS PubMed.
- D. E. Scaife, Solar Energy, 1980, 25, 41 CrossRef CAS.
- (a) J. W. Liu, J. H. Zhu, C. L. Zhang, H. W. Liang and S. H. Yu, J. Am. Chem. Soc., 2010, 132, 8945 CrossRef CAS PubMed; (b) J. Kim, C. W. Lee and W. Choi, Environ. Sci. Technol., 2010, 44, 6849 CrossRef CAS PubMed.
- (a) L. Tian, L. Ye, J. Liu and L. Zan, Catal. Commun., 2012, 17, 99 CrossRef CAS PubMed; (b) O. Akhavan, M. Choobtashani and E. Ghaderi, J. Phys. Chem. C, 2012, 116, 9653 CrossRef CAS.
- (a) H. Zheng, J. Z. Ou, M. S. Strano, R. B. Kaner, A. Mitchell and K. Kalantar-zadeh, Adv. Funct. Mater., 2011, 21, 2175 CrossRef CAS PubMed; (b) B. Moshofsky and T. Mokari, Chem. Mater., 2013, 25, 1384 CrossRef CAS.
- (a) S. Hu and X. Wang, Chem. Soc. Rev., 2013, 42, 5577–5594 RSC; (b) T. Ruecks, K. Kim, E. Joselevich, G. Y. Tseng, C. Cheung and C. M. Lieber, Science, 2000, 289, 84 Search PubMed.
- M. H. Huang, S. Mao, H. Feick, H. Yan, Y. Wu, H. Kind, E. Weber, R. Russo and P. Yang, Science, 2001, 292, 1897 CrossRef CAS PubMed.
- B. Moshofsky and T. Mokari, Chem. Mater., 2013, 25, 1384–1391 CrossRef CAS.
- G. Xi, S. Ouyang, P. Li, J. Ye, Q. Ma, N. Su, H. Bai and C. Wang, Angew. Chem., Int. Ed., 2012, 51, 2395–2399 CrossRef CAS PubMed.
- J. Polleux, N. Pinna, M. Antonietti and M. Niederberger, J. Am. Chem. Soc., 2005, 127, 15595–15601 CrossRef CAS PubMed.
- (a) T. Nutz and M. Haase, J. Phys. Chem. B, 2000, 104, 8430 CrossRef; (b) J. W. Seo, Y. W. Jun, S. J. Ko and J. Cheon, J. Phys. Chem. B, 2005, 109, 5389 CrossRef CAS PubMed.
- J. Polleux, A. Gurlo, N. Barsan, U. Weimar, M. Antonietti and M. Niederberger, Angew. Chem., 2006, 118, 267–271 CrossRef PubMed.
- Z. Chen, Q. Wang, H. Wang, L. Zhang, G. Song, L. Song, J. Hu, H. Wang, J. Liu, M. Zhu and D. Zhao, Adv. Mater., 2013, 25, 2095–2100 CrossRef CAS PubMed.
- G. L. Frey, A. Rothschild, J. Sloan, R. Rosentsveig, R. Popovitz-Biro and R. Tenne, J. Solid State Chem., 2001, 162, 300 CrossRef CAS.
- F. D. Hardcastle and I. E. Wachs, J. Raman Spectrosc., 1995, 26, 397 CrossRef CAS PubMed.
- J. Y. Luo, S. Z. Deng, Y. T. Tao, F. L. Zhao, L. F. Zhu, L. Gong, J. Chen and N. S. Xu, J. Phys. Chem. C, 2009, 113, 15877 CAS.
- M. Sun, N. Xu, Y. W. Cao, J. N. Yao and E. G. Wang, J. Mater. Res., 2000, 15, 927 CrossRef CAS.
- P. J. Kulesza and L. R. Faulkner, J. Electroanal. Chem., 1988, 248, 305–320 CrossRef CAS.
- (a) C. S. Blackman and I. P. Parkin, Chem. Mater., 2005, 17, 1583–1590 CrossRef CAS; (b) D. Gogova, L. K. Thomas and B. Camin, Thin Solid Films, 2009, 517, 3326–3331 CrossRef CAS PubMed.
- A. Tocchetto and A. Glisenti, Langmuir, 2000, 16, 6173–6182 CrossRef CAS.
- C. Guo, S. Yin, M. Yan, M. Kobayashi, M. Kakihana and T. Sato, Inorg. Chem., 2012, 51, 4763–4771 CrossRef CAS PubMed.
- T. He, Y. Ma, Y. Cao, X. Hu, H. Liu, G. Zhang, W. Yang and J. Yao, J. Phys. Chem. B, 2002, 106, 12670 CrossRef CAS.
- L. Cademartiri and G. A. Ozin, Adv. Mater., 2009, 21, 1013 CrossRef CAS PubMed.
- M. Feng, A. Pan, H. Zhang, Z. Li, F. Liu, H. Liu, D. Shi, B. Zou and H. Gao, Appl. Phys. Lett., 2005, 86, 141901 CrossRef PubMed.
- (a) I. Nakamura, N. Negishi, S. Kutsuna, T. Ihara, S. Sugihara and K. Takeuchi, J. Mol. Catal. A: Chem., 2000, 161, 205–212 CrossRef CAS; (b) X. Pan, M. Yang, X. Fu, N. Zhang and Y. Xu, Nanoscale, 2013, 5, 3601–3614 RSC; (c) L. Ye, L. Zan, L. Tian, T. Peng and J. Zhang, Chem. Commun., 2011, 47, 6951–6953 RSC.
Footnote |
| † Electronic supplementary information (ESI) available. See DOI: 10.1039/c5ra12993a |
| This journal is © The Royal Society of Chemistry 2015 |