DOI:
10.1039/C5RA12933H
(Paper)
RSC Adv., 2015,
5, 63866-63873
The effect of 5-nitroindazole as an inhibitor for the corrosion of copper in a 3.0% NaCl solution
Received
3rd July 2015
, Accepted 21st July 2015
First published on 21st July 2015
Abstract
The inhibition effect of 5-nitroindazole on the corrosion of copper in a 3.0% NaCl solution was investigated with the methods of weight loss, electrochemical tests, scanning electronic microscopy (SEM) and theoretical calculations. The weight loss and electrochemical results revealed that 5-nitroindazole is a mixed-type inhibitor with the inhibition efficiency is up to 99% at 0.4 mM, which was further confirmed by SEM observation. The adsorption of the inhibitor molecule on the copper surface was found to obey the Langmuir adsorption isotherm. The quantum chemical calculations and molecular dynamics simulation showed that 5-nitroindazole is adsorbed strongly on the copper surface in a parallel mode through the indazole ring.
1. Introduction
Copper and its alloys are widely applied in marine industry, including power stations, shipbuilding and seawater desalination, owing to their perfect electrical, thermal and mechanical properties.1,2 However, the marine environment contains huge amounts of chloride ions, which significantly destroy the copper substrate despite its chemical inertness.3–5 Thus, the corrosion inhibition for copper in chloride media has attracted considerable attention from researchers and has remained a hot research topic for years.6–20
In recent decades, various strategies have been developed to protect copper and its alloy from corrosion. One of the most high-efficiency and low-cost approaches is to utilize organic compounds as corrosion inhibitors.13 These compounds usually contains polar functional groups with several heteroatoms (i.e. nitrogen, oxygen, sulfur) and/or conjugated double bonds.3,18 Up to now, different kinds of organic compounds have been explored to serve as copper inhibitors,17,19–27 among which benzotriazole (BTA) and its derivatives are the most successfully ones. However, owing to the toxicity of BTA and its derivatives to the environment, new environment-friendly organic inhibitors are required. 5-Nitroindazole containing polar groups is not harmful to water environment, and then it is expected to be an effectively green inhibitor for copper corrosion.
5-Nitroindazole (Fig. 1) is a chemical immediate whose derivatives have potential antitumor activity.28,29 The purpose of the present study is to employ this organic component to inhibit the corrosion of copper in chloride solution, which has not been reported previously. The measurements of potentiodynamic polarization, electrochemical impedance spectroscopy (EIS), weight loss and scanning electronic microscope (SEM) are conducted to evaluate the inhibition performance of 5-nitroindazole for copper in 3.0% NaCl solution at first. Based on the experiments, as well as theoretical simulation, an inhibition mechanism is further developed to interpret the protection effects for copper with 5-nitroindazole.
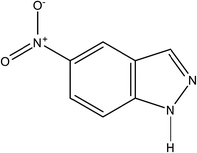 |
| | Fig. 1 Molecular structure of 5-nitroindazole. | |
2. Experimental methods
2.1 Materials and sample preparation
5-Nitroindazole (Aladdin, 98%), absolute ethanol (C2H5OH, Aladdin, 99.9%) and sodium chloride (NaCl, Aladdin, 99.9%) were used as received. The copper coupons (99.9%) for weight loss experiments were mechanically cut into 3.00 cm × 1.50 cm × 1.50 cm dimensions. For electrochemical experiments, the copper specimens with dimensions of 1.00 cm × 1.00 cm × 1.00 cm were embedded in epoxy resin and mounted in Teflon. The total square area of the specimens exposed to the testing solution was 1 cm2. Prior to each experiment, the copper specimens were abraded elaborately with emery papers from 400 to 2000 grit consecutively at first. And then, they were thoroughly degreased ultrasonically with acetone, washed ultrasonically with ultrapure water and dried at room temperature before being immersed in corrosive solution.
The test solution was prepared with adding corresponding (0.002, 0.02, 0.1, 0.2 and 0.4 mM) concentrations of 5-nitroindazole into 3% NaCl solution. 1% tetrahydrofuran was added to dissolve the inhibitor absolutely. The solution without the inhibitor was treated as blank for comparison. All experiments were performed at the temperature of 298 ± 1 K with thermostat water bath.
2.2 Weight loss measurements
Copper specimens in triplicate were weight and suspended in the test NaCl solution in the absence and presence of 5-nitroindazole at corresponding concentrations for 10 days before being taken out. And then the specimens were descaled with the soft brush and thoroughly rinsed in 0.2 mol L−1 HCl and water. Afterwards, they were degreased with acetone and flown dry before being weighed up. The mean corrosion rates were then calculated by the weight loss of each specimens and immersion time.
2.3 Electrochemical experiments
All the electrochemical experiments were performed with CHI660D electrochemical workstation in a typical three-electrode cell system. A bare copper electrode and a platinum electrode were acted as the working electrode (WE) and the counter electrode (CE), respectively. Then a saturated calomel electrode (SCE) with a luggin capillary was worked as the reference electrode. Prior to each measurement, the working electrode was immersed in corrosive media for 50 min to reach an almost steady state. All potential values were referred to SCE in this study. The same experiment was usually carried out for 10–12 groups to guarantee the experimental reproducibility. Potentiodynamic polarization curves were obtained by scanning the electrode potential automatically from −250 to +250 mV versus open circuit potential (OCP) at the scan rate of 2 mV s−1. The Tafel region data were analyzed with extrapolation method.
Electrochemical impedance spectroscopy (EIS) measurements were obtained over a frequency range from 100 kHz to 10 mHz. The amplitude of ac excitation signal is 5 mV over the OCP. The EIS data were analyzed and fitted by Zsimpwin 3.10 software.
2.4 Surface characterization
The copper specimens were prepared as described before. After being exposed to 3% NaCl solution with and without 0.02 mM inhibitor for 20 days at 298 K, the surface morphology of these copper coupons was characterized by scanning electron microscopy (SEM) with accelerating voltage of 10 kV.
2.5 Calculation methods
Quantum chemical calculations for the inhibitor molecule were performed using the DMol3 module of Material Studio 7.0. The molecular structure of the 5-nitroindazle was geometrically optimized by density functional theory (DFT) with RPBE basis set. The quantum chemical parameters calculated from the optimized structure were analyzed.
The forcite module in Material Studio 7.0 software was applied to investigate the interaction between 5-nitroindazole and the Cu (111) surface. The molecular dynamics simulation was performed at 298 K, canonical ensemble (NVT), with a time step of 1.0 fs and simulation time of 1000 ps.
3. Results and discussion
3.1 Polarization tests
The potentiodynamic polarization curves for the copper electrode in 3% NaCl solution without and with different concentrations of 5-nitroindazole are shown in Fig. 2. As known, cathodic reaction of copper in 3% NaCl solution is oxygen reduction.30| | |
O2 + 4e + 2H2O → 4OH−
| (1) |
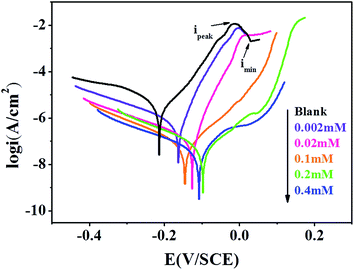 |
| | Fig. 2 Potentiodynamic polarization curves recorded for the copper electrode in 3% NaCl solution containing different concentrations of 5-nitroindazole at 298 K. | |
The anodic dissolution process including a series of reaction.30,31
| | |
CuCl2− → Cu2+ + 2Cl− + e
| (5) |
| | |
Cu2+ + Cu + 2Cl− → 2CuCl
| (6) |
As seen from Fig. 2, current density increases at lower overpotential before achieving the maximum value (ipeak) due to the dissolution of copper into Cu+ (eqn (2)). Then an insoluble film CuCl is formed in the environment of Cl− (eqn (3)). Thus, the current density decreases from ipeak to imin. However, CuCl film is not sufficient to prevent the copper from corrosion owing to its poor adhesion to the copper surface. So CuCl is converted quickly to a soluble CuCl2− complex in following reaction (eqn (4)), leading to the current density increasing again. After that, the complex can quickly diffuse into the bulk solution via eqn (5). Finally, a comproportionation reaction occurs between Cu(0) and Cu(II) to form CuCl again (eqn (6)). This reaction facilitates the corrosion of copper.
The cathodic and anodic current–potential curves are extrapolated up to their intersection points where we can gain the corrosion potential (Ecorr) and corrosion current density (icorr). The primary electrochemical parameters were obtained through this method, including Ecorr, icorr, anodic and cathodic Tafel slope (βa, βc), and the inhibition efficiency (η) are listed in Table 1. The values of η can be calculated as follows,
| |
 | (7) |
where
i0corr and
icorr indicate uninhibited and inhibited current densities of copper electrode, respectively. It is clear that the existence of the organic compound shifts the corrosion potential to the positive direction and obviously reduces both the cathodic and anodic current densities compared with the uninhibited one. These results reveal that 5-nitroindazole in 3% NaCl solution retards both the cathodic and anodic reactions, so the inhibitor acts as a mixed-type inhibitor for copper in such condition.
12,14 This inhibition action suggests a barrier film of inhibitor molecules forming on the copper surface, which would be further confirmed by SEM observation in another section. This film blocks the active sites on the copper surface
19 and prevents the formation of cuprous chloride complexes simultaneously.
Table 1 Potentiodynamic polarization parameters for copper in 3% NaCl solution without and with different concentrations of the inhibitor at 298 K
| C (mM) |
Ecorr (mV per SCE) |
βc (mV dec−1) |
βa (mV dec−1) |
icorr (μA cm−2) |
η (%) |
| 0 |
−214 |
94 |
59 |
2.750 |
— |
| 0.002 |
−163 |
142 |
34 |
0.388 |
85.9 |
| 0.02 |
−126 |
148 |
29 |
0.077 |
97.2 |
| 0.1 |
−145 |
124 |
78 |
0.063 |
97.7 |
| 0.2 |
−98 |
110 |
75 |
0.045 |
98.4 |
| 0.4 |
−108 |
139 |
67 |
0.034 |
98.8 |
It can be seen in Table 1 that corrosion current densities (icorr) decreases sharply when different concentrations of 5-nitroindazole are presented. The values of η increase with incremental concentration of inhibitor with the maximum value of 98.8%. Moreover, the inhibition efficiencies have already reached a high level of 97.2% even with 0.02 mM inhibitor. These results indicate that the adsorption effects of inhibitor molecules formed an effectively protective film on the copper surface.
3.2 Electrochemical impedance spectroscopy
Typical Nyquist impedance plots gained for the copper electrode without and with different concentrations of 5-nitroindazole are shown in Fig. 3. As shown in the inset of Fig. 3, the plot of blank solution shows a depressed semicircle in the high frequency range followed by a straight line at low frequency region. The high frequency semicircle is related to the resistance of charge transfer (Rct) and double layer capacitance (Cdl). The low frequency impedance is well known as Warburg impedance (W) which can be explained by the diffusion of dissolved oxygen to the metal surface or the transportation of soluble cuprous chloride complexes from the surface of copper to the bulk solution.32 Fig. 3a shows that Warburg impedance disappears at low frequencies when the inhibitor is present. Only some large convex arcs are observed in the Nyquist plots. This phenomenon demonstrates that copper corrosion is controlled by the charge transfer process as the inhibitor is added. It is observed that diameter of the semicircle increases obviously in the presence of the inhibitor, which increases continuously with the inhibitor concentration.
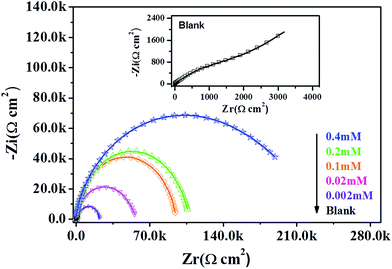 |
| | Fig. 3 Nyquist plot for copper electrode in 3% NaCl solution without and with different concentrations of 5-nitroindazole. | |
Bode absolute impedance plot (Fig. 4a) shows that the impedance value increases greatly over the whole frequency range with the incremental concentration of 5-nitroindazole, and a larger log![[thin space (1/6-em)]](https://www.rsc.org/images/entities/char_2009.gif) |Z| represents a better protection performance. In corresponding Bode phase plot (Fig. 4b), large values of the phase angle indicate that superior inhibition behavior is obtained by increasing the concentration of 5-nitroindazole.33
|Z| represents a better protection performance. In corresponding Bode phase plot (Fig. 4b), large values of the phase angle indicate that superior inhibition behavior is obtained by increasing the concentration of 5-nitroindazole.33
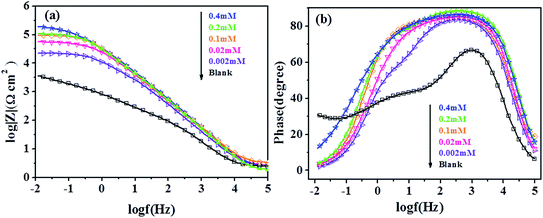 |
| | Fig. 4 Bode plots (a and b) for copper electrode in 3% NaCl solution without and with different concentrations of 5-nitroindazole. | |
The equivalent circuit models used to analyze measurements results are shown in Fig. 5. The corresponding parameters obtained from the equivalent circuit are listed in Table 2. Here, Rs is the solution resistance, Rf is the resistance of protective film formed on the copper surface, and Rct represents the charge transfer resistance. W is the Warburg impedance, Qf and Qdl are the constant phase elements (CPE), representing a film capacitance (Cf) and double-layer capacitance (Cdl). The impedance of a CPE is expressed as follows34
| |
 | (8) |
where
Y is the proportional factor,
j is the imaginary root,
w presents the angular frequency and
n is the deviation parameter. It can be seen that impedance spectra show imperfect semicircles because of the dispersing effect. Accordingly, CPE is often used to replace pure capacitor. The
η values of the inhibitor for the copper electrode in 3% NaCl solution are calculated from the
Rct as follows
| |
 | (9) |
where
Rct and
R0ct are the resistances of charge transfer in 3% NaCl solution without and with 5-nitroindazole, respectively. Obviously, in
Table 2,
Rct values increase with the addition of the inhibitor and this effect are enhanced by increasing the concentration of 5-nitroindazole. Consequently,
η also increase with the inhibitor concentration just as the values of
Rct, which indicates that 5-nitroindazole acts as an effective corrosion inhibitor for copper in NaCl medium. Furthermore, the significant increase of
Rf demonstrates that a high-efficiency protective film are formed by the adsorption effect of inhibitor on the electrode surface. On the contrary, the values of
Cf and
Cdl, which can be described as following equations
23,26 in the present study, decrease with the increase of inhibitor concentration,
| |
 | (10) |
| |
 | (11) |
where
d is the thickness of electric double-layer,
S is the surface area of the copper electrode exposed to aggressive solution,
F is the Faraday's constant,
ε0 and
ε are the permittivity of the air and the local dielectric constant, respectively. Thus, we can explain the decrease of
Cf with the adsorption of inhibitor, which declines the exposed electrode surface area at higher inhibitor concentration and thereby inhibit copper corrosion effectively. Besides, the water molecules on the electrode surface are replaced gradually by 5-nitroindazole molecules with adsorption reaction at the metal/solution interface, leading to lower local dielectric constant, thicker electric double-layer, and smaller electrode surface area mentioned above. All these factors result in decrease of
Cdl.
23 These results provide further confirmation that the corrosion of copper in 3% NaCl solution is inhibited significantly by 5-nitroindazole.
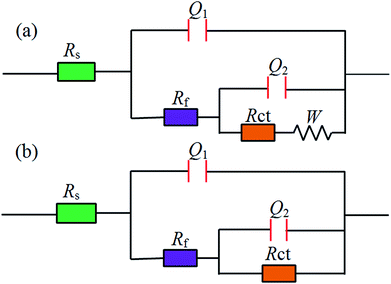 |
| | Fig. 5 The equivalent circuits used to fit the EIS experimental data. | |
Table 2 Impedance parameters of copper in 3% NaCl solution in the presence and absence of the inhibitor at 298 K
| C (mM) |
Rs (Ω cm2) |
Rf (kΩ cm2) |
Rct (kΩ cm2) |
Qf |
Qdl |
W |
η (%) |
| Y/(μF cm−2) n1 |
Y/(μF cm−2) n2 |
| 0 |
2.40 |
0.10 |
2.5 |
18.62 |
0.92 |
347 |
0.56 |
0.00128 |
— |
| 0.002 |
2.57 |
2.82 |
17.6 |
5.67 |
0.96 |
14.7 |
0.79 |
— |
85.7 |
| 0.02 |
2.66 |
5.01 |
57.1 |
4.36 |
1 |
8.84 |
0.65 |
— |
95.6 |
| 0.1 |
2.88 |
8.45 |
91.4 |
3.09 |
0.97 |
4.95 |
0.66 |
— |
97.3 |
| 0.2 |
1.83 |
10.30 |
97.7 |
2.87 |
1 |
3.34 |
0.75 |
— |
97.4 |
| 0.4 |
2.33 |
8.07 |
236 |
3.02 |
0.99 |
4.62 |
0.52 |
— |
98.9 |
3.3 Weight loss measurements
The corrosion rate (W, mg m−2 h−1) and inhibition efficiency (η (%)) obtained from weight loss measurements at various concentrations of 5-nitroindazole after immersion in 3% NaCl solution for 10 days are shown in Table 3. η can be calculated as follows:| |
 | (12) |
where W0 and W are the corrosion rates of copper without and with the inhibitor, respectively. As seen from Table 3, the corrosion rates decrease obviously and the inhibition efficiencies increases distinctly with increasing the inhibitor concentration. The inhibitor suppresses effectively the corrosion of copper in 3% NaCl solution at all concentrations, which indicates a good inhibition performance of 5-nitroindazole in 3% NaCl solution. The maximum efficiency reaches 97.0% at 0.4 mM inhibitor. It is found that the inhibition efficiencies acquired from weight loss measurements are just below those from the electrochemical experiments. Generally, this situation can be explained that weight loss measurements give average corrosion rates, whereas the electrochemical techniques provide instantaneous corrosion rates for copper in 3% NaCl solution at the testing moment.
Table 3 Corrosion parameters obtained from weight loss measurements for copper in 3% NaCl solution containing different concentrations of the inhibitor
| C (mM) |
Weight loss (mg m−2 h−1) |
η (%) |
| 0 |
8.06 |
— |
| 0.002 |
1.29 |
84.0 |
| 0.02 |
0.63 |
92.2 |
| 0.1 |
0.55 |
93.2 |
| 0.2 |
0.51 |
93.7 |
| 0.4 |
0.24 |
97.0 |
3.4 SEM analyses
SEM is widely applied to study the morphological characteristics of metal surface.34–36 SEM micrographs were obtained from copper surface after immersion in 3% NaCl solution for 10 days in the absence and presence of 0.02 mM inhibitor are shown in Fig. 6. It can be seen that copper sample before immersion is almost smooth (Fig. 6a). Compared with the freshly polished copper, the specimen in the 3% NaCl solution without inhibitor (Fig. 6b) is strongly corroded by the corrosive medium and many scratches are observed obviously. In contrast, in the presence of 5-nitroindazole, the surface of the specimen (Fig. 6c) is well protected and the micrograph are nearly the same as the one before immersion. Therefore, it can be concluded that 5-nitroindazole is a good inhibitor for corrosion of copper even at a low concentration.
 |
| | Fig. 6 SEM images of (a) freshly polished copper specimen and the specimens immersed in 3% NaCl solution for 10 days (b) without inhibitor and (c) with 0.02 mM inhibitor. | |
3.5 Adsorption isotherm
Adsorption isotherm is extensively applied to explore the adsorption mechanism of inhibitor. In this study, several typical adsorption isotherms such as Langmuir, Frumkin, Temkin, and Bockris–Swinkel37 isotherms are used to fit the results obtained from electrochemical techniques and weigh loss measurements.
It is observed that Langmuir isotherm (eqn (13)) is the most suitable mode to fit experimental data, with all linear regression coefficients (R2) greater than 0.999 and all fitted lines are in good agreement.
| |
 | (13) |
where
θ, the degree of the coverage, is defined as
η (%) in different experiments,
C is the concentration of the organic compound, and
Kads is the equilibrium constant of inhibitor adsorption process. As shown in
Fig. 7, the relationship between
C/
θ and
C yields straight lines with intercepts 1/
K. The standard free energy of adsorption (Δ
G0ads) is given by
| |
 | (14) |
here,
R is the molar gas constant (8.314 J mol
−1 K
−1),
T is the absolute temperature (K) and 55.5 is the molar concentration of water in the solution (mol L
−1).
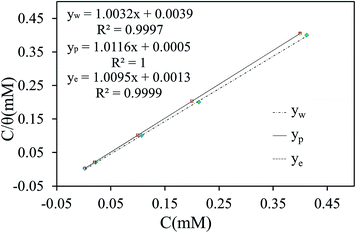 |
| | Fig. 7 Langmiur adsorption isotherm of 5-nitroindazole on the copper surface in 3% NaCl solution at 298 K. | |
The parameters obtained are shown in Table 4. Generally, the negative values of ΔG0ads demonstrates that the adsorption of 5-nitroindazole on capper surface is a spontaneous process.36 It is widely accepted that the value of ΔG0ads around or lower than −40 kJ mol−1 are consistent with chemisorption. The corresponding corrosion inhibition acts due to the covalent bond formed by the charge transfer or sharing from the organic molecules to the metal surface. If the ΔG0ads value is around or higher than −20 kJ mol−1, it can be seen as physisorption acting by electrostatic interaction between the charged inhibitor molecules and the charged metal.24
Table 4 Thermodynamic parameters of the inhibitor for copper in 3% NaCl solution
| Measurements |
Kads (105 L mol−1) |
ΔG0ads (kJ mol−1) |
| Weight loss |
2.56 |
−40.8 |
| Polarization |
20.0 |
−45.9 |
| EIS |
7.69 |
−43.6 |
The values of ΔG0ads obtained from different experiments are all below −40 kJ mol−1, which indicates that the corrosion inhibition was dominated by the chemisorption of 5-nitroindazole on the surface of copper.
3.6 Theoretical study
3.6.1 Quantum chemical calculations. To investigate the inhibition mechanism of 5-nitroindazole for copper, quantum chemical calculations were performed. The optimized geometry structure, density distribution of the highest occupied molecular orbital (HOMO) and the lowest unoccupied molecular orbital (LUMO) of the inhibitor molecule after optimization are presented in Fig. 8. The relevant quantum chemical parameters such as the energy of the frontier molecule orbital (EHOMO, ELUMO), energy gap (ΔE = ELUMO − EHOMO), and dipole moment (μ) are listed in Table 5.
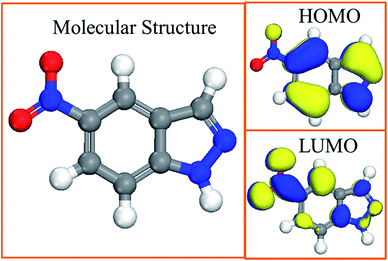 |
| | Fig. 8 Molecular structure and frontier molecular orbital of 5-nitroindazole. | |
Table 5 Quantum chemical parameters for the 5-nitroindazole
| EHOMO (eV) |
ELUMO (eV) |
ΔE (eV) |
μ (Debye) |
| −0.229 |
−0.121 |
0.108 |
4.806 |
It is observed obviously that the HOMO is mainly located in the indazole ring in the Fig. 8. Thus, this would demonstrates that the active site for adsorption of 5-nitroindazole on the copper surface are within the region. Moreover, as the indazole ring is a plane conjugated structure, the inhibitor molecules may be absorbed on the surface of copper with the flat mode.14
As shown in Table 5, a tendency of the organic molecule to donate electrons to the suitable acceptor molecule can be inferred by the high value of EHOMO, whereas the low ELUMO indicates its ability of the molecule as an electrons-accepter. So the inhibitor molecules can adsorb on the copper surface by donating the lone pair electrons from the N atoms in indazole ring to the vacant d orbitals of copper, and then inhibit the corrosion of copper.13 It is generally accepted that the energy gap shows the chemical stability of the molecule, and a smaller ΔE achieved in the Table 5 demonstrates that the molecule is much easier to be polarized and adsorbed on the metal surface. Besides, the large dipole moment may lead to strong adsorption.8 These results confirm that the high inhibition efficiency of 5-nitroindazole obtained by weight loss measurements and electrochemical techniques is extremely reasonable.
3.6.2 Molecular dynamics simulation. In order to further discuss the interaction between the inhibitor and copper surface, molecular dynamics simulation were carried out to model the adsorption structure of 5-nitroindazole on copper (111) surface. The side view and the top view of the optimized equilibrium configuration are shown in Fig. 9, it can be seen that the 5-nitroindazole molecule tends to be absorbed in parallel on the copper surface through indazole ring, which is similar to the result of quantum chemistry calculations above. This parallel orientation can maximize contact between inhibitor molecules and copper surface to minimize copper surface area attacked by corrosive particles. Thus, we can conclude that the adsorption effects acting through coordinate bonds, which is formed by donating the lone pair electrons from the N atoms to the vacant d orbitals of Cu. Moreover, the binding energy between copper (111) surface and inhibitor molecule calculated is −174.6 kJ mol−1. The high absolute value of the binding energy indicates that a strong adsorption23,38 of the inhibitor molecules occurs on the copper surface.
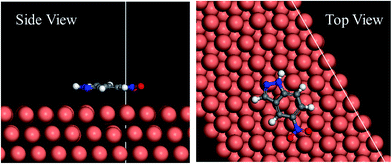 |
| | Fig. 9 Equilibrium configuration for adsorption of 5-nitroindazole on Cu (111) surface after optimization. | |
4. Conclusions
(1) Potentiodynamic polarization curves indicate that 5-nitroindazole acts as an effective mixed-type inhibitor and its inhibition efficiency increases at higher concentration.
(2) EIS results demonstrate that Rct and Rf increase greatly and Cdl and Cf decrease by increasing the concentration of inhibitor.
(3) Inhibition efficiency obtained from weight loss, polarization curves and EIS measurements are in good agreement.
(4) The SEM analyses indicate that copper corrosion can be inhibited significantly due to the adsorption of 5-nitroindazole on the copper surface.
(5) The adsorption of the inhibitor on the copper surface in 3% NaCl solution obeys the Langmuir adsorption isotherm and belongs to chemisorption.
(6) Theoretical calculations reveal that 5-nitroindazole is adsorbed strongly on the copper surface in a parallel mode through the indazole ring.
Acknowledgements
This research was supported by Natural Science Foundation of China (no. 21376282), and Chongqing Innovation Fund for Graduate Students (no. CYB14019).
References
- L. Núñez, E. Reguera, F. Corvo, E. González and C. Vazquez, Corros. Sci., 2005, 47, 461–484 CrossRef PubMed.
- D.-q. Zhang, L.-x. Gao and G.-d. Zhou, Appl. Surf. Sci., 2004, 225, 287–293 CrossRef CAS PubMed.
- E. M. Sherif and S.-M. Park, J. Electrochem. Soc., 2005, 152, B428 CrossRef CAS PubMed.
- E. M. Sherif and S.-M. Park, Corros. Sci., 2006, 48, 4065–4079 CrossRef CAS PubMed.
- E.-S. M. Sherif, Appl. Surf. Sci., 2006, 252, 8615–8623 CrossRef CAS PubMed.
- F. M. Bayoumi, A. M. Abdullah and B. Attia, Mater. Corros., 2008, 59, 691–696 CrossRef CAS PubMed.
- W. Chen, S. Hong, H. B. Li, H. Q. Luo, M. Li and N. B. Li, Corros. Sci., 2012, 61, 53–62 CrossRef CAS PubMed.
- W. Chen, S. Hong, H. Q. Luo and N. B. Li, J. Mater. Eng. Perform., 2013, 23, 527–537 CrossRef.
- S. L. Chi-Ucán, A. Castillo-Atoche, P. Castro Borges, J. A. Manzanilla-Cano, G. González-García, R. Patiño and L. Díaz-Ballote, J. Chem., 2014, 2014, 1–10 CrossRef PubMed.
- A. Dafali, B. Hammouti, R. Mokhlisse and S. Kertit, Corros. Sci., 2003, 45, 1619–1630 CrossRef CAS.
- B. Hammouti, A. Dafali, R. Touzani and M. Bouachrine, J. Saudi Chem. Soc., 2012, 16, 413–418 CrossRef CAS PubMed.
- O. A. Hazzazi, J. Appl. Electrochem., 2007, 37, 933–940 CrossRef CAS.
- S. Hong, W. Chen, H. Q. Luo and N. B. Li, Corros. Sci., 2012, 57, 270–278 CrossRef CAS PubMed.
- S. Hong, W. Chen, Y. Zhang, H. Q. Luo, M. Li and N. B. Li, Corros. Sci., 2013, 66, 308–314 CrossRef CAS PubMed.
- K. F. Khaled, Mater. Chem. Phys., 2008, 112, 104–111 CrossRef CAS PubMed.
- K. F. Khaled, M. N. H. Hamed, K. M. Abdel-Azim and N. S. Abdelshafi, J. Solid State Electrochem., 2010, 15, 663–673 CrossRef.
- G. Kılınççeker and H. Demir, Anti-Corros. Methods Mater., 2013, 60, 134–142 CrossRef.
- C.-c. Li, X.-y. Guo, S. Shen, P. Song, T. Xu, Y. Wen and H.-F. Yang, Corros. Sci., 2014, 83, 147–154 CrossRef CAS PubMed.
- W. Li, L. Hu, S. Zhang and B. Hou, Corros. Sci., 2011, 53, 735–745 CrossRef CAS PubMed.
- W. Qafsaoui, M. W. Kendig, H. Perrot and H. Takenouti, Electrochim. Acta, 2013, 87, 348–360 CrossRef CAS PubMed.
- E.-S. M. Sherif, A. M. El Shamy, M. M. Ramla and A. O. H. El Nazhawy, Mater. Chem. Phys., 2007, 102, 231–239 CrossRef CAS PubMed.
- G. Tansuğ, T. Tüken, E. S. Giray, G. Fındıkkıran, G. Sığırcık, O. Demirkol and M. Erbil, Corros. Sci., 2014, 84, 21–29 CrossRef PubMed.
- D. Wang, B. Xiang, Y. Liang, S. Song and C. Liu, Corros. Sci., 2014, 85, 77–86 CrossRef CAS PubMed.
- J. Yu, Q. Feng and Y. Yu, Anti-Corros. Methods Mater., 2009, 56, 275–279 CrossRef.
- H. Baeza, M. Guzman and R. Lara, Int. J. Electrochem. Sci., 2013, 8, 7518–7528 Search PubMed.
- C. Kun, S. Huyuan, Z. Xia and H. Baorong, Int. J. Electrochem. Sci., 2014, 9, 8106–8119 Search PubMed.
- A. Dafali and B. Hammouti, Ann. chim. Sci. Mat., 2000, 25, 437–446 CrossRef CAS.
- C. Cheptea, V. Sunel, J. Desbrieres and M. Popa, J. Heterocycl. Chem., 2013, 50, 366–372 CrossRef CAS PubMed.
- J. Rodriguez, V. J. Aran, L. Boiani, C. Olea-Azar, M. L. Lavaggi, M. Gonzalez, H. Cerecetto, J. D. Maya, C. Carrasco-Pozo and H. S. Cosoy, Bioorg. Med. Chem., 2009, 17, 8186–8196 CrossRef CAS PubMed.
- L. Hu, S. Zhang, W. Li and B. Hou, Corros. Sci., 2010, 52, 2891–2896 CrossRef CAS PubMed.
- E. M. Sherif and S.-M. Park, Electrochim. Acta, 2006, 51, 4665–4673 CrossRef CAS PubMed.
- Y. Zhou, S. Zhang and L. Guo, Int. J. Electrochem. Sci., 2015, 10, 2072–2087 CAS.
- E.-S. M. Sherif, R. M. Erasmus and J. D. Comins, J. Appl. Electrochem., 2008, 39, 83–91 CrossRef.
- H. Tian, W. Li and B. Hou, Int. J. Electrochem. Sci., 2013, 8, 8513–8529 CAS.
- F. M. Al Kharafi, I. M. Ghayad and R. M. Abdallah, Corrosion, 2013, 69, 58–66 CrossRef CAS PubMed.
- M. A. Amin, J. Appl. Electrochem., 2005, 36, 215–226 CrossRef.
- S. Zhang, Z. Tao, W. Li and B. Hou, Appl. Surf. Sci., 2009, 255, 6757–6763 CrossRef CAS PubMed.
- X. Zheng, S. Zhang, W. Li, L. Yin, J. He and J. Wu, Corros. Sci., 2014, 80, 383–392 CrossRef CAS PubMed.
|
| This journal is © The Royal Society of Chemistry 2015 |
Click here to see how this site uses Cookies. View our privacy policy here. 


![[thin space (1/6-em)]](https://www.rsc.org/images/entities/char_2009.gif) |Z| represents a better protection performance. In corresponding Bode phase plot (Fig. 4b), large values of the phase angle indicate that superior inhibition behavior is obtained by increasing the concentration of 5-nitroindazole.33
|Z| represents a better protection performance. In corresponding Bode phase plot (Fig. 4b), large values of the phase angle indicate that superior inhibition behavior is obtained by increasing the concentration of 5-nitroindazole.33


