 Open Access Article
Creative Commons Attribution 3.0 Unported Licence
Preparation and rheological properties of whey protein emulsion fluid gels
R. J. A. Moakes*,
A. Sullo and
I. T. Norton
Centre for Formulation Engineering, School of Chemical Engineering, University of Birmingham, Edgbaston, Birmingham, B15 2TT, UK. E-mail: rjm116@bham.ac.uk
First published on 14th July 2015
Abstract
A shear-gel approach was used to coat an O/W emulsion with a whey protein shell. Mechanical shear was applied to an aqueous solution of whey protein isolate (WPI) and oil then heated through the sol–gel transition. The formation of a continuous WPI network was prevented through the shear flow, resulting in discreet spherical capsules, with sizes in the micron scale (∼25 μm). Through careful control over both the oil and WPI components, encapsulation efficiencies of up to 99% were obtained. Subsequent rheological properties highlighted elastic behaviour (G′) dependent on oil content; where higher oil fractions increased the effective phase volume of the particles. The result was packing fractions that exceeded those for hard spheres (>0.64), leading to pseudo-solid characteristics at rest, apparent yield stresses and thixotropic behaviour under shear. As such, emulsion fluid gel (EmFG) rheology was closely comparable to those of soft microgel suspensions (fluid gels) and soft-coated particles.
1. Introduction
The use of particulates as rheological modifiers spans across multiple industries: paint, cosmetic, food etc. For this reason, systems such as colloidal suspensions and emulsions have been well documented. However, more recently microparticulate gel suspensions have received increasing interest for their ability to create weakly structured fluids, with rheological properties characterised between those for colloidal particles and polymeric gels; pseudo-solid behaviour at rest, but flow above a critical stress.1–4 Enhanced flow behaviours have been observed in polysaccharide fluid gels where, at volume fractions as low as ϕ 0.2 suspensions showed high viscosities and marked shear thinning behaviour, typical of highly aggregated systems.5,6 The observed changes in flow properties were assigned to the particle microstructures, where, as a result of incomplete gelation at the particle surface, interactions between microgel spheres resulted in a degree of structuring. Additionally, the deformability of such soft hydrogel particles led to volume fractions that exceeded those typical for hard spheres. At such high volume fractions particles become sterically confined, thus rheology became more closely governed by the particle moduli.7–9Particle intrinsic properties such as strength and deformability can be better understood by looking at a comparable quiescently formed gel. Again, mechanical properties are closely linked to the gel microstructure.10–14 Complex microstructures therefore provide another means of controlling a gel's physicomechanical properties. Besides polymer mixes where two or more polymers undergo a sol–gel transition, filler particles can be used to prepare gel composites.15 These composites display viscoelastic properties as a function of the gel matrix, volume fraction and rigidity of the filler. Chemical affinity between the filler and surrounding substrate is also very important.16 Typically, where the filler interface is included into the gelled network strengthening of the matrix occurs.17 It was demonstrated that increasing the time scale between emulsification and gelation resulted in a shift from stronger to weaker gels. Here, polymerisation of the emulsifier lowered the affinity between oil filler and substrate matrix, causing inherent weak spots within the gel.17–19
Processing is therefore a major consideration in the preparation of gels, on both a macro and micro-scale. Microgels are typically formed by confining the polymer during the sol–gel transition. This can be achieved by means of chemical20 or mechanical1 separation. Controlled microstructures and further rheological properties can be achieved by a microstructural design approach; whereby changing the formulation, i.e. composition, degree of cross-linking and system pH, leads to careful control over the gelled network.4,21 Additionally, in the case of shear gels, modulating the two processing parameters shear and thermal history can lead to controlled particle size and morphology. When the separation applied to the system is such that it becomes comparable to the timescale for polymer ordering, random coil to helix transition and subsequent gelation through the formation of junction sites, thermodynamically favourable spherical particles (∼1 μm) are formed: where the enthalpies of melting are much smaller to comparable quiescently prepared gels.22 The rate of particle growth therefore becomes key. Large anisotropic (∼100 μm) particles form when structuring is so rapid that initial gels are able to form, becoming subsequently broken down in the shear flow. However, in whey protein systems an inverse relationship between aggregation kinetics and system elasticity was observed, showing faster rates to yield weaker suspensions, with lower yield stresses and viscosities.23
Supramolecular chemistry has also shown a viable route to the preparation of micro-composites.24–26 These particles are formed through electrostatic bonding of the polymers. The particulates are formed by carefully controlling the pH so that the zeta-potential of both polymers is of an opposite charge, with a potential great enough to drive complexation. Such micro-particulates, based on an O/W1/W2 system, exhibited a several fold increase in viscosity when compared to a simple O/W emulsion.24 These viscosity changes were attributed to a change in the effective phase volume of the hydrogel spheres, which were further increased through the inclusion of an oil filler. However, interactions between the particles were not observed.
We report here the preparation of emulsion fluid gel (EmFG) particles, a micro-composite of whey protein gel and oil. The research builds on work presenting O/W1/W2 filled hydrogel systems by applying a “shear gel approach” to promote interactions between resulting particles. As such, it takes an additional step to surfactant or Pickering stabilised emulsions by gelling a continuous WPI layer around an oil core. The technique applied results in an elastic suspension, whereby the particles become trapped, suspended in an aqueous phase. Unlike similar studies27 the final systems act in a pseudo-solid fashion until a great enough stress is applied to induce flow, thinning the suspension into a liquid-like state. The microparticles thus offer the capacity to act as a multifunctional composite, for both controlled rheological applications and pose the potential to encapsulate poorly soluble molecules.
The work focuses on whey protein isolate (WPI) as the coating material owing to its thermo-denaturation and subsequent hydrophobic aggregation, to form a gel layer on the surface of an oil substrate. Shear separation will then be applied to prevent complete gelation, promoting particle–particle interactions. Therefore the production of emulsion fluid gels has been investigated, with particular attention to the resulting rheological properties.
2. Materials and methods
2.1. Materials
Whey protein isolate (WPI) was obtained from Kerry Ingredients, Listowel, Ireland (WPI, W994, S-493391) and used without further purification. WPI composition as stated by the supplier was 91.0% protein, moisture 4.0%, fat 1.0%, ash 3.5% and lactose 0.5%. Mineral content of the WPI was: Ca – 0.50, P – 0.65, Na – 0.10, K – 0.15, Mg – 0.02 and Cl – 0.02%. High oleic sunflower oil was obtained from Cargill (Cargill Inc., BE). Sodium azide, hydrochloric acid, silicon oil, Nile Red and Rhodamine B were purchased from Sigma-Aldrich (Sigma-Aldrich, UK).2.2. Preparation of oil filled fluid gels
Preparation of the oil filled fluid gels involved a three-step process. Primary solutions of WPI were firstly prepared and used to form O/W emulsions. The emulsions were then heat treated under shear conditions resulting in emulsion fluid gels (EmFG).2.3. Static light scattering (SLS)
A MS2000 Mastersizer with attached Hydro SM manual small volume dispersion unit (Malvern Instruments Ltd, UK) was used to obtain size distributions for EmFG particles. Distributions are the average of three repeats. Particle size calculations were based upon the Mie theory, thus particles were assumed to be monodisperse, homogenous spheres. Additionally, once coated, particles were a binary system of protein and oil; as such the refractive index of the shell was used.2.4. Microscopy
2.5. Rheological analysis
Rheometry was conducted using a Bohlin Gemini HR Nano stress-controlled Rheometer (Malvern Instruments Ltd, UK) equipped with serrated parallel plate (25 mm diameter) at 1 mm gap height. Experiments were undertaken at 25 °C using a silicon oil moisture trap. An equilibrium was achieved for 15 minutes prior to testing, allowing for consistent loading conditions. Particle phase volumes were obtained using a method outlined by Moakes, et al.;23 whereby aliquots of a given volume were centrifuged, water phase separated and volumes obtained. Phase volumes were calculated as followed (eqn (1)):
 | (1) |
2.6. Encapsulation efficiency
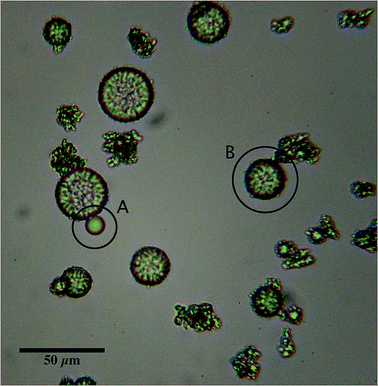
Optical microscopy was used to analyse oil droplet entrapment for each system. Micrographs of the raw emulsion were obtained and emulsion droplets in each image manually counted to give an average droplet count (Nem) determined over 12 images. Values for uncoated emulsion droplets (Nfo) in the final EmFG systems were then obtained in the same manner. An example of both a coated and uncoated droplet has been shown in Fig. 1. The ratio of the two was used to calculate the percentage of encapsulated oil, as shown in eqn (2):
 | (2) |
Encapsulation was averaged over 12 micrographs with error calculated as the 95% confidence interval.
3. Results and discussion
3.1. Preparation of emulsion fluid gels (EmFG)
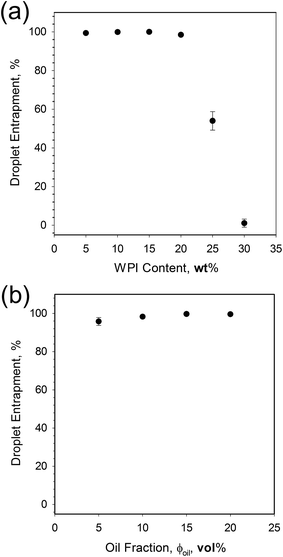
An O/W system where the excess WPI emulsifier exceeded the critical gelling concentration28 (>1 wt%), was subjected to heat treatment under shear conditions. The shear flow exerted on the system during the sol–gel transition prevented the formation of a continuous gel network, resulting in single discreet particles/encapsulates.Increasing the phase volume of the oil from 5 to 20% whilst retaining a standard WPI concentration (15 wt%) however, had little effect on the emulsion entrapment, yielding droplet entrapment in excess of 95%. Here, the increase in oil was not sufficient to raise the viscosity of the system, and hinder polymer diffusion. However, at low oil fractions increasing the WPI concentration from 5 to 15 wt% caused an observed transition from suspension creaming to sedimentation, indicating a change in particle density, probably as a result of a change in shell thickness.
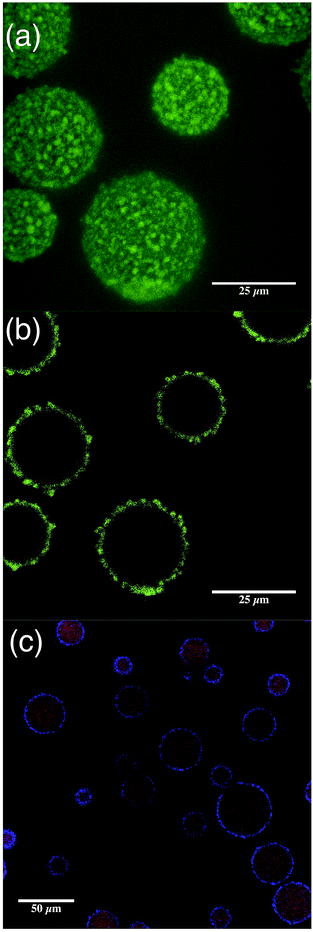
Imaging the EmFG particles at 0.5 μm intervals gave enhanced topographical detail (Fig. 3a), allowing the coating to be observed. A non-uniform shell with much greater thickness than expected for emulsified droplets was shown, inferring the presence of a gel layer. Additionally, cross-sections were obtained using CLSM, which again show shell thickness and non-uniformity, but also through negative staining and dying, oil reservoirs in the centre of the particles (Fig. 3b and c respectfully).
The mechanism for particle formation is thought to be based upon the oil acting as a substrate for shell growth. Growth occurs through enrichment from the surrounding un-gelled biopolymer. Primarily led by the β-lactoglobulin, heat induced denaturation of the native structure causes hydrophobic regions to become exposed.31,32 Hydrophobic interactions then dominate the gelation causing diffusion of the denatured polymer to the oil/water interface. The oil droplet thus acts as a point for nucleation and growth. Shear imposed upon the system then restricts particle–particle aggregation, preventing a continuous network from forming. As a result, particles grow to an extent permitted by the shear flow, however are primarily dictated by the size of the emulsion droplets.
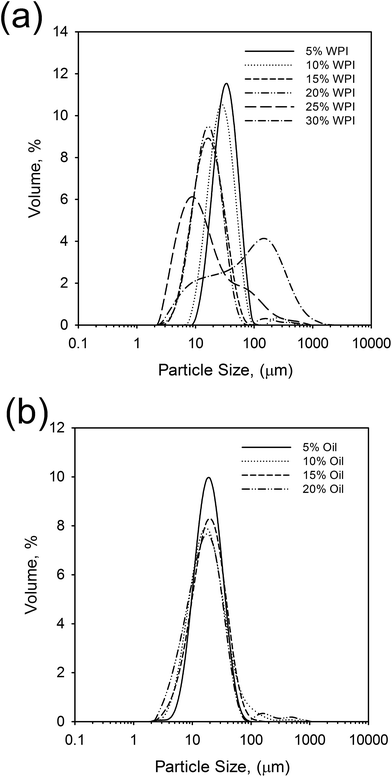
Fig. 4b shows little effect on the resulting particle size as a function of oil fraction, as a result of consistent emulsifier concentrations and unrestricted diffusion of biopolymer to the substrate interface. Thus, all distributions are centred around 25–30 μm complimenting sizes observed via microscopy (Fig. 1 and 3).
3.2. EmFG material properties
To better understand the mechanism through which system elasticity arises, the results obtained have been compared to models already proposed for particulate suspensions. The Krieger–Dougherty (KD) model is used to describe the relationship between relative viscosity (ηrel) and particle phase volume for hard sphere suspensions,36 eqn (3).
 | (3) |
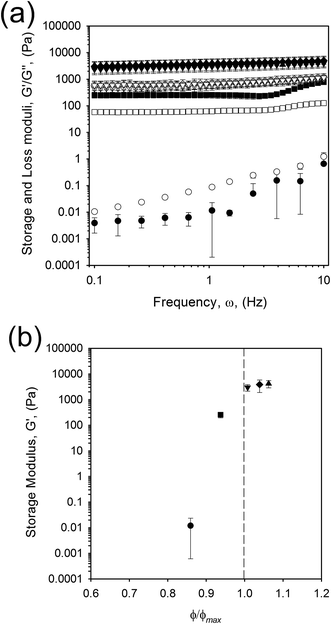
The equation relates the ratio between the phase volume of the suspension, ϕ, to the maximum packing fraction for monodisperse hard spheres (0.64), ϕmax, as a function of the intrinsic viscosity, [η]. What is clear from eqn (3) is that as the maximum packing fraction is approached the relative viscosity will asymptote and eventually the equation fail as the suspension reaches/surpasses the maximum packing. As such, the KD equation cannot be used to describe the correlation observed in Fig. 5b, where the maximum packing fraction for hard spheres has been exceeded.
Similar observations have been reported for agar microgel suspensions,9 where above a critical volume fraction, ϕc, elastic response was observed, becoming insensitive to phase volumes above ϕmax. It was explained that above ϕc, elasticity was a function of the particle modulus; hence particles were typically acting as soft spheres, however the plateauing effect was left unexplained, suggested as an artefact of the phase volume calculation. EmFG are therefore assumed to act as soft spheres. It is suggested that the soft oil core and elastic whey protein shell allows for particle deformation when highly concentrated, reaching phase volumes that exceed those expected for rigid spheres. At such high phase volumes a jamming phenomenon is observed, thus particle rheology mainly represents a function of the shell.37 Hence above a volume fraction of 0.64 particles are packed to an extent that system elasticity is close to those shown for filled quiescent gels,38 hence frequency sweeps show gel-like behaviour (Fig. 5a).
EmFG prepared using 5 vol% oil showed marked storage moduli even though ϕmax had not been reached. Here, elastic response is observed not through the jamming of particles, but assumed to arise from particle trapping as a result of steric confinement through inter-particle interactions. Between ϕc and ϕmax it is argued that EmFG act as a glass where particles become trapped allowing localised motion but not long range diffusion, similarly to results published by Koumakis, et al.37 and le Grand.39 Therefore, the EmFG can be categorised into three regimes; suspended particles below ϕc, glassy between ϕc and ϕmax, and jammed above ϕmax.
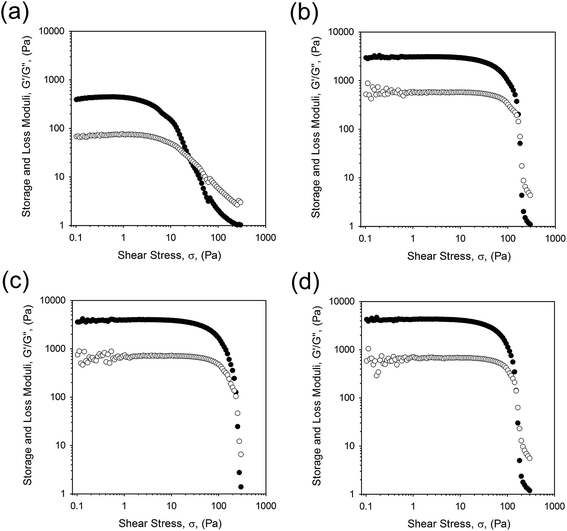 | ||
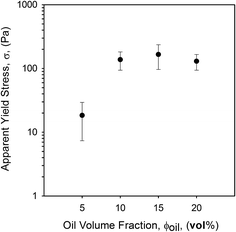
| Fig. 6 Stress sweeps obtained at 1 Hz for EmFG prepared with 20 wt% WPI and (a) 5 vol% oil, (b) 10 vol% oil, (c) 15 vol% oil, and (d) 20 vol% oil. | ||
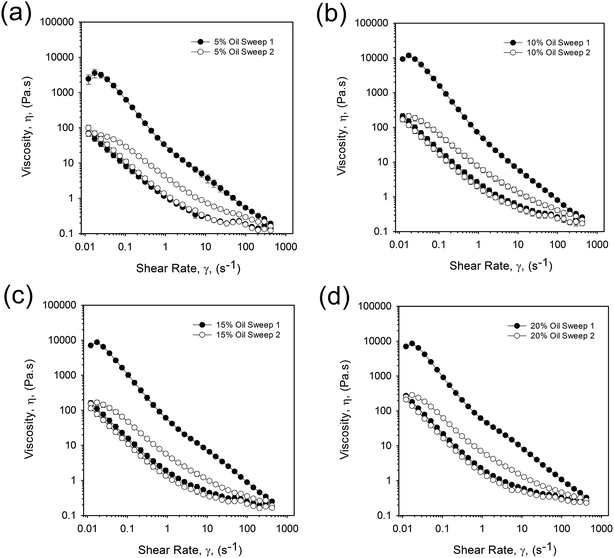 | ||
| Fig. 8 Viscosity profiles obtained for 20 wt% WPI EmFG containing (a) 5 vol% oil, (b) 10 vol% oil, (c) 15 vol% oil, and (d) 20 vol% oil. Closed markers represent sweep 1 and open, sweep 2. | ||
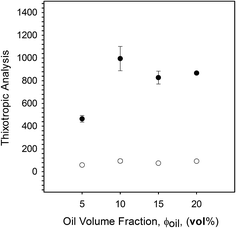
The presence of hysteresis highlighted a thixotropic nature arising through the breakdown of floccules and inter-particle interactions, as seen in Fig. 9. The plot shows a similar correlation as previously observed for yield stresses and frequency sweeps whereby the highly packed systems (10 to 20 vol% oil) have a greater hysteresis. This indicates that jammed systems have a much higher degree of inter-particle interactions as a result of greater packing arising through particle deformation. As expected, where the particles remain unjammed a lower degree of thixotropy is observed, as non-deformed particles present a smaller surface area for inter-particle interactions to occur. However, data obtained for the second sweep showed a similar thixotropic behaviour for all systems, irrespective of oil content. Additionally, a combination of microscopy and light scattering techniques showed that the applied shear was insufficient to break the single particles, with the same particle size distributions observed pre and post shear sweeps (data not shown). As such it is argued that the shear applied throughout the first sweep disrupts the network to an extent that all particles behave as independent spheres. This is followed by restructuring between the particles, but on a scale that is much slower than the break down.
4. Conclusions
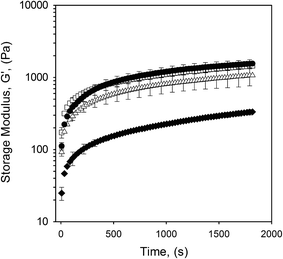
This study has shown that oil droplets can be incorporated into a WPI gel layer by applying a shear-gel technique. Entrapment efficiency was observed to be dependant on the protein concentration, as a function of the viscosity and flow behaviours, reaching up to 99% encapsulation. By applying shear during the WPI sol–gel transition discreet micron sized spherical capsules were obtained, with enhanced structuring properties. Small deformation rheology was used to characterise the suspensions, which showed pseudo-solid like behaviour at rest, however, by applying a shear force to the system that is greater than the yield stress, the suspensions could be made to flow. Suspension rheology highlighted a significant dependence on the oil fraction, with the addition of oil increasing the effective phase volume of the particles, resulting in an increase in particle proximity. Increasing the oil content to around 10 vol% led to packing fractions that exceeded those for hard spheres. As such, particle properties have been expressed as soft and deformable. Flow behaviours of the suspensions were indicative of highly flocculated systems, where marked shear thinning was observed through the break up of weakly aggregated flocs and mesostructures. Furthermore, when left under quiescent conditions the particulate suspensions showed significant recovery, displaying the occurrence of reversible interactions.Acknowledgements
The authors would like to thank the sponsoring bodies including EPSRC, Kerry Group, and also Birmingham Science City: Innovative Uses for Advanced Materials in the Modern World (West Midlands Centre for Advanced Materials Project 2), with support from Advantage West Midlands (AWM) and part funded by the European Regional Development Fun (ERDF), for the use of the confocal microscope used in this research.References
- I. T. Norton, D. A. Jarvis and T. J. Foster, Int. J. Biol. Macromol., 1999, 26, 255–261 CrossRef CAS.
- N. Altmann, J. J. Cooper-White, D. E. Dunstan and J. R. Stokes, J. Non-Newtonian Fluid Mech., 2004, 124, 129–136 CrossRef CAS PubMed.
- J. E. Norton and I. T. Norton, Soft Matter, 2010, 6, 3735–3742 RSC.
- I. Fernández Farrés, R. J. A. Moakes and I. T. Norton, Food Hydrocolloids, 2014, 42(3), 362–372 CrossRef PubMed.
- C. L. A. Berli and D. Quemada, Langmuir, 2000, 16, 7968–7974 CrossRef CAS.
- D. A. Garrec, B. Guthrie and I. T. Norton, Food Hydrocolloids, 2013, 33, 151–159 CrossRef CAS PubMed.
- I. Fernández Farrés, M. Douaire and I. T. Norton, Food Hydrocolloids, 2013, 32, 115–122 CrossRef PubMed.
- A. Gabriele, F. Spyropoulos and I. T. Norton, Food Hydrocolloids, 2009, 23, 2054–2061 CrossRef CAS PubMed.
- S. Adams, W. J. Frith and J. R. Stokes, J. Rheol., 2004, 48, 1195 CrossRef CAS.
- E. Çakır and E. A. Foegeding, Food Hydrocolloids, 2011, 25, 1538–1546 CrossRef PubMed.
- S. M. Fitzsimons, D. M. Mulvihill and E. R. Morris, Food Hydrocolloids, 2008, 22, 485–491 CrossRef CAS PubMed.
- K. Nishinari, H. Zhang and S. Ikeda, Curr. Opin. Colloid Interface Sci., 2000, 5, 195–201 CrossRef CAS.
- I. T. Norton and W. J. Frith, Food Hydrocolloids, 2001, 15, 543–553 CrossRef CAS.
- C. Rocha, J. A. Teixeira, L. Hilliou, P. Sampaio and M. P. Gonçalves, Food Hydrocolloids, 2009, 23, 1734–1745 CrossRef CAS PubMed.
- T. van Vliet, Colloid Polym. Sci., 1988, 266, 518–524 CAS.
- D. B. Genovese, Adv. Colloid Interface Sci., 2012, 171–172, 1–16 CrossRef CAS PubMed.
- E. Dickinson and J. Chen, J. Dispersion Sci. Technol., 1999, 20, 197–213 CrossRef CAS PubMed.
- E. Dickinson, J. Chem. Soc., Faraday Trans., 1998, 94, 1657–1669 RSC.
- E. Dickinson and Y. Matsumura, Int. J. Biol. Macromol., 1991, 13, 26–30 CrossRef CAS.
- D. Sağlam, P. Venema, R. de Vries, L. M. C. Sagis and E. van der Linden, Food Hydrocolloids, 2011, 25, 1139–1148 CrossRef PubMed.
- A. Sullo, R. L. Watson and I. T. Norton, in Gums and Stabilisers for the Food Industry 17: The Changing Face of Food Manufacture: The Role of Hydrocolloids, The Royal Society of Chemistry, 2014, pp. 287–302 Search PubMed.
- D. A. Garrec and I. T. Norton, J. Food Eng., 2012, 112, 175–182 CrossRef PubMed.
- R. J. A. Moakes, A. Sullo and I. T. Norton, Food Hydrocolloids, 2015, 45, 227–235 CrossRef CAS PubMed.
- C. Chung, B. Degner, E. A. Decker and D. J. McClements, Innovative Food Sci. Emerging Technol., 2013, 20, 324–334 CrossRef CAS PubMed.
- A. Matalanis and D. J. McClements, Food Hydrocolloids, 2013, 31, 15–25 CrossRef CAS PubMed.
- Z. Zhang, R. Zhang, E. A. Decker and D. J. McClements, Food Hydrocolloids, 2015, 44, 345–352 CrossRef CAS PubMed.
- A. I. Romoscanu and R. Mezzenga, Langmuir, 2006, 22, 7812–7818 CrossRef CAS PubMed.
- M. Stading and A.-M. Hermansson, Food Hydrocolloids, 1990, 4, 121–135 CrossRef CAS.
- P. Walkenstrom, E. Windhab and A.-M. Hermansson, Food Hydrocolloids, 1998, 12, 459–468 CrossRef CAS.
- A. M. Hermansson, J. Texture Stud., 1975, 5, 425–439 CrossRef CAS PubMed.
- M. A. M. Hoffmann, S. P. F. M. Roefs, M. Verheul, P. J. J. M. van Mil and C. G. de Kruif, J. Dairy Res., 1996, 63, 423–440 CrossRef.
- W. H. Sawyer, J. Dairy Sci., 1968, 51, 323–329 CrossRef CAS.
- D. J. McClements, Food Emulsions Principles, Practices, and Techniques, CRC Press, 2005 Search PubMed.
- P. Walstra, Chem. Eng. Sci., 1993, 48, 333–349 CrossRef CAS.
- S. B. Ross-Murphy, Polym. Gels Networks, 1994, 2, 229–237 CrossRef CAS.
- I. M. Krieger and T. J. Dougherty, J. Rheol., 1959, 3, 137–152 CrossRef CAS.
- N. Koumakis, A. Pamvouxoglou, A. S. Poulos and G. Petekidis, Soft Matter, 2012, 8, 4271–4284 RSC.
- J. Chen, E. Dickinson, M. Langton and A.-M. Hermansson, LWT--Food Sci. Technol., 2000, 33, 299–307 CrossRef CAS.
- A. P. le Grand and G. Petekidis, Rheol. Acta, 2008, 47, 579–590 CrossRef CAS.
- D. Quemada, Eur. Phys. J.: Appl. Phys., 1998, 1, 119–127 CrossRef.
| This journal is © The Royal Society of Chemistry 2015 |

