DOI:
10.1039/C5RA12679G
(Paper)
RSC Adv., 2015,
5, 74366-74373
Validated stability-indicating RP-LC method for the determination of pemirolast potassium investigation of kinetic behavior
Received
4th July 2015
, Accepted 24th August 2015
First published on 24th August 2015
Abstract
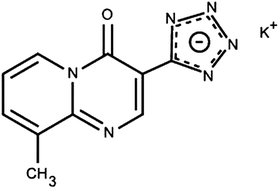
The stability of the anti-asthmatic drug pemirolast potassium was investigated under different stress conditions, including hydrolysis (acid and alkali), heat, light and oxidation as recommended by the ICH guidelines. The degradation process was found to take place only under alkaline and oxidative conditions. A stability-indicating RP-LC method was developed and validated for the determination of pemirolast potassium in the presence of its degradation products and process-related impurities. The chromatographic analysis was achieved on an Eclipse®, XDB-C18 (150 mm × 4.6 mm, 5 μm) column, under isocratic elution by a mixture of water: methanol: glacial acetic acid, pH 3.5 50
:
50
:
0.3 (v/v/v), as a mobile phase, delivered at 1.0 ml min−1 at 258 nm. Method validation was demonstrated to be selective, accurate and precise with good linearity over the concentration range of 1–10 μg ml−1 with limits of detection and quantification of 21 and 69 ng ml−1, respectively. Robustness against small modifications of pH and the percentage of the aqueous mobile phase was ascertained. The developed method was successfully applied for the analysis of pemirolast potassium in commercial eye drops and tablets; therefore it is highly suitable for routine analysis in QC labs. Moreover this method was utilized to investigate the kinetics of the alkaline degradation of pemirolast potassium, determine the order of the degradation rate constant, calculate the rate constant, half-life time and estimate the drug shelf-life (expiry date), and the activation energy of the degradation process.
Introduction
Pemirolast potassium (PP) is a mast cell stabilizer and a leukotriene inhibitor. Chemically, pemirolast potassium is 9-methyl-3-(1H-tetrazol-5-yl)-4H-pyrido[1,2-α]pyrimidin-4-one potassium (Fig. 1). It has been used in the treatment of chronic asthma and in the prophylaxis of allergic rhinitis and conjunctivitis.1 Pemirolast potassium is not official in any pharmacopeia; a literature survey revealed that some HPLC methods were reported for the determination of pemirolast potassium in human plasma and in pharmaceutical products.2–9 To the best of our knowledge; in the literature there is no reported stability-indicating method for the determination of pemirolast potassium in the presence of its degradation products and process-related impurities. Moreover, there is no reported method to investigate the kinetics of the degradation or explain the degradation behavior of the drug. So, the primary objective of this study was to develop an accurate, simple, specific, reproducible, systematic and reliable stability-indicating HPLC method free of placebo interferences to separate and quantify pemirolast potassium in the presence of its degradation products and process-related impurities in a short run time, wherefore; it can be applied during degradation product monitoring studies. The present manuscript described the (i) degradation behavior of pemirolast potassium under alkaline hydrolysis and oxidation stress condition, (ii) optimization of RP-LC conditions to separate the drug, its forced alkaline degradation products and process-related impurity, (iii) method validation and (iv) kinetic investigation of the alkaline degradation.
 |
| Fig. 1 Chemical structure of pemirolast potassium. | |
Results and discussion
Optimization of the chromatographic conditions
The goal of this study is to develop a systematic, reproducible, robust and reliable stability-indicating RP-LC method to separate and quantify pemirolast potassium in the presence of its degradation products and process-related impurity, so, an efficient and comprehensive experimental design based on systematic scouting of the three key HPLC method components including column, mobile phase, and pH conditions was constructed (Table 1). An experimental design of a set of 2 column, 4 mobile phases, and 3 pH values was developed. These chromatographic conditions enable the creation of a database that describes the relationship of the compound retention and possible RP-LC conditions. The method conditions were evaluated for peaks symmetry, peaks fronting, peaks tailing and the resolution. The final method conditions were selected and the evaluation of the test robustness was carried out with appreciate system suitability criteria to improve the overall understanding of the method performance under various conditions.
Table 1 Scouting of three parameters of HPLC
Parameters |
Description of parameters |
Column |
C8 |
C18 |
Mobile phase |
ACN : water |
ACN : water (pH 3.5) |
Methanol : water |
Methanol : water (pH 3.5) |
pH (water), adjusted with glacial acetic acid |
3.5 |
4.5 |
5.5 |
Method development for C8
All the trials are shown in Table 2.
Table 2 Observations and remarks of method development for C8
Trial no. |
Conditions |
Observation |
Remarks |
1 |
ACN : water (35 : 65%, v/v) |
Peak was found to be asymmetrical |
Not satisfactory |
2 |
ACN : water (35 : 65%, v/v pH 3.5) |
Peak was found to be asymmetrical |
Not satisfactory |
3 |
Methanol : water (35 : 65%, v/v) |
Peak was found to be asymmetrical |
Not satisfactory |
4 |
Methanol : water (35 : 65%, v/v pH 3.5) |
Sharp peaks were obtained but tailing factor was more than 1.5 and no complete resolution was observed |
Not satisfactory |
Method development for C18
All the trials are shown in Table 3.
Table 3 Observations and remarks of method development for C18
Trial no. |
Conditions |
Observation |
Remarks |
1 |
ACN : water (35 : 65%, v/v) |
Peak was found to be asymmetrical |
Not satisfactory |
2 |
ACN : water (35 : 65%, v/v pH 3.5) |
Peak was found to be little asymmetrical and tailing was obtained |
Not satisfactory |
3 |
Methanol : water (35 : 65%, v/v) |
Peak was found to be asymmetrical |
Not satisfactory |
4 |
Methanol : water (35 : 65%, v/v pH 3.5) |
Good symmetrical sharp peaks with accepted tailing factors and resolutions |
Satisfactory |
Method development for C18 using different pH conditions
All the trials are shown in Table 4.
Table 4 Observations and remarks of method development for C18 in various pH conditions
Trial no. |
Conditions |
Observation |
Remarks |
1 |
Methanol : water (35 : :65%, v/v pH 4.5) |
Peak was found to be asymmetrical |
Not satisfactory |
2 |
Methanol : water (35 : :65%, v/v pH 5.5) |
Peak was found to be very asymmetrical |
Not satisfactory |
3 |
Methanol : water (35 : :65%, v/v pH 3.5) |
Good symmetrical sharp peaks with accepted tailing factors and resolutions but with long run time (40 min) |
Not satisfactory |
4 |
Methanol : water (50 : :50%, v/v pH 3.5) |
Good symmetrical sharp peaks with accepted tailing factors and resolutions with short run time (20 min) |
Satisfactory |
Final method conditions
Column: Eclipse®, XDB-C18 column (150 mm × 4.6 mm, 5 μm). Mobile phase: methanol: water: glacial acetic acid, pH 3.5 (50
:
50
:
0.3, v/v/v). Flow rate: 1 ml min−1. Oven temperature: 25° C. Detection: DAD at 258 nm. Injection volume: 10 μl. Typical chromatograms are shown in Fig. 2–7.
 |
| Fig. 2 Chromatogram of pemirolast potassium standard. | |
 |
| Fig. 3 Chromatogram of pemirolast potassium after reflux with 1 M HCl for 2 hours. | |
 |
| Fig. 4 Chromatogram of pemirolast potassium after reflux with 0.1 M NaOH for 2 hours. | |
 |
| Fig. 5 Chromatogram of pemirolast potassium after reflux with 5% H2O2 for 2 hours. | |
 |
| Fig. 6 Chromatogram of pemirolast potassium after heating at 105 °C for 5 hours. | |
 |
| Fig. 7 Chromatogram of pemirolast potassium after exposing to light for 5 hours. | |
Method validation
After satisfactory development of the method, it was subjected to method validation as per ICH guidelines.10 The method was validated to demonstrate that it is suitable for its intended purpose by the standard procedure to evaluate adequate validation characteristics (system suitability, specificity, accuracy, precision, linearity, robustness, ruggedness, LOD and LOQ and stability-indicating capability).
System suitability
The system suitability parameters (Table 5) were evaluated by making the injection of the assay standard. The system was deemed to be suitable as the tailing factors for all the peaks were between 0.8 and 1.5 and the resolution between PP, the process-related impurity and the alkaline degradation products was >2.5.
Table 5 The results for the system suitability of the assay standard
Component |
Tailing factor |
USP plate count |
Resolution |
Selectivity |
Process-related impurity |
0.85 |
2077 |
— |
— |
Pemirolast potassium |
0.81 |
4624 |
2.07 |
1.22 |
Alkaline degradation A |
0.85 |
2043 |
2.67 |
1.22 |
Alkaline degradation B |
0.87 |
5189 |
8.57 |
1.81 |
Alkaline degradation C |
0.93 |
6260 |
14.34 |
2.20 |
Specificity
In order to determine whether the developed analytical method was stability-indicating, pemirolast potassium was exposed to various stress conditions (acid hydrolysis, base hydrolysis, oxidation, thermal stress and sunlight) to conduct forced degradation studies as per ICH guidelines.10 PP is very soluble in water. The acidic, basic, and oxidative stress condition studies were carried out by refluxing pemirolast potassium for 2 hours with 1 M HCl, 0.1 M NaOH, and 5% H2O2 respectively. The thermal stress was carried out by heating pemirolast potassium at 105 °C for 5 hours and the photodegradation was performed by exposing pemirolast potassium to sunlight for 5 hours. It is interesting to note that all the peaks due to degradation products were well-resolved with good tailing factors. The chromatograms of the stressed samples were evaluated for peak purity using Agilent software Chemstation 32. For all forced degradation samples, the purity factor of pemirolast potassium exceeded the calculated threshold limit. This confirms the stability-indicating power of the developed method. The results of the forced degradation study are shown in Table 6.
Table 6 The results table for the spasticity of pemirolast potassium
Sample no. |
Stress conditions |
Purity factor |
Calculated threshold limit |
1 |
Sample without effect |
999.079 |
848.050 |
2 |
Acid stress |
999.794 |
420.010 |
3 |
Base stress |
908.311 |
7.390 |
4 |
Oxidation stress |
935.259 |
32.430 |
5 |
Sunlight stress |
999.222 |
795.500 |
6 |
Thermal stress |
999.318 |
786.990 |
Precision
The precision of the test method was evaluated by analyzing three different concentrations of PP; three replicates of each concentration were analyzed within a day to determine the intra-day precision and over three days to determine the inter-day precision. The RSD was found to be below 2.0% which indicates the precision of the method for the quantification of pemirolast potassium. The results are shown in Table 7.
Table 7 The results table of the precision of the test method
Conc (μg ml−1) |
Recovery ± RSD% |
Intra-day |
Inter-day |
1 |
99.21 ± 1.031% |
99.42 ± 0.529% |
4 |
98.81 ± 1.197% |
98.34 ± 1.784% |
8 |
98.91 ± 0.801% |
99.48 ± 0.993% |
Limits of detection and quantification
The limit of detection and the limit of quantification were established based on residual standard deviation of the response and the slope. The LOD and LOQ were found to be 21 and 69 ng ml−1 respectively.
Linearity
Good linearity was established in the concentration range (1–10 μg ml−1) of PP. The data was subjected to statistical analysis using linear regression model; the linear regression equation was Y = 59.4819x + 2.1770. The linear graph was plotted for the concentration (μg ml−1) versus detector response (area). The correlation coefficient was found to be 0.9995. Linearity plot is shown in Fig. 8.
 |
| Fig. 8 Linearity of detector response (area) of pemirolast potassium. | |
Accuracy
Accuracy study for PP was conducted using five different concentrations within the linearity range (3, 5, 7, 9, 10 μg ml−1). Three replicates of each concentration were analyzed and % recovery was found to be between 98.0% and 102.0%. The results are tabulated in Table 8.
Table 8 The results table of the accuracy of the test method
Conc (μg ml−1) |
Recovery |
±RSD% |
3 |
98.517% |
0.975% |
5 |
98.839% |
1.277% |
7 |
99.243% |
1.116% |
9 |
98.687% |
0.454% |
10 |
98.291% |
0.597% |
Robustness
The robustness was investigated by varying the conditions with respect to the flow rate, column temperature and pH of the mobile phase. The study was conducted at three different flow rates (0.95 ml min−1, 1.00 ml min−1 and 1.05 ml min−1), at three different column temperatures (20 °C, 25 °C and 30 °C) and at three different pH (3.4, 3.5 and 3.6) to study the effect of these changes on the different chromatographic parameters. Negligible difference was found in system suitability parameters for pemirolast potassium such as USP plate count, resolution between pemirolast potassium and the process-related impurity and the tailing factor (Table 9), so the method was found to be robust.
Table 9 System suitability results from robustness
Parameters |
Flow rate (ml min−1) |
Column temperature (°C) |
pH |
0.95 |
1.00 |
1.05 |
20 |
25 |
30 |
3.4 |
3.5 |
3.6 |
USP plate count |
5024 |
5058 |
5064 |
5012 |
5058 |
5074 |
5028 |
5058 |
5017 |
Resolution |
3.18 |
3.21 |
3.29 |
3.24 |
3.25 |
3.33 |
3.23 |
3.25 |
3.21 |
Tailing factor |
0.845 |
0.851 |
0.864 |
0.851 |
0.851 |
0.86 |
0.84 |
0.851 |
0.847 |
Kinetic of pemirolast potassium alkaline degradation
Pemirolast potassium samples were collected at different time intervals under various stress conditions. Pemirolast potassium was stable under acidic, thermal and sunlight stress conditions even after 2 hours. However on alkaline and oxidative hydrolysis, pemirolast potassium degraded rapidly within 2 hours and 45 min respectively. Hence, the kinetic of the basic degradation of pemirolast potassium was carried out at [50° C–60° C–70 °C], the Arrhenius plot for the 1/T (K−1) versus; Kobs (hour−10) was drawn, (Fig. 9) and the half-life (hour), degradation rate constant Kobs (hour−10), and activation energy; Ea (kJ mol−1) of the degradation process were calculated. Besides, typical pharmaceutical parameter that describe the expiry date estimation of the drug (shelf life t90) was also calculated (Table 10). The alkaline degradation reaction of PP was found to follow a pseudo first-order kinetic.
 |
| Fig. 9 Arrhenius plot for the alkaline degradation of pemirolast potassium. | |
Table 10 Results of the kinetic of the basic degradation of pemirolast potassium
Temperature (K) |
Degradation rate constant Kobs (hour−10) |
Rate constant half-life (hour) |
Shelf-life (t90) (hour) |
323 |
0.001 |
0.525 |
0.350 |
333 |
0.002 |
0.825 |
0.125 |
343 |
0.004 |
2.310 |
0.080 |
Activation energy Ea (kJ mol−1) |
195.540 |
Experimental
Materials
Pemirolast potassium was supplied by Chemswiss AG, Switzerland. Alegysal® 10 mg tablets, Mitsubishi Tanab Pharma Corporation, Japan. Mirolast® 0.1% eye drops, Sigma Tec Co., for pharmaceutical industries, labeled to contain 1 mg ml−1 pemirolast potassium, was purchased from the local market in Egypt methanol, HPLC grade (Labscan, Ltd, Dublin, Ireland). Acetonitrile, HPLC grade (Labscan, Ltd, Dublin, Ireland). Glacial acetic acid, HPLC grade (Sigma Aldrich, Germany). Glass-distilled water.
Apparatus
An Agilent technologies LC system 1200 series consists of quaternary pump equipped with DAD detector, auto injector and degasser. A thermostatic reversed phase Eclipse®, XDB-C18 column compartment (150 mm × 4.6 mm, i.d. 5 μm) was used for separating all the compounds. The chromatographic data were recorded using Dell computer system with LC solution data acquiring software (Chemstation 32, USA).
Chromatographic conditions
All the samples were analyzed by HPLC on Eclipse®, XDB-C18 column using (methanol: water: glacial acetic acid, pH 3.5) (50
:
50
:
0.3, v/v/v) as a mobile phase, in isocratic elution at a flow rate 1 ml min−1 at ambient column temperature. The detection was carried out by DAD at 258 nm. The mobile phase was filtered through a 0.45 μm nylon membrane filter.
Preparation of standard
PP stock preparation. 0.1 mg ml−1 of PP solution was prepared in water.
Standard preparation (for assay). 1.0 ml of PP stock solution was transferred into a 10 ml volumetric flask and diluted with water and mixed well.
Preparation of degradation products
Forced degradation of PP was carried out according to ICH guidelines. About 10 mg ml−1 of PP was subjected to acidic, basic, heat, light and oxidation conditions by refluxing with 100 ml of 1 M HCl, 0.1 M NaOH, water and 5% H2O2 for 2 hours. The thermal stress was carried out by heating pemirolast potassium at 105 °C for 5 hours and the photodegradation was performed by exposing PP to sunlight for 5 hours. The degradation products of acid and base hydrolysis were neutralized with NaOH and HCl, respectively. While oxidative degradation was evaporated on a boiling water bath. The samples were further diluted ten times with distilled water and filtered through 0.45 μm filter before HPLC analysis.
Sample preparation
About 1.0 ml of Mirolast® eye drops was transferred into 100 ml volumetric flask and diluted with water and mixed well.
Twenty tablets of Alegysal® 10 mg tablets were weighed and grinded, an accurate weight equivalent to the average weight of one tablet was transferred into 100 ml volumetric flask, 60 ml of water were added & sonicated for 30 minutes. The tablet's extract was cooled then the volume was completed with the same solvent, homogenized and filtered through Millipore® filter (0.45 μm). 1 ml was accurately transferred into a 10 ml volumetric flask and the volume was completed with the same solvent.
Conclusion
A systematic, robust, validated and reliable isocratic stability-indicating HPLC method was developed for the determination of pemirolast potassium without any interference of blank, placebo, the process-related impurity and the degradation products, thereby affirming the stability-indicating nature of the method. Furthermore, the paper was utilized to investigate the kinetics of the alkaline degradation of the drug, determine the order of the degradation rate constant, calculate the rate constant, calculate the half-life time and estimate the drug shelf-life (expiry date) and activation energy of the degradation process. The proposed method was started with clear goals and the experimental design describes the scouting of the key HPLC method components. Their relationships are studied and the preliminary optimized conditions are obtained. All the validation parameters were found within accepted criteria. This developed method can be applied successfully to the quality control of the commercials and other routine analysis.
References
- S. C. Sweetman, Martindale. The Complete Drug Reference, The Pharmaceutical Press, London, 36th edn, 2009, vol. 1, pp. 1129–1130 Search PubMed.
- H. Cheng, K. A. Pittman and K. A. Dandekar, J. Pharm. Sci., 1987, 76, 918–919 CrossRef CAS PubMed.
- S. W. Yang, C. Rong and H. Y. Zhu, Chin. J. Pharm., 2003, 34, 573–574 Search PubMed.
- S. W. Yang, Q. Feng, M. Yuefeng and X. De, Chin. Pharm. J., 2004, 39, 62–64 Search PubMed.
- L. Chunliang, Chin. Pharm. Aff., 2013, 27, 718–721 Search PubMed.
- S. Zheng-rong, Y. Ai-Chun and D. Lan, Chin. J. New Drugs, 2005, 14, 594–596 Search PubMed.
- X. Nan and Y. W. Shen, Jiangsu Pharmaceutical and Clinical Research, 2004, vol. 12, pp. 7–8 Search PubMed.
- W. Wenyi, P. F. Jun, H. Y. Yuan and G. Tong-ling with, Qilu Pharm. Aff., 2008, 27, 22–24 Search PubMed.
- L. Wei, Z. J. Statue, T. Yuan, S. Jianping and Z. Yindi, J. China Pharm. Univ., 2005, 36, 48–51 CAS.
- International Conference on Harmonization, Guideline on Validation of Analytical Procedure. Text and Methodology, ICH – Q2 (R1); 2005.
|
This journal is © The Royal Society of Chemistry 2015 |
Click here to see how this site uses Cookies. View our privacy policy here.