Sandwich-like cobalt sulfide–graphene composite – an anode material with excellent electrochemical performance for sodium ion batteries†
Qian Zhou,
Li Liu*,
Guoxiong Guo,
Zichao Yan,
Jinli Tan,
Zhifeng Huang,
Xiaoying Chen and
Xianyou Wang*
Key Laboratory of Environmentally Friendly Chemistry and Applications of Ministry of Education, School of Chemistry, Xiangtan University, Hunan, Xiangtan 411105, China. E-mail: liulili1203@126.com; wxianyou@yahoo.com; Fax: +86-731-58292477; Tel: +86-731-58292206
First published on 18th August 2015
Abstract
Recently, sodium-ion batteries have been considered alternatives to lithium-ion batteries. However, the poor cycling performance and unsatisfactory rate capability of existing anodes hinder the development of sodium-ion batteries. Here we fabricate a sandwich-like cobalt sulfide–reduced graphene oxide (CoS/rGO) composite using a hydrothermal method as the anode material for sodium ion batteries. According to the SEM analysis, CoS nanoparticles anchor on both sides of the reduced graphene oxide nanosheets in such a way that the nanoporous structure with a large amount of void spaces can be prepared. And the cycling performance of the sandwich-like CoS/rGO composite is drastically enhanced compared with that of the bare CoS nanoparticles. After 100 cycles, the discharge capacity of CoS/rGO still remains at 230 mA h g−1, while the specific capacity of the bare CoS nanoparticles at the first cycle is 601 mA h g−1, dropping rapidly to 68 mA h g−1 after only 40 cycles. Furthermore, CoS/rGO gives an excellent rate capability even up to a large current of 2 A g−1. It is noted that the synergistic effect between CoS and graphene can contribute to the improved electrochemical performance.
1. Introduction
Currently, demands for lithium ion batteries (LIBs) are increasing for applications in high-power tools and electric vehicles.1 However, one should always be prepared for the limited natural abundance and uneven global distribution of lithium resources.2 Sodium-ion batteries (NIBs) are considered substitutes for LIBs due to the lower cost and earth-abundant nature of Na.3,4 One of the main obstacles to the development of NIBs is the shortage of anode materials with good stability and excellent rate performance.5 The graphite, which is the most common anode material for Li-ion batteries, is unavailable for a Na+-insertion host.6 Owing to large interlayer distance and disordered structure, the hard carbon is considered as a suitable anode material for Na-ion batteries.7 However, it would result in sodium metal deposition on surface in an improper operation due to relatively low sodium storage voltage of hard carbon, giving rise to major safety concern.2 Recently, because of high theoretical capacity, metal sulfides have also been considered as a promising class of materials.8–10 In particular, cobalt sulfides (CoS, CoS2, Co3S4, Co9S8, etc.) have attracted great interests for their superior chemical, physical, electronic qualities and their wide potential applications in catalysts,11,12 electrochemical supercapacitors13–15 and lithium ion batteries.16–19 For instance, Wang et al. fabricated the 3D flower-like CoS hierarchitectures via a facile one-pot solvothermal route. And the flower-like CoS showed a high discharge capacity (800–900 mA h g−1) as lithium ion batteries anode material.20 Although the theoretical capacity of CoS is comparatively high (589 mA h g−1) as lithium ion battery anode, the less satisfactory cycling stability and rate capability hinder their further applications. Moreover, there are very few reports about cobalt sulfides applied in sodium ion battery. Recently, Du et al. synthesized Co3S4/graphene composite and shown good electrochemical performance (329 mA h g−1 after 50 cycles) as Na-ion battery anode material.21 However, to the best of our knowledge, there is no report on the exploration of CoS anodes for sodium ion batteries, and it is interesting to investigate its utilization for sodium ion batteries. Furthermore, in order to overcome the defects of poor cycling stability and rate capability of CoS, a new design of CoS-based composite should be developed.As we all known, two-dimensional (2D) graphene, a one-atom thick sheet of sp2-bonded carbon, has attracted much attention due to their unique 2D morphology and superior properties, such as excellent electronic conductivity, large surface area, high charge mobility, good flexibility, superior chemical and thermal stability.22–24 The graphene with multiple advantages has potential to be applied in lithium and sodium ion batteries (theoretical capacity 744 mA h g−1). For example, Gu et al. prepared CoS nanoparticles wrapped by graphene and found that CoS/rGO exhibits a high capacity of 749 mA h g−1 while the pristine CoS exhibits only 241 mA h g−1 after 40 cycles at 0.1C.25 Therefore, it is expected the cobalt sulfide composites with graphene have a better electrochemical performance compared with bare cobalt sulfide.
Herein, this work reports the facile synthesis of sandwich-like CoS/rGO composite by hydrothermal method. Our key strategy in this work is to develop nanostructured CoS/rGO electrodes in which the CoS nanoparticles can be uniformly distributed on the graphene nanosheet with tight adhesion. The synergistic effect of CoS and graphene plays a crucial role in the improvement of the electrochemical performance of CoS/rGO electrodes.
2. Experimental
2.1. Preparation of CoS and CoS/rGO nanocomposites
The preparation of CoS/rGO was conducted by a facile hydrothermal method. Typically, 0.1 g poly(vinyl pyrrolidone) (PVP; K30) and 0.005 g reduced graphene oxide (The sixth element Co. Ltd, Changzhou) were dissolved into 5 mL of distilled water, followed by the addition of CoCl2·6H2O (0.2 mmol) and sodium citrate (0.4 mmol) under stirring. And thioacetamide (0.5 mmol) was dissolved into another 5 mL of distilled water. Then the thioacetamide solution was added slowly to the above solution under stirring. Finally, the resulting solution was transferred into a 100 mL Teflon-lined stainless steel autoclave, sealed and heated in an oven at 160 °C for 24 h. After the autoclave was cooled to room temperature, the resulting black products were washed several times with distilled water and absolute ethanol, and dried under vacuum at 60 °C for 8 h. Finally, the as-prepared CoS/rGO was heat at 400 °C for 2 h in argon gas. The preparation of CoS/rGO composite can be briefly described by the following process, as shown in Fig. 1. For properties comparison, pristine CoS was prepared following the same procedure in the absence of graphene.2.2. Structure and morphology characterization
The CoS/rGO composites and bare CoS were characterized by X-ray diffraction (XRD Rigaku D/MAX-2500 with Cu Kα radiation, λ = 0.15418 nm) and operated at a scan rate of 5° min−1 in the 2θ range of 20°–80°. Scanning electron microscope (SEM) images of the samples were obtained using a JEOL JSM-6610 scanning electron microscope, which were used to characterize the morphology of the samples. Besides, transmission electron microscopy (TEM) and high-resolution transmission electron microscopy (HRTEM) were carried out using a JEOL JEM-2100F transmission electron microscope operating at 200 kV. An atomic force microscopy (AFM) instrument (MUITIMODEPICOFOREE) was used to measure the thickness of graphene. Brunauer–Emmett–Teller (BET) measurements were performed using a TriStar II 3020 surface area analyzer. Raman spectra were conducted on a Jobin Yvon Labor Raman HR-800 spectrometer with argon ion laser of 514.5 nm. Thermogravimetric (TG) analysis was conducted on a TGA 50 instrument in air at a heating rate of 10 °C min−1 from 30 °C to 700 °C.2.3. Electrochemical characterization
The working electrodes for sodium cells were fabricated by mixing the as-synthesized samples, acetylene black, and polyvinylidene fluoride (PVDF) binder with a weight ratio of 80![[thin space (1/6-em)]](https://www.rsc.org/images/entities/char_2009.gif) :
:![[thin space (1/6-em)]](https://www.rsc.org/images/entities/char_2009.gif) 10
10![[thin space (1/6-em)]](https://www.rsc.org/images/entities/char_2009.gif) :
:![[thin space (1/6-em)]](https://www.rsc.org/images/entities/char_2009.gif) 10 in N-methyl-pyrrolidinone and pasting on copper foil. Then electrodes were taken to vacuum oven at 110 °C for 12 h. The average mass loading of active materials is 1.861 mg cm−2 in this work. The testing cells were assembled with the working electrode thus fabricated, metallic sodium anode, glass fiber separator (Whatman GF/F) and 1 M NaClO4 in propylene carbonate (PC) electrolyte. The testing cells were assembled in an argon-filled glove box, where the concentration of water and oxygen were kept lower than 5 ppm.
10 in N-methyl-pyrrolidinone and pasting on copper foil. Then electrodes were taken to vacuum oven at 110 °C for 12 h. The average mass loading of active materials is 1.861 mg cm−2 in this work. The testing cells were assembled with the working electrode thus fabricated, metallic sodium anode, glass fiber separator (Whatman GF/F) and 1 M NaClO4 in propylene carbonate (PC) electrolyte. The testing cells were assembled in an argon-filled glove box, where the concentration of water and oxygen were kept lower than 5 ppm.
All the cells were aged for 12 h before testing to ensure complete electrode wetting by the electrolyte. The charge–discharge cycle tests of NIBs were performed at different current densities between 0.05–2.0 V. Cyclic voltammetry (CV) and EIS tests were run on a Zahner Zennium electrochemical workstation. CV tests were performed at a scan rate of 0.1 mV s−1 on the potential interval 0.05–2.0 V (vs. Na+/Na). EIS tests applied a sine wave with an amplitude of 5 mV and the frequency range was from 0.1 Hz to 100 KHz. All the tests were carried out at room temperature.
3. Results and discussion
3.1. Characterizations of morphology and structure
The crystallographic structures of CoS, reduced graphene oxide and CoS/rGO were analyzed by X-ray powder diffraction (XRD) in Fig. 2a. All the diffraction peaks of the CoS/rGO nanocomposite can be indexed to CoS (PDF No. 75-0605). No other phases of cobalt sulfide impurities such as Co3S4, CoS2 are detected, indicating the phase purity of CoS in the product. And the (002) reflection peak of reduced graphene oxide is not obvious, possibly because the disordered reduced graphene oxide structure is obtained. The graphene and CoS/rGO nanocomposite were then characterized by Raman spectroscopy (as shown in Fig. 2b). From the Raman spectra of both CoS/rGO and graphene nanosheets, the high intensity D band and G band are located around 1327 cm−1 and 1587 cm−1. The D/G intensity ratio of the CoS/rGO nanocomposite (1.26) is higher than that of the bare graphene nanosheets (1.14), which indicates a further decreased sp2 carbon domain when CoS nanoparticles are embedded between graphene nanosheets.25,26 Fig. 2c gives the TGA graphs of both CoS/rGO and bare CoS. The TGA measurement identified the weight losses of both CoS/rGO and bare CoS from room temperature to 700 °C in air. For bare CoS, the increase could be related to CoS oxidation to CoSO4 from 30 °C to 450 °C. And the CoSO4 decomposes into Co3O4 and CoO from 450 °C to 600 °C. However for CoS/rGO composite, there is a decomposition process of graphene besides above process. The burning process of graphene happens from 500 °C to 650 °C. The weight loss of CoS/rGO composite is mainly made up of oxidation of CoS and graphene. The weight percentage of graphene content is the difference between weight loss of CoS/rGO composite and bare CoS. So it can be speculated that the content of graphene in the CoS/rGO nanocomposite is about 21.1 wt% according to TG analysis.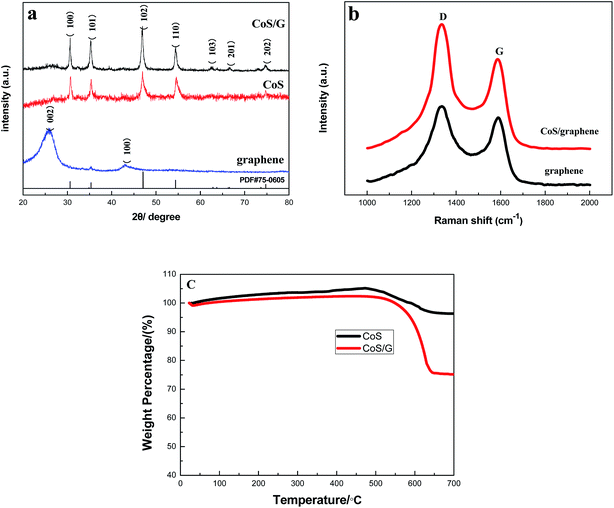 | ||
| Fig. 2 (a) XRD patterns of graphene, CoS and CoS/rGO composite; (b) Raman spectra of CoS/rGO and graphene; (c) TGA curves of CoS/rGO and CoS in air ranging from room temperature to 700 °C. | ||
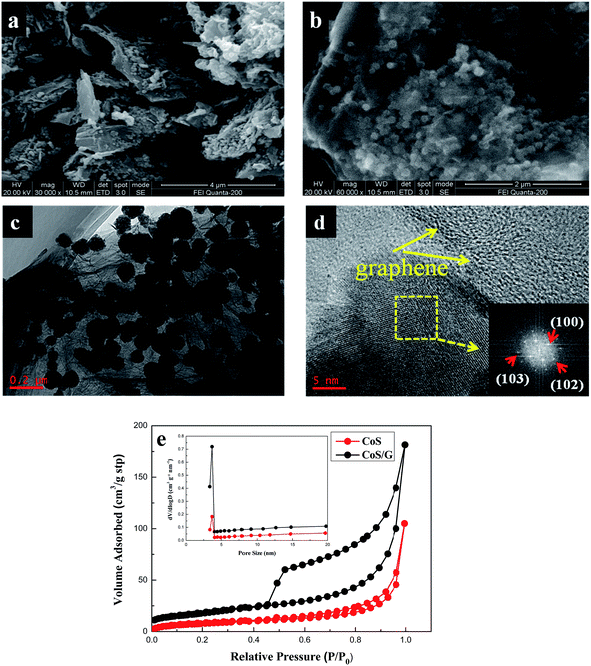
SEM, TEM and HRTEM observations on the CoS/rGO nanocomposite are presented in Fig. 3. Fig. 3a and b are scanning electron microscopy (SEM) images of CoS/rGO, from which a large number of CoS nanocrystals anchored on the graphene sheets can be observed. The CoS/rGO architecture possesses a hybrid structure with pores, ranging from several nanometers to several micrometers in size. From Fig. 3b, it can be clearly observed that the CoS nanoparticles decorated on graphene nanosheets very well, which densely and evenly anchored on both sides of graphene sheets to form a sandwich-like composite structure. And the graphene layers in the CoS/rGO consist possibly of wrinkled few-layer sheets. As shown in Fig. S1,† the thickness of graphene is measured to about 1.1 nm. It is obvious that nanostructured CoS/rGO in which the dimensional confinement of CoS nanoparticles by the surrounding graphene nanosheets can limit the volume expansion upon sodium insertion. TEM image in Fig. 3c presents the particles of CoS with a diameter about 100 nm. However, bare CoS tends to grow into micron or sub-micron particles (Fig. S2†). It should be stressed that the graphene nanosheets act as nucleation sites for CoS. So it plays an important role in inhibiting the aggregation of CoS particles. HRTEM (see Fig. 3d) analysis is employed to determine the crystal facets. Fig. 3d shows that CoS/rGO display clear crystal lattices, and its fast-Fourier transform (FFT) image of the same region (inset) reveals that the diffraction spots have a lattice spacing related to the (100), (102) and (103) planes, which is in good agreement with the XRD results (Fig. 2a). Another phenomenon is that, even after a long time of sonication during the preparation of the TEM sample, the CoS nanoparticles are still strongly decorated on the surface of graphene sheets with a high density, as shown in Fig. 3c, suggesting the strong interaction between CoS nanoparticles and graphene sheets. In addition, the strong anchoring of CoS nanoparticles on graphene sheets enables fast electron transport through the underlying graphene layers to CoS to improve the electrochemical performance.27 Fig. 3e shows the N2 adsorption/desorption isotherm curves of CoS and CoS–graphene composite. The specific Brunauer–Emmett–Teller (BET) surface area of CoS/rGO composite is 90.4 m2 g−1, which is substantially larger than bare CoS (13.1 m2 g−1). Both CoS–graphene composite and bare CoS show a similar average pore size of about 3.68 nm (the inset of Fig. 3e). The enhanced specific surface area of the composite can not only increase the surface active sites, but also facilitate the transport of charge carriers and sodium diffusion.
3.2. Electrochemical analysis
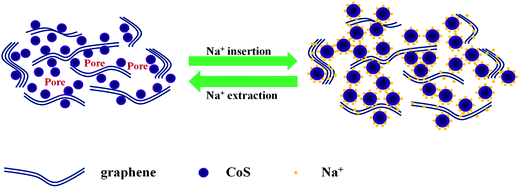
The electrochemical properties of CoS/rGO composite as sodium insertion electrodes were studied in order to examine the effectiveness of the integration of graphene in improving the electrochemical performance of CoS electrode. As shown in Fig. 4a, the discharge capacity of bare CoS drops from 601.7 to 68.1 mA h g−1 sharply after 40 cycles, with a large capacity loss of 88.7%. It is apparent that CoS shows a huge irreversible capacity loss on the first several cycles and low capacity retention after 100 cycles. The huge capacity fading of Na is ascribed to the first 20 cycles, which might be attributed to the instability caused by structure deformation during cycling. However, the introduction of graphene not only buffers the volume changes and but also prevents CoS nanoparticles from aggregating. CoS/rGO composite delivers discharge capacity of 567.3 mA h g−1 at the first discharge process, and the capacity of 230.8 mA h g−1 is finally remained after 100 cycles. Moreover, with the increasing of the cycle numbers, the charge capacity of CoS/rGO composite is getting stable and the coulombic efficiency is nearly 100% after the first several cycles. Compared with CoS, the capacity of CoS/rGO composite decreases in the initial several cycles and it turns to be stable in the following cycles, which indicates a better cycling performance in NIBs. And the relationship plot between specific capacity and cycle number for pure graphene electrode in the range of 0.05 V–2.0 V in Na half-cells was utilized to present the sodium storage performance of pure graphene. The pure graphene delivers a high discharge capacity of 620.2 mA h g−1 at the first discharge process, and the capacity of about 90 mA h g−1 is obtained from the second cycle to 100 cycles. It is obvious that the discharge capacity of CoS/rGO composite is much higher than pure graphene except the first cycle. As illustrated in Fig. 5, the adhesion between the graphene nanosheets cushion and CoS nanoparticles can effectively mitigate the aggregation and volume change of the CoS nanoparticles. Furthermore, the voids between the CoS/rGO nanosheets provide sufficient space for a huge volume change during the charge–discharge processes. Additionally, it is noteworthy that the synergistic effect among CoS nanoparticles and graphene can make contribution to the improved electrochemical performance.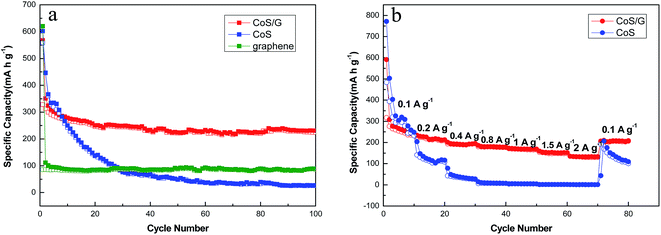 | ||
| Fig. 4 (a) Cycling performance of CoS, graphene and CoS/rGO electrodes at 0.1 A g−1 for 100 cycles, respectively; (b) rate performance of CoS and CoS/rGO electrodes. | ||
In addition, the CoS/rGO composite shows much better rate capability compared with the CoS electrode operated at different current densities between 0.1 and 2 A g−1 (Fig. 4b). For each stage, the process was taken with 10 cycles. The CoS delivers discharge capacity of 247.8 mA h g−1 at current density of 0.1 A g−1 after 10 cycles. However, the specific discharge capacity sharply reduces to 116.1 and 27.5 mA h g−1 at the current density of 0.2 and 0.4 A g−1, respectively. Obviously, there is almost no capacity remained from current density of 0.8 to 2.0 A g−1. After the high current density of 2 A g−1, the specific discharge capacity of 109.5 mA h g−1 is finally remained when reducing the current density to 0.1 A g−1. Clearly, CoS/rGO composite has the better rate performance in capacities deliverable at various rates: the CoS/rGO composite electrode is initially cycled at 0.1 A g−1 where the capacity stabilized to 235.6 mA g−1 after 10 cycles. Even at the high current density of 2 A g−1, the specific charge capacity still remains at 132.9 mA h g−1. After deep cycling at high current density, a discharge capacity of 206.1 mA h g−1 is restored upon reducing the current density to 0.1 A g−1. The discharge–charge profiles of CoS/rGO composite and CoS at various current densities are shown in Fig. S3.† The CoS/rGO composite and bare CoS has similar discharge–charge curves. However, the bare CoS decreases more steeply as increasing the current densities. In conclusion, CoS/rGO composite performs much superior rate performance than bare CoS. These results suggest that the introduction of graphene offers 2D conductive networks and enhances the charge transfer rate, leading to superior rate capability.
Cyclic voltammetry (CV) of CoS and CoS/rGO composite were performed in the 0.05 to 2.0 V potential region at 0.1 mV s−1 (Fig. 6a and b). There are some consensuses about the common voltammetric features although the sodium ion storage mechanism has yet to be exactly known. The peak at 0.8 V in the first cathodic process is commonly attributed to conversion and alloying reactions:28,29 CoS + 2Na+ + 2e− → Na2S + Co. The peak at 0.6 V is assigned to the formation of the solid electrolyte interphase (SEI) film. Indeed the cathodic peak at 0.8 V is positively shifted to 0.9 V in the second and third cycles, which indicates the good reversibility and predominance of the storage reactions. For the anodic process, there is a strong oxidation peak at 1.8 V, which can be assigned to the oxidation reaction of Co metal: Co + Na2S → 2Na + CoS. The second cycle of CoS/rGO composite is largely overlapped with the third cycle, but there is substantial decrease of the peak intensity for bare CoS. It is indicated that the sodium insertion and extraction reactions between sodium ions and CoS/rGO composite are more reversible compared to pristine CoS anode. The first three cycles discharge and charge curves of the CoS/rGO composite and bare CoS are shown in Fig. 6c and d. The voltage plateaus agree well with the corresponding CV curves. For comparison, we also give the CV curves of pure graphene (Fig. S4†) fabricated by the same procedure and electrochemical conditions. However, there is no obvious voltage plateau observed for pure graphene. The first discharge and charge capacities are 620.2 and 85.9 mA h g−1 for graphene, 601.8 and 558.1 mA h g−1 for CoS, and 567.3and 327.9 mA h g−1 for CoS/rGO composite. The initial capacity loss may result from the incomplete conversion reaction and irreversible sodium loss owing to the formation of a solid electrolyte interphase (SEI) layer.30 Since the second cycle, the overlapping voltage profiles of CoS/rGO composite demonstrate the enhanced electrochemical reversibility when compared with bare CoS.
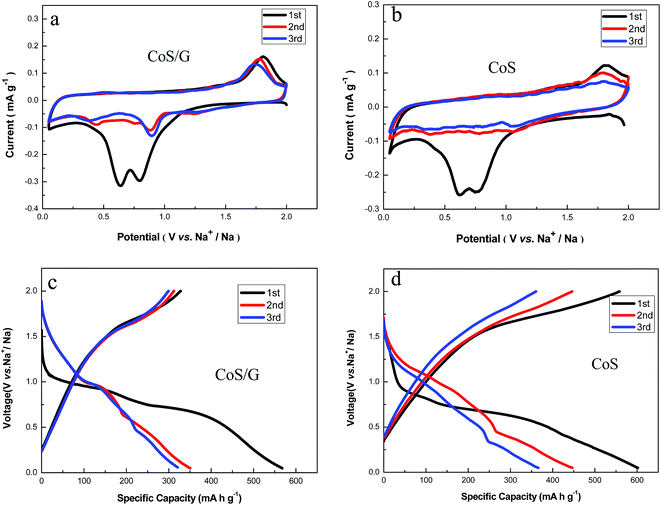 | ||
| Fig. 6 Representative cyclic voltammograms at a scan rate of 0.1 mV s−1: (a) CoS/rGO, (b) bare CoS; the first three cycles discharge and charge curves: (c) CoS/rGO, (d) bare CoS. | ||
XRD of the electrodes taken at different states of discharge and charge during the first cycle is given in Fig. 7 for further elucidating the charge–discharge process: (a) fresh electrode, (b) discharged to 0.05 V, (c) charged to 2.0 V. The fresh electrode shows crystalline CoS diffraction pattern in Fig. 7a. The peaks of Na2S and Co appeared when the electrode discharged to 0.05 V in Fig. 7b. It can be attributed to the reaction: 2Na+ + CoS + 2e− → Co + Na2S. Upon charging to 2.0 V, the Na2S and Co peaks disappeared completely with the re-appearance of the CoS peaks in Fig. 7c which is due to the reaction: Co + Na2S → 2Na + CoS. The result of XRD pattern is consistent with the CV of CoS, indicating that the speculation about charge–discharge mechanism of CoS is reasonable.
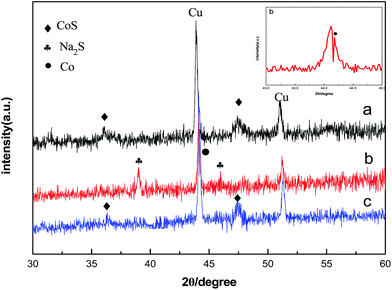 | ||
| Fig. 7 Ex situ XRD patterns of CoS at different Na-storage stages: (a) fresh electrode, (b) discharge 0.05 V, (c) charge to 2.0 V. | ||
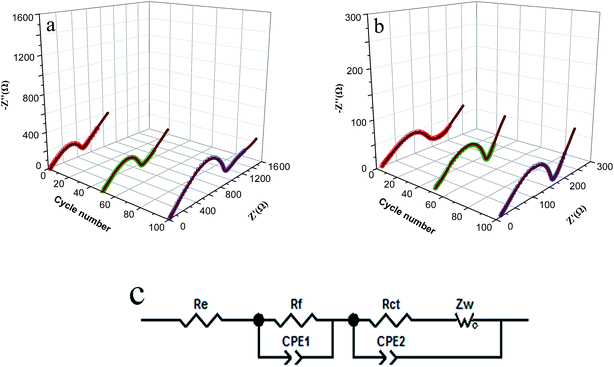
To further understand the outstanding electrochemical performance of CoS/rGO composite, the three-dimensional Nyquist plots of CoS and CoS/rGO electrodes after different numbers of cycling at around 1.3 V are shown in Fig. 8. For both electrodes, the Nyquist plots consist of two partly overlapped semicircles in the high-to-middle frequency region and a slopping line in the low frequency region. Nyquist plots are fitted with the equivalent circuit model (Fig. 8c), and the fitted impedance data are listed in Table 1. In the equivalent circuit, the semicircle in the medium frequency denotes to the Rct, which represents to charge transfer resistance. The Rct of CoS sample is 369.2 Ω after 1 cycle, and this value increases to 864.7 Ω after 100 cycles, which is consistent with the trend of huge capacity loss during the 100 cycles. However, the Rct of the CoS/rGO sample is 86.8 Ω after 1 cycle, while this value only increases to 97.6 Ω after 100 cycles. It is well-known that the lower increase of charge transfer resistance during cycling means better cycle performance. These results are consistent with the excellent electrochemical performance of CoS/rGO composite.
| Samples | Re | Rf | Rct | ||||||
|---|---|---|---|---|---|---|---|---|---|
| 1st | 50th | 100th | 1st | 50th | 100th | 1st | 50th | 100th | |
| CoS | 11.4 | 11.8 | 12.1 | 29.1 | 41.3 | 58.0 | 369.2 | 587.5 | 864.7 |
| CoS/rGO | 10.6 | 10.9 | 11.3 | 25.3 | 31.0 | 31.8 | 86.8 | 97.1 | 97.6 |
4. Conclusions
In summary, CoS/rGO with sandwich-like structure has been fabricated by a facile hydrothermal method, in which CoS nanoparticles with a size of 100–150 nm are uniformly decorated on both sides of the graphene nanosheets. The graphene plays an important role in improving the electrochemical performance of CoS/rGO composite. The improvement of cycling performance is due to the introduction of the flexible graphene that not only hinders CoS nanoparticles from aggregating and but also eases off the volume changes. Furthermore, the introduced graphene provides 2D conductive networks and improves the charge transfer rate, resulting in excellent rate performance. The outstanding electrochemical properties of CoS/rGO indicate that it is a promising anode material for sodium ion batteries.Acknowledgements
This work was financially supported by the National Natural Science Foundation of China (grant no. 51202209), the Key Project Doctoral Fund of Ministry of Education of China (grant no. 20114301120007) and Hunan Provincial Natural Science Foundation of China (grant no. 14JJ6017).References
- K. T. Kim, G. Ali, K. Y. Chung, C. S. Yoon, H. Yashiro, Y. K. Sun, J. Lu, K. Amine and S. T. Myung, Nano Lett., 2014, 14, 416 CrossRef CAS PubMed.
- Y. Sun, L. Zhao, H. Pan, X. Lu, L. Gu, Y. S. Hu, H. Li, M. Armand, Y. Ikuhara and L. Q. Chen, Nat. Commun., 2013, 4, 1870 CrossRef PubMed.
- S.-W. Kim, D.-H. Seo, X. H. Ma, G. Ceder and K. Kang, Adv. Energy Mater., 2012, 2, 710 CrossRef CAS PubMed.
- M. D. Slater, D. Kim, E. Lee and C. S. Johnson, Adv. Funct. Mater., 2013, 23, 947 CrossRef CAS PubMed.
- V. L. Chevrier and G. Ceder, J. Electrochem. Soc., 2011, 158, A1011 CrossRef CAS PubMed.
- P. Thomas, J. Ghanbaja and D. Billaud, Electrochim. Acta, 1999, 45, 423 CrossRef CAS.
- Y. L. Cao, L. F. Xiao, M. L. Sushko, W. Wang, B. Schwenzer, J. Xiao, Z. M. Nie, L. V. Saraf, Z. G. Yang and J. Liu, Nano Lett., 2012, 12, 3783 CrossRef CAS PubMed.
- D. D. Vaughn, O. D. Hentz, S. R. Chen, D. H. Wang and R. E. Schaak, Chem. Commun., 2012, 48, 5608 RSC.
- L. Fei, Q. L. Lin, B. Yuan, G. Chen, P. Xie, Y. L. Li, Y. Xu, S. G. Deng, S. Smirnov and H. M. Luo, ACS Appl. Mater. Interfaces, 2013, 5, 5330 CAS.
- D. Y. W. Yu, P. V. Prikhodchenko, C. W. Mason, S. K. Batabyal, J. Gun, S. Sladkevich, A. G. Medvedev and O. Lev, Nat. Commun., 2013, 4, 3922 Search PubMed.
- R. C. Hoodless, R. B. Moyes and P. B. Wells, Catal. Today, 2006, 114, 377 CrossRef CAS PubMed.
- H. L. Wang, Y. Y. Liang, Y. G. Li and H. J. Dai, Angew. Chem., Int. Ed., 2011, 50, 10969 CrossRef CAS PubMed.
- P. Justin and G. R. Rao, Int. J. Hydrogen Energy, 2010, 35, 9709 CrossRef CAS PubMed.
- Q. H. Wang, L. F. Jiao, H. M. Du, J. Q. Yang, Q. N. Huan, W. X. Peng, Y. C. Si, Y. J. Wang and H. T. Yuan, CrystEngComm, 2011, 13, 6960 RSC.
- K. Dai, D. P. Li, L. H. Lu, Q. Liu, J. L. Lv and G. P. Zhu, RSC Adv., 2014, 4, 29216 RSC.
- R. D. Apostolova, E. M. Shembel, I. Talyosef, J. Grinblat, B. Markovsky and D. Aurbach, Russ. J. Electrochem., 2009, 45, 311 CrossRef CAS.
- Y. Kim and J. B. Goodenough, J. Phys. Chem. C, 2008, 112, 15060 CAS.
- A. Debart, L. Dupont, R. Patrice and J. M. Tarascon, Solid State Sci., 2006, 8, 640 CrossRef CAS PubMed.
- P. J. Masset and R. A. Guidotti, J. Power Sources, 2008, 178, 456 CrossRef CAS PubMed.
- Q. H. Wang, L. F. Jiao, H. M. Du, W. X. Peng, Y. Han, D. W. Song, Y. C. Si, Y. J. Wang and H. T. Yuan, J. Mater. Chem., 2011, 21, 327 RSC.
- Y. C. Du, X. S. Zhu, X. S. Zhou, L. Y. Hu, Z. H. Dai and J. C. Bao, J. Mater. Chem. A, 2015, 3, 6787 CAS.
- C. Lee, X. D. Wei, J. W. Kysar and J. Hone, Science, 2008, 321, 385 CrossRef CAS PubMed.
- Y. M. Lin, C. Dimitrakopoulos, K. A. Jenkins, D. B. Farmer, H. Y. Chiu, A. Grill and P. Avouris, Science, 2010, 327, 662 CrossRef CAS PubMed.
- A. S. Arico, P. Bruce, B. Scrosati and J. M. Tarascon, Nat. Mater., 2005, 4, 366 CrossRef CAS PubMed.
- Y. Gu, Y. Xu and Y. Wang, ACS Appl. Mater. Interfaces, 2013, 5, 801 CAS.
- S. Stankovich, D. A. Dikin, R. D. Piner, K. A. Kohlhaas, A. Kleinhammes, Y. Jia, Y. Wu, S. T. Nguyen and R. S. Ruoff, Carbon, 2007, 45, 1558 CrossRef CAS PubMed.
- S. M. Paek, E. J. Yoo and I. Honma, Nano Lett., 2009, 9, 72 CrossRef CAS PubMed.
- S. F. Kong, Z. T. Jin, H. Liu and Y. Wang, J. Phys. Chem. C, 2014, 118, 25355 CAS.
- Y. M. Wang, J. J. Wu, Y. F. Tang, X. J. Lü, C. Y. Yang, M. S. Qin, F. Q. Huang, X. Li and X. Zhang, ACS Appl. Mater. Interfaces, 2012, 4, 4246 CAS.
- W. L. Yao, J. Yang, J. L. Wang and Y. Nuli, J. Electrochem. Soc., 2008, 155, A903 CrossRef CAS PubMed.
Footnote |
| † Electronic supplementary information (ESI) available: See DOI: 10.1039/c5ra12478f |
| This journal is © The Royal Society of Chemistry 2015 |


