
Highly stretchable composites from PDMS and polyazomethine fine particles†
C. Racles*,
V. E. Musteata,
A. Bele,
M. Dascalu,
C. Tugui and
A. L. Matricala
“Petru Poni” Institute of Macromolecular Chemistry, Aleea Grigore Ghica Voda 41A, Iasi, 700487, Romania. E-mail: raclesc@icmpp.ro
First published on 13th November 2015
Abstract
Polyazomethine (PAZ) submicron (fine) particles were obtained by polycondensation reactions occurring in reverse micelles of an amphiphilic siloxane oligomer. These particles were used as a dispersed phase of 10–40 wt% in a high molecular mass PDMS to obtain all-polymer composites. The new materials were characterized by scanning electron microscopy (SEM), differential scanning calorimetry (DSC), dielectric relaxation spectroscopy (DRS), contact angle, breakdown and stress–strain measurements. Thin films with a uniform morphology all over the cross-section were obtained. The dielectric permittivity markedly increased (up to 300% at 1 Hz) compared to the pristine PDMS. The PAZ fine particles act as reinforcing fillers for the PDMS matrix. Low loading levels (10–20%) allow the material to be kept within the range of soft elastomers, with a maximum strain of 600–800% and a low Young’s modulus, while higher amounts of fillers limit the strain to around 350%. The dielectric and mechanical properties can be tuned depending on the composition and structure of the dispersed phase. Such materials may be interesting as dielectric elastomer transducers or as highly flexible PDLCs.
Introduction
All-polymer composites are materials with a polymer matrix and polymer particles as a dispersed phase, and may combine valuable properties of both components, being at the same time unitary at macroscopic and microscopic scale. When the polymer matrix and the polymer reinforcement have the same chemical structure, they are named “self-reinforced polymeric materials”.1 The dispersed phase is in most cases micro/nanofibrillar,2 or of a spherical shape previously obtained by polymerization techniques.3 Theoretical investigations of all-polymer composites, either self-reinforced or based on immiscible polymers, have been reported.4,5 A special case is that of all-polymer composites with high dielectric permittivity, achieved with conductive polymer particles in high concentration, near the percolation threshold.6,7Polymer-dispersed liquid crystals (PDLCs) are morphologically similar systems. However, the dispersed phase may be a low molecular weight compound, while their preparation generally involves mixing of the two major components in solution or melt (in situ production), rather than using preformed filler particles. Their morphology is very important since the enhanced control of liquid crystal domain size and their distribution can optimize the overall performance.8
Polysiloxanes, especially their best known representative, polydimethylsiloxane (PDMS), are considered organic–inorganic polymers, and have a unique set of properties, like hydrophobicity, permeability to diffusion of different substances including gases, water vapors and drugs, specific visco-elastic properties, biological inertness, and good elastic properties over a wide range of temperatures and frequencies.9 One particular aspect is that PDMS is incompatible with practically any other polymer. Its non-polar nature is reflected by its solubility parameter, which is significantly lower than for other polymers.10 A direct consequence of this is the phase separation, a widely known phenomenon observed in blends and copolymers containing polysiloxane blocks or segments.11–18 This aspect may be frustrating when new materials are prepared, since their properties may be negatively affected. One way to control the morphology and thus the properties of PDMS–organic polymer systems is to prepare composite materials with a polymer matrix and polymer particles as a dispersed phase.
Despite its valuable properties and applications in composite materials, PDMS was scarcely used in all-polymer composites, either as a dispersed phase or as the matrix. We previously reported composites with Udel polysulfone as the matrix and cross-linked PDMS submicron particles as the filler.19 The cross-linking of PDMS was conducted in the presence of a surfactant, in polar medium and the resulted particles were dispersed into a polysulfone solution. All-polymer composites with PDMS as a matrix and ex situ polyaniline (PANI) nano/microparticles as a dispersed phase have been explored, especially in the context of new electroactive elastomeric materials.20,21 PDLCs based on PDMS as the matrix were also reported.22 In that case, the observed morphology, with a mean droplet diameter of ca. 7–9 μm, was the consequence of spontaneous phase separation in a system of thermodynamically incompatible materials.
It was the aim of the present work to establish a procedure for the preparation of new all-polymer composites based on PDMS and polyazomethine fine particles (PAZNp) obtained by in situ polycondensation. For the preparation of the PAZNp, a procedure previously reported by our group for aqueous medium23 was adjusted for organic medium in order to allow direct mixing with the non-polar PDMS. For this purpose, an amphiphilic siloxane oligomer was designed, able to stabilize the polymer particles in toluene. Two polyazomethines, a siloxane-containing one (PAZ1) and a fully aromatic one (PAZ2) were synthesized in the presence of this oligomer and their dispersions in toluene were mixed with a high molecular mass PDMS, followed by cross-linking of the matrix. The morphology, as well as the thermal, dielectric and mechanical properties of the resulting composite thin films, has been investigated by SEM, DSC, DRS, breakdown and stress–strain tests. Theoretical calculations for actuation strain and harvested energy indicate that the new materials could be useful as electro-mechanical transducers. The composites with PAZ1 (which is a liquid-crystal) can be regarded as highly stretchable PDLCs.
Results and discussion
Preparation of polyazomethine nanoparticles and composites thereof
The chemical structure as well as the solubility parameters of the polymers and the stabilizer is shown in Table 1. A key element in the preparation of polymer particles is the choice of a surfactant. Due to the particularities of the polymer pairs used in this study, especially due to the non-polar nature of the PDMS matrix, we designed an amphiphilic siloxane oligomer which acts as a stabilizer and compatibilizer. Its structure is similar to our previously described water-soluble surfactants,24 having tris(hydroxymethyl)aminomethane (trometamol) chain ends as the hydrophilic part and a long PDMS segment (19 siloxane units) as the hydrophobic part. The reaction pathway is based on generally known siloxane–organic synthesis and on our previous reports24,25 and involves the synthesis of an H-terminated siloxane oligomer, its hydrosilylation with allyl-glycidyl-ether and the subsequent addition of tromethamol. The 1H NMR spectrum of the amphiphilic oligosiloxane is presented in Fig. 1S.† This compound has a relatively low value for the solubility parameter which reflects its dual structure (Table 1). Therefore, it is not soluble in water, being soluble in methanol and in less polar solvents, including toluene. Considering its structure, it will form reverse micelles in toluene, protecting the hydrophilic groups in the core and exposing the siloxane part to the solvent. As a consequence, the stabilized particles will have a shell which is chemically identical with the polymer matrix, thus increasing the compatibility.| Polymer | Structural unit | δ (cal cm−3)1/2 |
|---|---|---|
| PDMS |  |
7.4 |
| PAZ2 |  |
10.0 |
| PAZ1 |  |
9.2 |
| Surfactant |  |
8.2 |
Another important factor for the preparation of polymer–polymer composites is the solubility balance. The core polymers have to be insoluble in the dispersing medium (in our approach, toluene), while the reaction solvent for the PAZ has to be miscible with and more volatile and more polar than the dispersing solvent; thus methanol was a suitable choice.
We previously showed that the polycondensation reaction leading to the formation of a polyazomethine (PAZ1) can occur within nanoparticles, when a siloxane-based surfactant is used as stabilizer, in aqueous medium.23 The very good stabilization was proven not only by the long-term uniform size and shape of the obtained polymer nanoparticles, but also by the higher conversion observed in the stabilized particles compared to the classical solution polycondensation. This was a very interesting observation, in spite of the fact that the nanoparticles were kept in water, which would break the azomethine bonds in the absence of a suitable stabilizer.23
Here we adapted the procedure for organic phase synthesis, using a non-aqueous surfactant, and applied it for two polyazomethines: PAZ1, which is a siloxane-containing one and PAZ2 – a fully aromatic, conjugated polyazomethine. The dialdehyde (either bis(formyl-p-phenoxymethyl)disiloxane (SDA) or terephthalaldehyde) and the diamine (p-phenylene-diamine) in stoichiometric amounts were dissolved separately in methanol, then the solutions were combined and the mixture was immediately injected into a diluted solution of the surfactant in toluene. The methanol and part of the toluene were slowly evaporated.
The formation of polyazomethines has been verified by FT-IR (Fig. 1). The aldehyde band at 1690 cm−1 is diminished, and a new band appears at 1626 cm−1 in PAZ1 and at 1670 cm−1 in PAZ2. This difference between the two polymers is due to a different level of conjugation involving the azomethine bond. On the other hand, the presence of a still important un-reacted aldehyde band indicates chain ends of low molecular weight oligomers, which is due particularly to the rapid precipitation from methanol. This aspect has been verified on model reactions without surfactant or toluene. In our previous report23 the aldehyde band was almost completely absent and we suppose that the difference between PAZ1 obtained in direct and reverse micelles is in connection with the presence of and the affinity for water. In direct micelles, the water was expulsed from the hydrophobic core where the polymer formed. In reverse micelles, the core is hydrophilic, due to the surfactant’s OH groups and to the hydrophilicity of methanol. Thus the equilibrium cannot be shifted towards formation of high molecular weight polymer when the reaction occurs in reverse micelles.
 | ||
| Fig. 1 FT-IR spectra (1300–1800 cm−1 region) of polyazomethines obtained in toluene/methanol with a siloxane stabilizer (the arrows indicate the newly formed azomethine bonds). | ||
PAZ1 obtained in the presence of the siloxane stabilizer was analyzed by H NMR (Fig. 2S†). The almost complete disappearance of the CHO signal in SDA at 9.9 ppm and the presence of the signal at 8.5 ppm assigned to the protons in the newly formed CH![[double bond, length as m-dash]](https://www.rsc.org/images/entities/char_e001.gif) N groups confirmed the reaction.
N groups confirmed the reaction.
The polyazomethine fine particles were observed by TEM. The PAZ1Np are spherical, with diameters of 50–100 nm (Fig. 2a), similar to those obtained previously in water.23 The PAZ2Np have dimensions of around 200 nm and a slightly irregular shape (Fig. 2b and c). The TEM images also suggested the crystalline nature of PAZ2 (Fig. 2c).
 | ||
| Fig. 2 TEM images of polyazomethine fine particles obtained in toluene: PAZ1Np (a) and PAZ2Np (b and c). | ||
For film formation, the dispersion of nanoparticles in toluene was mixed in different proportions with a toluene solution of a high molecular weight PDMS (Mn 438![[thin space (1/6-em)]](https://www.rsc.org/images/entities/char_2009.gif) 000), containing a cross-linking agent (TEOS) and catalyst (DBTDL). The solvent was slowly evaporated in ambient conditions with concomitant cross-linking. After a few days, necessary for maturation, the thin films (50–100 μm) were peeled off the Teflon substrate. The films are translucent, with homogeneous aspect and no visible agglomerations or non-embedded material on the surface (Fig. 3S†).
000), containing a cross-linking agent (TEOS) and catalyst (DBTDL). The solvent was slowly evaporated in ambient conditions with concomitant cross-linking. After a few days, necessary for maturation, the thin films (50–100 μm) were peeled off the Teflon substrate. The films are translucent, with homogeneous aspect and no visible agglomerations or non-embedded material on the surface (Fig. 3S†).
Characterization of PDMS–polyazomethine composites
Two series of composites were prepared with 10, 20 or 40 wt% PAZ1Np (materials PC1_10, PC1_20 and PC1_40) and with 10 or 20% PAZ2Np (PC2_10 and PC2_20). The morphology of the films was investigated in cryo-fracture and at the surface. Due to the very good embedment of the particles within the PDMS matrix, and taking into account the siloxane nature of the surfactant which covers them, the contrast of the images was poor, while contrast agents (in aqueous solution) allowed only a little improvement due to the hydrophobic nature of the materials. In Fig. 3 electron microscopy and AFM observations are presented. First, the overall aspect of the film section has to be evaluated, compared with a PDMS reference (Fig. 3a). While neat PDMS has a very smooth and even aspect, the composite cross-sections look completely different. One can observe the uniform aspect all over the material’s thickness, with no differences between the middle and the surface region (no layering). In the details presented in Fig. 3b, the fine particles within the matrix are visible both in SEM and AFM images. In Fig. 3c, the TEM image of a very thin film obtained in STEM mode, confirmed the size of PAZ1Np. SEM images on the surface (Fig. 3c) reveal the particles embedded in PDMS, for the two kinds of composites. | ||
| Fig. 3 Morphology of the polymer composites: (a) SEM images of cross-sections, compared to a reference PDMS; (b) details for sample PC1_20, in cross-section, SEM and AFM images; (c) surface images (TEM and SEM). | ||
The EDX analysis of the composites PC1_20 and PC2_10 (Fig. 4S†) indicated around 1% (wt) N, which is in good agreement with the calculated composition. This proves that the PAZ particles are embedded in the PDMS and not at the surface (in such a case, the N wt% would have been 5.9 for PAZ1 and 13.6 for PAZ2).
The contact angle measurements give an idea about the macroscopic surface properties. When measured on both sides of the films, very similar contact angle values were obtained, meaning that there are no noticeable differences in surface composition or roughness (Table 2). As expected, the composites are hydrophobic materials, preserving the properties of the silicone matrix. However, the contact angle values decrease, while the difference between faces increases for composites with a high content of PAZ.
| Sample | θ (°) surface (a) | θ (°) surface (b) |
|---|---|---|
| PC1_10 | 112.1 ± 0.7 | 113.5 ± 0.6 |
| PC1_20 | 110.1 ± 1 | 111.9 ± 0.7 |
| PC1_40 | 94.5 ± 1.7 | 98.5 ± 1.5 |
| PC2_10 | 111.8 ± 0.8 | 113 ± 1.1 |
| PC2_20 | 92 ± 1.6 | 97.5 ± 1.2 |
The thermal behavior of PC1_20 is compared in Fig. 4 with the PAZ1 obtained in solution (methanol) and PAZ1Np obtained in reverse micelles. PAZ1 is a thermotropic liquid crystal, showing a glass transition around 60 °C and two endothermal peaks: melting (Tm = 111 °C) and isotropization (Ti = 144 °C). This behavior was preserved in the nanoparticles and also when the PAZ1Np were dispersed in the PDMS film, with slightly modified values of the main transitions. This is a normal result, taking into account the relatively large size of the polyazomethine particles. For example, similar Tg values for bulk and for over 50 nm nanoparticles were reported in the case of polystyrene, contrary to very small nanoparticles.3 On the other hand, the melting and isotropization temperatures are lower than those found in our previous report,27 most probably due to the different reaction conditions. Here we used methanol at room temperature, which leads to low molecular weight oligomers, as indicated by FT-IR. In addition to the main transitions, another very faint endotherm can be seen below Tm in “PAZ1 sol” and PC1_20, which could be attributed to solid–solid transition.
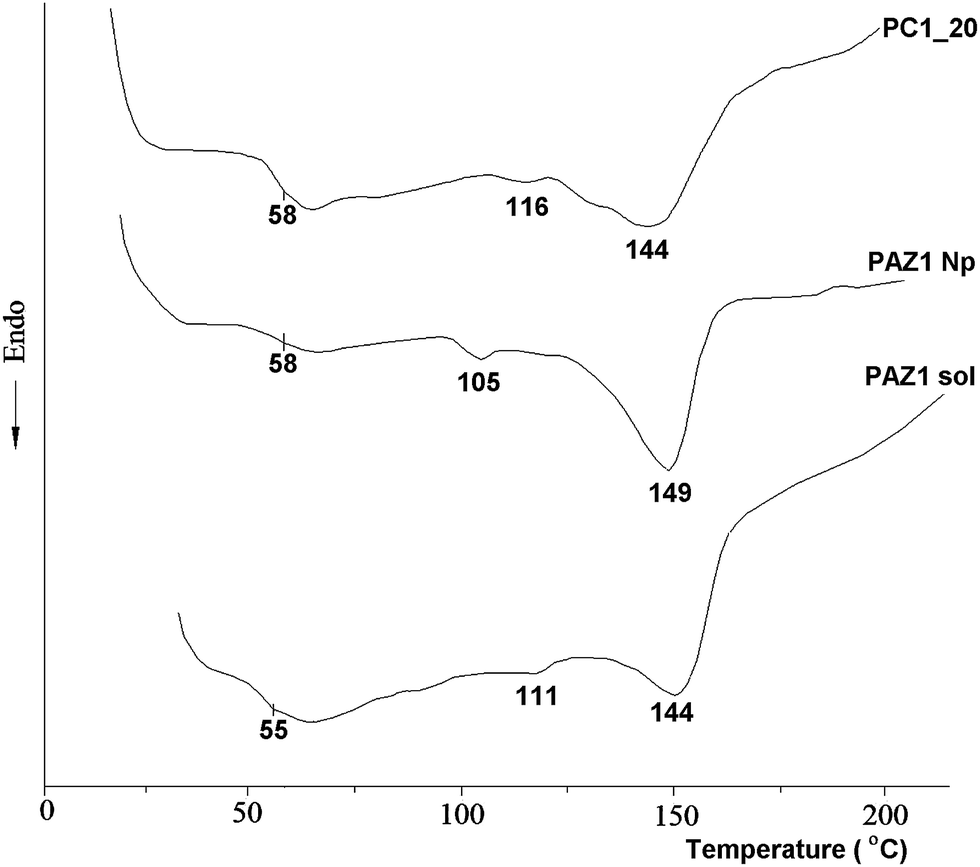 | ||
| Fig. 4 DSC curves (first heating) of PC1_20 film compared with the starting nanoparticles (sample PAZ1Np) and the PAZ1 obtained in methanol (sample PAZ1 sol). | ||
Melt birefringence was observed by polarized optical microscopy in PAZ1 obtained from solution, as well as in PAZ1Np, and it was preserved in the composite as shown in Fig. 5S.†
For PAZ2, no thermal transition could be detected under 300 °C, due to its fully aromatic, conjugated structure. In the negative temperature range the transitions of PDMS were observed (Fig. 6S†). The glass transition of PDMS in PC2_10 was slightly lower compared to the pristine PDMS (i.e. −125 °C vs. −122 °C), suggesting weak interactions between the filler and the polymer.28 In the heating scans, the melting process was detected at −42 °C for PDMS as well as for the composites. In the cooling scan, the crystallization process was observed as a single exothermal peak in PC1_20 and PC2_10, while for the PDMS reference a polymorphic transition (double peak) was registered at a lower temperature. The crystallization temperature increases in the composites by 5–10 °C, and the difference is more pronounced for PC2_10, suggesting a higher degree of order. It seems that the presence of more ordered fillers compatibilized by their polysiloxane shell is responsible for suppressing the less organized domains in the PDMS matrix. The effect of PAZ2, which is a rigid conjugated aromatic polymer, is more pronounced than the influence of PAZ1, which contains a flexible siloxane bond.
The dielectric properties were investigated in the frequency range from 1 to 106 Hz. In Fig. 5, the dielectric permittivity, losses and conductivity are presented, for the polymer–polymer composites, compared with the corresponding PDMS reference film. Table 3 summarizes the data at 10 kHz, as well as the dielectric permittivity (ε′) at 1 Hz and the electrical breakdown field. The dielectric permittivity increased, as expected, due to the embedment of more polar polymers within the PDMS matrix. At 10 kHz, an ε′ value of 3.75 was obtained for PC1_40, compared to 2.79 for PDMS. Interestingly, the permittivity value at 10 kHz for the composites having the same content of particles was similar, although PAZ2 is more polar. At low frequencies (1 Hz), the maximum ε′ value was 11, for PC2_20, which represents an almost 300% increase compared to PDMS, for only 20% PAZ2 particles. At intermediate frequencies, ε′ increases in the order PC1_10 < PC2_10 < PC1_20 < PC1_40 < PC2_20, which reflects the filler polarity correlated with its fraction in the composite.
 | ||
| Fig. 5 Dielectric permittivity (ε′), dielectric loss (ε′′) and conductivity at room temperature for the two series of composites and the PDMS matrix. | ||
| Sample | ε′ (1 Hz) | ε′ (10 kHz) | ε′′ (10 kHz) | σ (10 kHz) [S cm−1] | EEB [V μm−1] |
|---|---|---|---|---|---|
| PDMS | 2.83 | 2.79 | 1.12 × 10⁻³ | 6.24 × 10⁻¹² | 107 |
| PC1_10 | 3.47 | 3.03 | 9.17 × 10⁻³ | 5.10 × 10⁻¹¹ | 74 |
| PC1_20 | 4.93 | 3.43 | 6.03 × 10⁻² | 3.35 × 10⁻¹⁰ | 70 |
| PC1_40 | 6.3 | 3.75 | 1.4 × 10⁻¹ | 8.95 × 10⁻¹⁰ | 53 |
| PC2_10 | 5.26 | 3.03 | 5.45 × 10⁻² | 3.03 × 10⁻¹⁰ | 51 |
| PC2_20 | 11 | 3.53 | 1.2 × 10⁻¹ | 7.2 × 10⁻¹⁰ | 56 |
Even slightly increased, the conductivity values and their frequency dependence (almost linear increase in a double logarithmic scale and the absence of a plateau at low frequency) are still characteristic for insulators.29
At low frequencies, the ε′ values for PC2_20 are the highest, as well as the loss and the conductivity, this sample being followed by PC2_10 and PC1_40. This effect is assigned to Maxwell–Wagner–Sillars (MWS) polarization processes, i.e. to the separation of charges at interfaces with different dielectric characteristics.29 There are several aspects that lead to interfacial polarization. PAZ2 is a conjugated, semiconducting polymer, thus in PC2 composites the interfacial polarization is a result of the high mobility of charges, which cannot cross the phase boundary to the PDMS matrix. The lower breakdown field measured for PC2 materials (Table 3) correlates and confirms that the increased losses for this sample at low frequency is mainly of a conductive nature. In PC1 composites, although PAZ1 is not a conjugated polymer, it has different electric properties compared to PDMS, being more polar. For PC1_40 and PC1_20, ε′ values are also increased at low frequencies, while the increase of ε′′ and conductivity is not as pronounced as in the case of PC2 samples. Another factor that promotes interfacial polarization processes in all the samples is the large contact area provided by the small dispersed particles.
The breakdown field (measured in static conditions) decreases, as expected, compared to the PDMS matrix. However, the values obtained for the composites (especially for PC1_10 and PC1_20) are rather high, compared with similar materials obtained with polar fillers or grafted dipoles.30,31 For PC1 composites the electric breakdown field decreases with increasing the amount of PAZ1 particles, while the introduction of semiconducting PAZ2 particles implies a more dramatic decrease in EEB compared to the neat PDMS irrespective of the composition.
Dielectric relaxation spectrometry (DRS) with varying temperature and frequency was further used to better discern between different contributions in dielectric parameters. The temperature was modified in the positive range to observe the phenomena assigned to the dispersed phase and in the negative range for changes assigned mainly to the PDMS matrix. The results obtained on sample PC1_20 are presented in Fig. 6 and 7.
 | ||
| Fig. 6 DRS spectra of PC1_20 as a function of temperature in the positive range: (a) dielectric permittivity and dielectric loss vs. temperature at 1 Hz; (b) temperature dependence of dielectric permittivity at several frequencies; (c) temperature dependence of dielectric loss at several frequencies. | ||
 | ||
| Fig. 7 DRS spectra (dielectric permittivity and dielectric loss) of PC1_20 as a function of temperature in the negative range, at various frequencies. | ||
In Fig. 6a the variations of ε′ and ε′′ with temperature at 1 Hz are represented. The loss curve presents a peak at around 60 °C, which is well correlated with the Tg from DSC. This peak is shifted towards higher values when the frequency increases, which is the normal trend for a dielectric relaxation process as dynamic glass transition (Fig. 6c). On the ε′ curve (Fig. 6a), the process appears as an increase, immediately followed by the solid–solid transition, the melting process, and subsequently by isotropization, which appear as a stepwise decrease of ε′ at temperatures slightly modified compared to the rather large peaks observed in DSC. At intermediate frequencies, the relaxation associated with the glass transition, melting and isotropization of PAZ1 are overlapped, the ε′ curve showing a large complex peak shifted towards higher temperature with increasing frequency (Fig. 6b). This complex behavior might be explained by the modification of the interfacial polarization and/or of the particles and sample geometry during the thermal transitions.
At temperatures lower than 60 °C, preceding the dynamic glass transition of PAZ1 particles, there is a shoulder on ε′′ shifting to higher temperature with increasing frequency (Fig. 7c). In the same frequency and temperature range ε′ presents increased values at low frequency. This behavior may correlate with interfacial polarization between the PAZ1Np and PDMS phases. Its assignment is supported by two observations: the effect is observed only for the lower frequencies (1 to 102 Hz) and its intensity decreases with increasing frequency.
In Fig. 7, the transitions assigned to the PDMS matrix can be followed. The steep increase of ε′ and a peak in ε′′ correspond to the segmental α relaxation associated with the glass transition of PDMS (around −120 °C) and is in good correlation with the DSC results. At a higher temperature, ε′ displays a decrease assigned to the melting of the crystalline domains in PDMS, as indicated by DSC analysis. At low frequencies, ε′′ increases with temperature after the α relaxation, suggesting interfacial polarization phenomena, most probably due to the increased mobility of the polar particles induced by the softening of the matrix.
The mechanical behavior was also investigated in comparison with a reference PDMS film, obtained in the same cross-linking conditions. In Fig. 8, the stress–strain curves are shown. As can be observed, the mechanical properties were seriously influenced by the amount and nature of the polyazomethine fine particles introduced. First of all, it has to be mentioned that the neat PDMS film had a very large strain at break (2200%) and very low Young’s modulus (Table 4). The introduction of harder materials led, as expected, to increased tension and lower elongation. Significantly increased resistance was obtained for PC2_10 and PC2_20 (4.5 and as much as 59-fold increase respectively versus PDMS). On the other hand, as can be observed in Fig. 8, only 10% of the rigid conjugated polyazomethine PAZ2 had a more pronounced reinforcement effect than 40% of the softer, non-conjugated siloxane polyazomethine, PAZ1. However, it is worth mentioning that the maximum elongations obtained for the composites with relatively low amount of filler were around 700–800%, which are still very large values, while Young’s modulus remained in the range of soft elastomers for the PC1 series and for PC2_10. The mechanical properties worsen when PAZ2 is introduced in a large amount (PC2_20): the elastic region narrowed, and the Young’s modulus and the tensile strength increased significantly, while the maximum strain decreased. For the PC1 series, the maximum elongation diminished to half when the amount of PAZ1Np doubled, from 20 to 40%, but the other elastic parameters remained moderate.
 | ||
| Fig. 8 The mechanical behaviour of the polymer composites. | ||
| Sample | Elastic region, % | Young’s modulus at 0%, MPa | Young’s modulus at 10%, MPa | Tensile toughnessa, J cm−3 | Tensile strength, MPa | Elongation at break, % |
|---|---|---|---|---|---|---|
| a Elastic energy density (deformation energy) calculated from the stress–strain curves. | ||||||
| PDMS | 26 | 0.093 | 0.089 | 2.50 | 0.206 | 2200 |
| PC1_20 | 22 | 0.205 | 0.189 | 1.24 | 0.279 | 677 |
| PC1_40 | 16 | 0.564 | 0.555 | 1.36 | 0.520 | 346 |
| PC2_10 | 20 | 0.705 | 0.753 | 4.85 | 0.939 | 812 |
| PC2_20 | 13 | 5.32 | 5.246 | 4.45 | 1.520 | 352 |
Compared to PDMS, the elastic region decreased with the amount of particles incorporated into the composites. The tensile toughness (elastic energy density) was calculated from the stress–strain curves. The obtained values (Table 4) were about half of the value for the PDMS reference in the case of the PC1 composites and significantly increased in the case of the PC2 composite series. The different behaviour of the two series is due to the different nature of the PAZ within the particles, i.e. soft versus rigid.
It can be concluded that the mechanical properties are seriously influenced and can be tuned by the nature and amount of PAZ fine particles used as fillers.
Possible applications
Due to their improved dielectric permittivity and good breakdown strength and mechanical properties, these all-polymer composites may be suitable for electro-mechanical transducers, i.e. for the inter-conversion of electric and mechanical energies. For a quick evaluation, theoretical calculations can be done, based on the electric and mechanical measurements.The actuation strain in the thickness direction can be calculated according to eqn (1),32 where E is the electric field, ε0 = 8.854 × 10⁻¹² F m−1 is the vacuum permittivity, and ε′ and Y are the permittivity and modulus of the sample:
 | (1) |
Assuming incompressibility, it is also possible to estimate the lateral actuation strain (sx) according to eqn (2):
| sx = (1 + sz)−0.5 − 1 | (2) |
The evaluation of the energy conversion can be done by calculating the specific energy per unit volume as a function of dielectric permittivity, breakdown field and maximum strain at break (smax), using eqn (3) and assuming a series of approximations (see Ref. 33 for example).
 | (3) |
Assuming Emax is the dielectric strength (EEB), the maximum energy difference calculated represents the theoretical maximum value that can be achieved. However, in practice lower voltages have to be applied, to avoid material failure. Maximum strain at break is also a limit that involves material rupture. Therefore calculations for an arbitrary electrical field of 30 V μm−1 and for 100% strain could help the comparison between different samples.
In Table 5 the theoretical actuation strain and energy difference per volume unit gained during one working cycle for composite samples PC1_20 and PC2_10, our PDMS matrix and a commercial silicone matrix are presented. The calculated actuation is significantly increased for the composites compared to the commercial silicone, which is much stiffer than our PDMS reference. A promising theoretical actuation value was obtained for the composite containing the siloxane-based polyazomethine (PC1_20), while the calculated values decrease for stiffer materials. The energy generated at a moderate electric field is significantly higher (roughly 2–4 times) for the composites compared to both PDMS references.
| Sample | sx, % | Energy differencea [mJ cm−3] | Energy differenceb [mJ cm−3] |
|---|---|---|---|
| a Calculated with smax.b Calculated with s = 100%.c According to ref. 34, ε′ (at 100 Hz) = 3.3; Y (at 5% strain) = 3.8 MPa; smax = 210%. | |||
| PC1_20 | 12.36 | 19.3 | 14.7 |
| PC1_40 | 4.85 | 23.8 | 18.8 |
| PC2_10 | 2.91 | 20.7 | 15.7 |
| PC2_20 | 0.8 | 41.7 | 32.9 |
| PDMS | 15.52 | 11.1 | 8.4 |
| DMS-V31c | 0.35 | 11.8 | 9.9 |
Thus, the obtained new materials could be useful as electro-mechanical transducers, where optimized dielectric and mechanical properties are required. As their properties strongly depend on the composition and on the structure of the dispersed phase, there is still room for improvements in this respect.
On the other hand, given the LC behavior of PAZ1, the composites “PC1” are in fact polymer-dispersed liquid crystals (PDLCs). Thus the method may in principle be regarded as a path to highly stretchable PDLCs and the issue deserves further attention.
Experimental
Materials and methods
Terephthalaldehyde (TA), p-phenylene diamine (PDA), tris(hydroxymethyl)aminomethane (THAM), 1,1,3,3-tetramethyldisiloxane, octamethylcyclotetrasiloxane (D4), allyl-glycidyl ether, dibutyltin dilaurate (DBTDL), tetraethyl orthosilicate (TEOS) and platinum divinyltetramethyldisiloxane complex (Pt(dvs)) solution in xylene (Karstedt’s catalyst) were commercially available reagents (Sigma-Aldrich) and were used without further purification, as were the solvents (methanol, toluene and isopropyl alcohol).Bis(formyl-p-phenoxymethyl)disiloxane (SDA) was synthesized from 1,3-bis-chloromethyldisiloxane and p-hydroxybenzaldehyde, in a 1/2 molar ratio, with dry K2CO3 in DMF, according to the method described in ref. 27.
1H-NMR (CDCl3 δ, ppm, Fig. 2S†): 9.91 (s, 2H, CHO), 7.87, 7.85 (d, 4H, J = 9 Hz, ortho to –CH), 7.06, 7.04 (d, 4H, J = 9 Hz, ortho to –O–), 3.67 (m, 4H, CH2), 0.30 to 0.12 (m, 12H, CH3).
The FT-IR spectrum is presented in Fig. 7S.†
Polydimethylsiloxane-α,ω-diol (PDMS) was prepared by cationic ring-opening polymerization of octamethylcyclotetrasiloxane (D4) catalysed by sulphuric acid, according to an already reported procedure.35 Mn = 438 000 g mol−1, determined by gel permeation chromatography (GPC), PDI = 1.46.
The infrared spectra were registered on a Bruker Vertex 70 FT-IR instrument, in transmission mode, in the 300–4000 cm−1 range (resolution 2 cm−1, 32 scans), at ambient temperature. 1H-NMR spectrum was registered on 400 MHz Brüker spectrometer in CDCl3 without an internal standard.
For SEM studies, the films were fractured under liquid nitrogen and the cross-section surface was examined with an Environmental Scanning Electron Microscope (ESEM) type Quanta 200, operating at 30 kV with secondary electrons. Different conditions were used for surface analysis (LFD – large field detector or GAD – gaseous analytical detector) and a contrast agent (phospho-tungstic acid). TEM observations were made with Hitachi High-Tech HT7700 Transmission Electron Microscope, operated at 100 kV accelerating voltage. Samples of PAZNp were cast from diluted dispersions on 300 mesh carbon coated copper grids and vacuum dried, then analyzed in high contrast mode. For investigation of the composite a small piece of the thin film was placed between two uncovered grids and observed in STEM mode. AFM measurement was done on a SPM Solver Pro-M platform (NT-MDT, Russia), in air, in semi-contact mode, using a rectangular NSG10/Au cantilever with a nominal elasticity constant KN = 11.5 N m−1. Static contact angle measurements were made on a CAM 101 Optical Video Contact Angle System, KSV Instruments LTD, Finland. The mean values for at least 5 measurements are reported. The differential scanning calorimetry (DSC) analyses were done on a Mettler TA DSC 12E Instrument, with heating and cooling rates of 10 °C min−1. The processes assigned to glass transition were verified in the second heating scan. Polarized light optical microscopy (POM) observations were made with an Olympus BH-2 microscope (Japan), fitted with a THMS 600/HSF9I hot stage.
The complex dielectric permittivity was measured using a Novocontrol Dielectric Spectrometer Concept 40 Alpha Analyzer equipped with a Quatro temperature controller. Measurements were carried out by sweeping frequency between 1 and 106 Hz at room temperature. For the temperature dependence experiment, measurements were performed isochronously (for fixed frequencies taken at each order of magnitude) during the increase of temperature of 5 °C per min, in a temperature range from −150 to 20 °C and from 20 to 190 °C. Breakdown strength measurements were performed by applying a ramp signal of 1000 V s−1 on unstressed elastomeric membranes of 10 mm diameter placed between two unequal planar circular electrodes arranged coaxially. The voltage could vary in the range 0–20 kV until the breakdown occurred. Five measurements were taken for each sample and the average value was taken into account.
Stress–strain measurements were performed on dumbbell-shaped samples cut from thin films on a TIRA test 2161 apparatus, Maschinenbau GmbH Ravenstein, Germany. Measurements were run at an extension rate of 50 mm min−1, at room temperature.
In the next step, the addition of tris(hydroxymethyl)aminomethane (THAM) to the glycidyl-terminated oligomer was done similarly to the method described in ref. 24. The telechelic glycidyloxypropyl polysiloxane, 0.794 g (0.46 mmol) and THAM (0.112 g, 0.92 mmol) were suspended in 4.5 mL methanol/isopropyl alcohol 2/1 (v/v). The reaction mixture was stirred at 75 °C for 14 h then the solvents were distilled. The product was extracted with chloroform and dried.
1H NMR (δ ppm, CDCl3): 4.20–3.25 [m, 2H ![[double bond splayed left]](https://www.rsc.org/images/entities/char_e009.gif) C
C![[H with combining low line]](https://www.rsc.org/images/entities/char_0048_0332.gif) (OH)–, 12H –C2–OH, 4H –O–C2–C–C–Si], 3.23–2.53 [m, 4H, –O–C2–C(OH), 4H –C2–NH–], 1.60 (m, 4H –O–C–C2–C–Si), 0.51 (m, 4H C–C2–Si), 0.07 (m, 120H Si–CH3), see Fig. 1S.†
(OH)–, 12H –C2–OH, 4H –O–C2–C–C–Si], 3.23–2.53 [m, 4H, –O–C2–C(OH), 4H –C2–NH–], 1.60 (m, 4H –O–C–C2–C–Si), 0.51 (m, 4H C–C2–Si), 0.07 (m, 120H Si–CH3), see Fig. 1S.†
1H NMR (δ ppm, DMSO-D6, Fig. 2S†): 8.50 (m, 2H –CN–), 8.30–6.00 (m, 12H aromatic), 3.70 (m, 4H –CH2–), 0.08 (m, 12H –CH3).
For PAZ2Np, the procedure was similar. Solutions of terephthalaldehyde (0.0185 g, 0.14 mmol in 1 mL methanol) and p-phenylene diamine (0.0147 g, 0.14 mmol in 0.5 mL methanol) were combined and the mixture was rapidly injected into 3 mL of a 1% toluene solution of surfactant. After the methanol and part of the toluene evaporated, the turbid dispersion was sonicated prior to mixing with PDMS.
| Code | Feeding amounts | |||||
|---|---|---|---|---|---|---|
| SDA, g | TA, g | PDA, g | PDMS, g | TEOS, mL | DBDTL, g | |
| PC1_10 | 0.025 | — | 0.007 | 0.24 | 0.1 | 0.030 |
| PC1_20 | 0.05 | — | 0.014 | 0.24 | 0.1 | 0.030 |
| PC1_40 | 0.05 | — | 0.014 | 0.12 | 0.05 | 0.015 |
| PC2_10 | — | 0.0185 | 0.0147 | 0.24 | 0.1 | 0.030 |
| PC2_20 | — | 0.0185 | 0.0147 | 0.12 | 0.05 | 0.015 |
As an example, the preparation of PC1_20 is detailed. The PAZ1Np solution obtained in the previous step was added to 0.24 g PDMS dissolved in 2 mL toluene. To this mixture, 0.1 mL TEOS and two droplets (ca. 0.03 g) of DBTDL were added and thoroughly homogenized. The solution was cast on a Teflon substrate and a thin film was obtained. After complete evaporation of the solvent, cross-linking and ageing for 3 days in ambient conditions, the film was peeled off.
Conclusions
Polyazomethine fine particles were obtained by polycondensation reactions occurring in reverse micelles of an amphiphilic siloxane oligomer. All-polymer composites were prepared based on high molecular weight PDMS as the matrix and the polyazomethine nanoparticles as the dispersed phase. The new materials are hydrophobic, with a uniform morphology throughout the cross-section. Their dielectric and mechanical properties can be tuned depending on their composition and on the properties of the dispersed polymers. The dielectric permittivity is increased, and the materials withstand relatively high voltages, while the elastic properties are very good. These characteristics make such materials promising as dielectric elastomer transducers. The method can in principle be applied to other systems, where the dispersed phase is obtained in situ from the monomers and stabilized in non-polar organic medium containing the polymer matrix. When the dispersed polymer has LC behaviour, like in the case of PAZ1, such composites can be regarded as highly flexible PDLCs.Acknowledgements
This work was supported by the Romanian Academy and the Romanian – Swiss Research Programme, project number 10RO-CH/RSRP/01.01.2013. The authors thank Dr Stelian Vlad for mechanical tests and Dr Liviu Sacarescu for TEM investigations.Notes and references
- Á. Kmetty, T. Bárány and J. Karger-Kocsis, Prog. Polym. Sci., 2010, 35, 1288–1310 CrossRef.
- Synthetic Polymer-Polymer Composite, ed. D. Bhattacharyya and S. Fakirov, Carl Hanser Verlag, Munich, 2012 Search PubMed.
- Y. Rharbii, N. Bassoui and F. Boue, Soft Matter Scientific Report 2005–2006, pp. 90–91, http://www-llb.cea.fr/fr-en/activ05-06/Soft_Matter.pdf, accessed 11 January 2012 Search PubMed.
- A. R. de Luzuriaga, A. Etxeberria, J. Rodriguez and J. A. Pomposo, Polym. Adv. Technol., 2008, 19, 756–761 CrossRef.
- S. Montes, A. Etxeberria, J. Rodriguez and J. A. Pomposo, Res. Lett. Phys. Chem., 2008, 504917, DOI:10.1155/2008/504917.
- C. Huang and Q. Zhang, Adv. Funct. Mater., 2004, 14, 501–506 CrossRef CAS.
- C. Huang, Q. M. Zhang and J. Su, Appl. Phys. Lett., 2003, 82, 3502–3504 CrossRef CAS.
- M. D. Sarkar, N. L. Gill, J. B. Whitehead and G. P. Crawford, Macromolecules, 2003, 36, 630–638 CrossRef.
- A. C. M. Kuo, in Polymer Data Handbook, Oxford University Press, 1999, pp. 411–435 Search PubMed.
- I. Yilgor and J. E. McGrath, Adv. Polym. Sci., 1988, 86, 1–86 CrossRef CAS.
- J. E. McGrath, D. L. Dunson, S. J. Mecham and J. L. Hedrick, Adv. Polym. Sci., 1999, 140, 61–105 CrossRef CAS.
- N. Furukawa, Y. Yamada, M. Furukawa, M. Yuasa and T. Kimura, J. Polym. Sci., Part A: Polym. Chem., 1997, 35, 2239–2251 CrossRef CAS.
- X. Chen, J. A. Gardella Jr, T. Ho and K. J. Wynne, Macromolecules, 1995, 28, 1635–1642 CrossRef CAS.
- A. Stanciu, A. Airinei, D. Timpu, A. Ioanid, C. Ioan and V. Bulacovschi, Eur. Polym. J., 1999, 35, 1959–1965 CrossRef CAS.
- L. V. Dubrovina, S.-S. A. Pavlova, T. P. Bragina, L. I. Makarova, L. V. Filimonova and A. A. Zhdanov, Polym. Sci., Ser. A, 1997, 39, 202–206 Search PubMed.
- K. B. Wagener, F. Zuluaga and S. Wanigatunga, Trends Polym. Sci., 1996, 4, 157–163 CAS.
- S. Bronnikov, C. Racles, V. Cozan, A. Nasonov and S. Sokolov, J. Macromol. Sci., Part B: Phys., 2005, 44, 21–29 CrossRef.
- C. Racles, A. Ioanid, A. Tóth, M. Cazacu and V. Cozan, Polymer, 2004, 45, 4275–4283 CrossRef CAS.
- C. Racles, M. Cristea, F. Doroftei and M. Alexandru, Soft Mater., 2013, 11, 421–429 CrossRef CAS.
- P. Hiamtup, A. Sirivat and A. M. Jamieson, Mater. Sci. Eng., C, 2008, 28, 1044–1051 CrossRef CAS.
- M. Molberg, D. Crespy, P. Rupper, F. Nüesch, J. A. E. Månson, C. Löwe and D. M. Opris, Adv. Funct. Mater., 2010, 20, 3280–3291 CrossRef CAS.
- S. Bronnikov, C. Racles and V. Cozan, Liq. Cryst., 2009, 36, 319–328 CrossRef CAS.
- C. Racles, M. Cazacu, G. Hitruc and T. Hamaide, Colloid Polym. Sci., 2009, 287, 461–470 CAS.
- C. Racles, Soft Mater., 2010, 8, 263–273 CrossRef CAS.
- C. Racles and T. Hamaide, Macromol. Chem. Phys., 2005, 206, 1757–1768 CrossRef CAS.
- J. Bicerano, J. Macromol. Sci., Rev. Macromol. Chem. Phys., 1996, 35, 161–196 CrossRef.
- C. Racles, V. Cozan and I. Sajo, High Perform. Polym., 2007, 19, 541–552 CrossRef CAS.
- B. Ash, L. Schadler and R. Siegel, Mater. Lett., 2002, 55, 83–87 CrossRef CAS.
- F. Kremer, A. Schönhals and W. Luck, Broadband dielectric spectroscopy, Springer-Verlag, Berlin, Germany, 2002 Search PubMed.
- S. Risse, B. Kussmaul, H. Krüger and G. Kofod, Adv. Funct. Mater., 2012, 3958–3962 CrossRef CAS.
- B. Kussmaul, S. Risse, G. Kofod, R. Waché, M. Wegener, D. N. McCarthy, H. Krüger and R. Gerhard, Adv. Funct. Mater., 2011, 21, 4589–4594 CrossRef CAS.
- R. E. Pelrine, R. D. Kornbluh and J. P. Joseph, Sens. Actuators, A, 1998, 64, 77–85 CrossRef CAS.
- S. J. A. Koh, X. Zhao and Z. Suo, Appl. Phys. Lett., 2009, 94, 262902 CrossRef.
- F. B. Madsen, L. Yu, A. E. Daugaard, S. Hvilsted and A. L. Skov, RSC Adv., 2015, 5, 10254 RSC.
- M. Cazacu, M. Antohi, C. Racles, A. Vlad and N. Forna, J. Compos. Mater., 2009, 43, 2045–2055 CrossRef CAS.
- M. Cazacu, M. Marcu, D. Caraiman and A. Vlad, Rev. Roum. Chim., 1998, 43, 757–763 CAS.
Footnote |
| † Electronic supplementary information (ESI) available: H NMR spectrum of the stabilizer, photos of the composite films, polarized light images and DSC curves in the negative range. See DOI: 10.1039/c5ra12297j |
| This journal is © The Royal Society of Chemistry 2015 |