DOI:
10.1039/C5RA12266J
(Paper)
RSC Adv., 2015,
5, 61170-61178
Adsorption behaviour of gluten hydrolysate on mild steel in 1 M HCl and its role as a green corrosion inhibitor†
Received
25th June 2015
, Accepted 3rd July 2015
First published on 3rd July 2015
Abstract
The search for commercially available and low cost green corrosion inhibitors in combating metal corrosion has incited the investigation of the adsorption behavior and inhibition potentiality of gluten hydrolysate towards mild steel in 1 M HCl employing both electrochemical and weight loss techniques. Acting as a mixed-type inhibitor, gluten hydrolysate forms an inhibitive layer on the metal enhancing the polarization resistance. The thermodynamic and activation parameters for adsorption are explained following competitive physical and chemical adsorption models depending on concentration as well as temperature. FTIR data indicates the involvement of amide groups, as well as the side chains of amino acid residues during adsorption, while confirmatory evidence of enhanced corrosion resistance is obtained from SEM images.
Introduction
Combating the corrosion of metals in different aggressive environments using inorganic and organic based inhibitors has a long history.1–8 In many commercial inhibitor formulations, inorganic and organic inhibitors are used together, in addition to other additives, like a stabilizer etc.2,8 But, in recent years, the use of such heavy metal ion based inhibitors is becoming restricted due to their environmental hazardous characteristics.9 Organic inhibitors may also be toxic; or their synthetic process may be responsible for environmental degradation to various extent. In this regard, the use of biodegradable and inexpensive green corrosion inhibitors, derived from different plant sources may be the most viable alternative.10–12 Search for biocompatible corrosion inhibitors prompted researchers to investigate the efficacy of different amino acids,13 polysaccharides,14 vitamins,15 drug molecules,16 proteins,17 as well as numerous plant extracts.18
From our group, we have earlier demonstrated that polysaccharides in the presence of thiourea impart synergistic influence towards the corrosion inhibition of mild steel in acid.19 Chemical modification of polysaccharides also enhances their anti-corrosive potentiality.20 A water-insoluble protein, zein, in SDS micellar media has been established as a good corrosion inhibitor.21 In continuing this endeavor, in the present work, we have tested the adsorption characteristics of a bioactive and inexpensive hydrolysate of a water soluble protein, gluten, on mild steel in 1 M HCl as a function of temperature and subsequently its corrosion inhibition propensity.
Gluten, a plant protein, is found in various cereal grains, like wheat, maize, barley, oats, and others.22–28 It is insoluble in water, but can absorb water in an amount twice that of its dry weight. This unique property has made it suitable for wide use in various food industries, particularly bakery, for many centuries.22–25 It is reported to be safe for use as a plant protein source in aquaculture feeds,26 as well as in food for pets like cats.27 Different non-food applications of gluten are attributed to its thermoplasticity and good film forming ability.23–25 But, water insolubility has restricted its use for many potential applications. Recently, gluten has been hydrolyzed by the action of enzymes, and these water soluble hydrolysates have found versatile biological applications, including as anti-oxidants.23–25 Different peptide fractions of hydrolysate contain different amino acid sequences. The major amino acid residues present in a corn gluten protein fraction are glutamic acid, proline and leucine; with other amino acids being present in minor percentages.28 The pursuit to explore possible alternative uses for this important co-product of the plant processing industry has prompted us to undertake the current study.
Experimental
Metal coupon preparation and chemicals
Test specimens were cut from a commercially available mild steel rod (wt% composition: 0.24 C, 0.40 Si, 0.90 Mn, 0.07 Ni, 0.03 Cr, 0.01 P, 0.005 S and the remainder iron). The cross sectional surface was ground with different grade emery papers (400, 600, 800 and 1200), and washed thoroughly before using it as the working electrode in the electrochemical measurements. Gluten hydrolysate from maize (Sigma-Aldrich) was used as received. As the molecular weight of gluten hydrolysate (being a polypeptide of varied chain lengths) cannot be determined accurately due to its inherent molecular complexity, the concentration was expressed in terms of ppm by weight.
Electrochemical measurements
Potentiodynamic polarization and electrochemical impedance measurements were performed using a conventional three-electrode system (model: CHI 608D) consisting of a mild steel working electrode (WE) with an exposed area of 1 cm2, platinum as the counter electrode and a saturated calomel electrode (SCE) as the reference. Before the electrochemical tests, the WE was kept in the test solution (300 mL) for a sufficient time to attain a steady open circuit potential (OCP). The polarization experiments were performed with a potential sweep rate of 30 mV per min for the potential range of ±200 mV from the OCP. The corrosion current density (icorr) was determined from the intercept of the extrapolated cathodic and anodic Tafel lines at the corrosion potential (Ecorr). The values of inhibition efficiency, ηP (%) were calculated from the following equation: |
 | (1) |
where, icorr and icorr(inh) are the values of the corrosion current density of the uninhibited and inhibited specimens, respectively.
The electrochemical impedance (EIS) measurements were performed in the frequency range of 10 mHz to 100 kHz with an ac amplitude of ± 5 mV at the rest potential. The Nyquist plots obtained show only one time constant corresponding to one capacitive loop without any trace of an inductive loop in the low frequency range. The observed capacitive loops are depressed with centres under the real axis, which may be interpreted in terms of the microscopic roughness of the electrode surface and the inhibitor adsorbed on it.29,30 Accordingly, these were fitted using an equivalent circuit consisting of a parallel combination of the polarization resistance-constant phase element, which is in series with the solution resistance, Rs[Rp − CPE] (Fig. S1 in ESI†).29–33 The impedance of the CPE is given by
Q is an indicative parameter proportional to the capacitance of the double layer formed at the metal surface for 0 >
n > 1. For whole numbers of
n = 1, 0, −1 the CPE is reduced to the classical lumped elements capacitor (
C), resistance (
R), and inductance (
L), respectively. To correlate the polarization resistance (
Rp comprises the charge transfer resistance along the metal–electrolyte interface, the resistance due to the adsorbed inhibitor layer as well as the corrosion products) and the double layer capacitance (
Cdl) among the metal–solution interface, the latter was recalculated using the equation:
31,32
The percentage inhibition efficiencies ηZ (%) in terms of Rp were calculated through the following equation:
|
 | (4) |
Weight loss measurements
For weight loss measurement, the polished, dried and accurately weighed rectangular mild steel coupons (2.5 × 2.5 × 0.1 cm3) were immersed in 1 M HCl (75 mL) without and with various concentrations of the inhibitor for a duration of 6 h at different temperatures (293, 303, 313, 323 K). After removal, loosely bound corrosion products were removed using a bristled brush, then the coupons were washed thoroughly with distilled water and acetone, dried in a vacuum desiccator, and weighed. The corrosion rate (CR) was determined in terms of weight loss (in mg) per unit surface area (in cm2) per hour of immersion time. The percentage inhibition efficiency, ηW (%) was calculated following the relation: |
 | (5) |
where, CR0 and CR are the corrosion rate of the metal coupons in an acid medium without and with the inhibitor. ηW (%) is a measure of the degree of surface coverage (θ) as per the relation:15–21
Surface analysis
A scanning electron microscope (SEM, S-3000N, Hitachi) was used to study the surface morphology of the metal surface after immersion in 1 M HCl without and with the inhibitor for a duration of 6 h. The surface of the dried specimen was scratched with a knife and the resultant powder was then used for the FTIR studies (KBr pellet method, Thermo Nicolet, model iS10).
Results and discussion
Polarization measurements
From the potentiodynamic polarization plots and the corresponding electrochemical parameters, it is seen that icorr decreases gradually with an increase in the concentration of gluten hydrolysate at a fixed temperature (Fig. 1 and Table 1). For all concentrations, icorr increases with temperature (Fig. S2 in ESI†), which is in agreement with the Arrhenius theory for thermally induced reactions.
 |
| Fig. 1 Potentiodynamic polarization curves for mild steel in 1 M HCl in the presence of (a) no inhibitor, (b) 100 ppm, (c) 250 ppm, (d) 500 ppm and (e) 1000 ppm gluten hydrolysate at 313 K. | |
Table 1 Data from the polarization studies for mild steel in 1 M HCl in various concentrations of gluten hydrolysate at different temperatures
Temp. (K) |
Inhibitor conc. (ppm) |
−Ecorr (mV per SCE) |
icorr (μA cm−2) |
βa (mV dec−1) |
−βc (mV dec−1) |
ηP (%) |
293 |
Blank |
494 |
1260 |
74.0 |
100 |
— |
100 |
484 |
228 |
72.0 |
89.0 |
82.0 |
250 |
478 |
112 |
68.0 |
94.0 |
91.0 |
500 |
481 |
100 |
67.5 |
91.0 |
92.0 |
1000 |
474 |
89.7 |
74.5 |
91.0 |
92.8 |
303 |
Blank |
480 |
1760 |
76.0 |
91.0 |
— |
100 |
484 |
299 |
72.0 |
82.0 |
83.0 |
250 |
470 |
132 |
62.5 |
85.4 |
92.5 |
500 |
470 |
126 |
64.5 |
84.7 |
92.8 |
1000 |
486 |
112 |
68.5 |
80.0 |
93.6 |
313 |
Blank |
476 |
3160 |
91.0 |
102 |
— |
100 |
466 |
495 |
59.0 |
77.0 |
84.3 |
250 |
469 |
218 |
60.0 |
72.0 |
93.1 |
500 |
473 |
148 |
56.0 |
73.0 |
95.3 |
1000 |
472 |
121 |
57.0 |
71.4 |
96.2 |
323 |
Blank |
478 |
3310 |
83.0 |
93.4 |
— |
100 |
456 |
796 |
60.0 |
70.0 |
76.0 |
250 |
459 |
532 |
56.5 |
75.0 |
84.0 |
500 |
467 |
302 |
59.0 |
86.0 |
90.8 |
1000 |
477 |
263 |
60.0 |
72.0 |
92.0 |
Both the cathodic and anodic current in the presence of the inhibitor are lower for the whole potential range with respect to those observed in the blank solution (Fig. 1). Any substantial or regular variation in the corrosion potential with inhibitor concentration is not seen; variation being limited within a relatively narrow range of ±20 mV (Fig. 1 and Table 1). The cathodic and anodic Tafel slopes (bc and ba, respectively) also do not indicate any systematic change. All these observations clearly indicate towards a mixed-type corrosion inhibition behavior of gluten hydrolysate for mild steel in acid.5 This proposes a mechanism for corrosion inhibition comprising the blocking of both the cathodic and anodic active sites by the inhibitor molecules, thereby decreasing the rate of both the cathodic hydrogen evolution and anodic metal dissolution reactions. Within the range of temperature selected for the study, it was observed that %ηP initially increases with temperature, reaches a maximum at around 313 K and then decreases.
Electrochemical impedance measurements
The Nyquist plots, derived from the EIS experiments, for mild steel in a HCl solution in the presence of different concentrations of gluten hydrolysate at a fixed temperature and those corresponding to different temperatures at a particular concentration are shown in Fig. 2 and S3 (in ESI†), respectively.
 |
| Fig. 2 Nyquist plots for mild steel in 1 M HCl in the presence of (a) no inhibitor, (b) 100 ppm, (c) 250 ppm, (d) 500 ppm and (e) 1000 ppm gluten hydrolysate at 313 K. | |
Using the equivalent circuit, as described in electrochemical measurements section, the corresponding fitting parameters and the inhibition efficiencies, ηZ (%) obtained from the Rp values are tabulated in Table 2. Bode plots for mild steel in HCl in the presence of 1000 ppm inhibitor at different temperatures are shown in Fig. 3.
Table 2 Impedance parameters for the corrosion of mild steel in 1 M HCl in various concentrations of gluten hydrolysate at different temperatures
Temp. (K) |
Inhibitor conc. (ppm) |
Rp (Ω cm2) |
Q (μΩ−1 sn cm−2) |
n |
Cdl (μF cm−2) |
ηZ (%) |
293 |
Blank |
5.3 |
904 |
0.86 |
378.0 |
|
100 |
42.3 |
205 |
0.86 |
95.0 |
87.5 |
250 |
98.6 |
150 |
0.87 |
80.0 |
94.6 |
500 |
139.0 |
130 |
0.87 |
71.3 |
96.2 |
1000 |
159.0 |
128 |
0.86 |
67.8 |
96.6 |
303 |
Blank |
3.6 |
978 |
0.85 |
360.0 |
|
100 |
32.0 |
190 |
0.87 |
88.5 |
88.7 |
250 |
59.0 |
155 |
0.88 |
81.7 |
93.9 |
500 |
98.0 |
140 |
0.86 |
69.6 |
96.3 |
1000 |
125.0 |
120 |
0.88 |
67.6 |
97.1 |
313 |
Blank |
1.7 |
1253 |
0.86 |
460.0 |
|
100 |
15.3 |
268 |
0.88 |
126.0 |
88.9 |
250 |
34.0 |
255 |
0.85 |
110.0 |
95.0 |
500 |
59.0 |
170 |
0.85 |
75.5 |
97.1 |
1000 |
70.0 |
133 |
0.86 |
62.1 |
97.6 |
323 |
Blank |
1.1 |
2108 |
0.82 |
558.0 |
|
100 |
9.0 |
371 |
0.83 |
115.0 |
87.7 |
250 |
15.8 |
280 |
0.85 |
107.0 |
93.0 |
500 |
28.0 |
238 |
0.86 |
105.0 |
96.0 |
1000 |
35.0 |
191 |
0.83 |
69.0 |
96.8 |
 |
| Fig. 3 Bode plots for mild steel in 1 M HCl in the presence of 1000 ppm gluten hydrolysate at different temperatures. | |
These clearly show the existence of only one time constant having one negative deflection in the Bode magnitude plots. This validates the selection of the equivalent circuit as described. The Nyquist plots and corresponding fitted parameters suggest that for all the temperatures, increasing the inhibitor concentration provides an increased diameter of the capacitive loop, which, in-turn, results in a higher polarization resistance with a concomitant decrease in the Q or Cdl values. This is consistent with the model that inhibitor molecules are adsorbed on the metal surface, resulting in a resistive layer towards charge transfer. With the gradual increment of the inhibitor concentration, the degree of surface coverage on the metal, as well as the thickness of the inhibitive layer is enhanced and as a consequence, Rp and %ηZ values are found to increase, while Q or Cdl decreases. At a fixed inhibitor concentration, the diameter of the capacitive loops decreases with an increase in temperature. This suggests that at higher temperature, the degree of surface coverage by the inhibitor molecules diminishes. This, in-turn is reflected in the %ηZ values, which show that gluten hydrolysate provides the most efficient protective layer on the metal surface at around 313 K, above which its efficiency drops.
Weight loss measurements
Observations from electrochemical measurements are verified by a weight loss method. The rate of corrosion (CR) in terms of weight loss is also found to decrease with an increase in gluten hydrolysate concentration (Table 3). For all the concentrations of gluten hydrolysate used for the present study, it is observed that %ηW calculated from the CR values initially increases up to 313 K, and thereafter it tends to decrease (Fig. S4 in ESI† section). Looking into the effect of time of exposure, it is seen that gluten hydrolysate at a concentration of 1000 ppm and at a room temperature of around 303 K, can provide good corrosion inhibition for nearly 50 h of exposure (efficiency > 90%) in 1 M HCl medium (Fig. 4). The corresponding data is shown in Table S1 (in the ESI†). This supports the conclusion that gluten hydrolysate is adsorbed on the metal surface and renders a good corrosion protective layer that lasts for a considerable time of exposure in an aggressive environment. After nearly 50 h of exposure, the inhibition efficiency begins to drop sharply. This may be due to the breaking of amide linkages in the protein chains due to hydrolysis in a strong acidic environment, which thereby decreases the molecular volume. This type of behaviour is seen for most of the biopolymer-based corrosion inhibitors.20 It may be mentioned here that most of the popular organic corrosion inhibitors (like N and S containing heterocyclic organic molecules) also provide a comparable extent of inhibition efficiency for mild steel in 1 M HCl, but the efficiency is maintained for more than 90 h of exposure time.33
Table 3 Corrosion parameters from the weight loss measurements for mild steel after 6 h of immersion in 1 M HCl
Temp. (K) |
Inhibitor conc. (ppm) |
CR (mg cm−2 h−1) |
ηW (%) |
θ |
293 |
Blank |
0.852 |
— |
— |
100 |
0.094 |
88.9 |
0.89 |
250 |
0.074 |
91.3 |
0.91 |
500 |
0.068 |
92.0 |
0.92 |
1000 |
0.053 |
93.8 |
0.94 |
303 |
Blank |
1.834 |
— |
— |
100 |
0.160 |
91.4 |
0.91 |
250 |
0.136 |
92.6 |
0.93 |
500 |
0.121 |
93.4 |
0.93 |
1000 |
0.110 |
94.0 |
0.94 |
313 |
Blank |
4.320 |
— |
— |
100 |
0.320 |
92.6 |
0.93 |
250 |
0.272 |
93.7 |
0.94 |
500 |
0.222 |
94.8 |
0.95 |
1000 |
0.185 |
95.7 |
0.96 |
323 |
Blank |
5.664 |
— |
— |
100 |
0.700 |
87.6 |
0.88 |
250 |
0.680 |
88.0 |
0.88 |
500 |
0.506 |
91.0 |
0.91 |
1000 |
0.420 |
92.6 |
0.93 |
 |
| Fig. 4 Effect of exposure time on the corrosion inhibition efficiency of gluten hydrolysate for mild steel in 1 M HCl at around 303 K. | |
Adsorption isotherm and adsorption parameters
Among several adsorption isotherms, the Langmuir adsorption isotherm is found to be best suited to determine the adsorption characteristics of gluten hydrolysate on mild steel in an acid medium and to evaluate the corresponding thermodynamic parameters of adsorption. As per the model, the degree of surface coverage θ, as determined from the weight loss measurements, is related to the concentration of the inhibitor (C) following the relation:34where, Kads is the constant of adsorption. For all the temperatures, the excellent linear fitting of the experimental data points (correlation coefficient, R2 = 0.999, and slope value within the range 1.04–1.07) confirms the applicability of the model (Fig. 5).19–21 From the values of the adsorption constant, Kads, the standard free energy of adsorption (ΔG0ads) at different temperatures are determined using the following equation:19–21 |
ΔG0ads = −RT ln(1 × 10⁶Kads)
| (8) |
where, 1 × 10⁶ is the concentration of water molecules expressed in mg L−1, R is the universal gas constant and T is the temperature.
 |
| Fig. 5 Langmuir adsorption plot for mild steel in 1 M HCl in the presence of gluten hydrolysate at different temperatures. | |
Negative values of ΔG0ads suggest spontaneous adsorption of gluten hydrolysate on the metal at all the temperatures (Table 4).
Table 4 Calculated parameters from the Langmuir adsorption isotherm
Temp. (K) |
Slope |
R2 |
Kads (L mg−1) |
−ΔG0ads (kJ mol−1) |
293 |
1.06 |
0.9999 |
1.1 × 10⁻¹ |
28.27 |
303 |
1.06 |
0.9999 |
2.26 × 10⁻¹ |
31.05 |
313 |
1.04 |
0.9999 |
1.74 × 10⁻¹ |
31.40 |
323 |
1.07 |
0.9998 |
8.15 × 10⁻² |
30.37 |
It is observed from the table that ΔG0ads progressively becomes more negative with an increase in temperature and achieves a maximum negative value at 313 K, above which it becomes less negative. The extent of the adsorption of gluten hydrolysate is thus found to be temperature dependent. This type of temperature dependency cannot be explained on the basis of only a physical or chemical mode of adsorption. Rather, it is more logical to conclude that both types of adsorption play their role during the adsorption process over the whole temperature range.35–37
In order to elucidate the adsorption characteristics in terms of the enthalpy and entropy of adsorption, ΔG0ads is plotted against T (Fig. 6). ΔH0ads and ΔS0ads can be evaluated from the intercept and slope, respectively, from the basic thermodynamic relation:
|
ΔG0ads = ΔH0ads − TΔS0ads
| (9) |
 |
| Fig. 6 Variation of the free energy of adsorption with temperature. | |
A very interesting observation is found from the plot of ΔG0ads vs. T. At a lower temperature range (within 293–303 K), ΔH0ads is positive (around 53.1 kJ mol−1), indicating that the adsorption is endothermic. ΔS0ads is also found to be positive (around 278 J mol−1). These values suggest that at a lower temperature range, the adsorption is entropy driven. Also, due to the endothermic nature, the extent of adsorption initially increases with an increase in temperature, which is reflected in the ΔG0ads values as well as the inhibition efficiency. But at a higher temperature range, ΔH0ads, as well as ΔS0ads are found to become negative (−63.6 kJ mol−1 and −103 J mol−1, respectively, in the temperature range 313–323 K). This shows that at higher temperature adsorption becomes exothermic, and essentially enthalpy driven.
Kinetics of adsorption and activation parameters
The kinetic-thermodynamic parameters have been evaluated following the variation of corrosion rate (CR) with temperature and employing the Arrhenius equations: |
 | (10) |
|
 | (11) |
where E* is the activation energy of the corrosion process, λ is the Arrhenius frequency factor (pre-exponential factor), R is the universal gas constant, h is Planck’s constant, NA is Avogadro’s number, T is the absolute temperature, ΔS* is the entropy of activation and ΔH* is enthalpy of activation. E* and λ are determined from the slope and intercept, respectively, of the plot log
CR vs. 1/T (Fig. 7 and Table 5). It is seen that rate of corrosion increases with an increase in temperature, following the Arrhenius equation. The E* values calculated in the presence of the inhibitor with various concentrations are seen to be greater than that for the blank solution. This illustrates the formation of a protective layer of the inhibitor on the metal surface, which thereby increases the inhibition efficiency.35–37 But, the apparent activation energy does not show any gradual variation with the concentration of the inhibitor. Initially it increases, reaching a maximum value at 250 ppm, and then it decreases. Generally speaking, increasing the activation energy corresponds to physical adsorption, whereas, a decrease in the activation energy can be related to chemical adsorption.35–37 Thus in the lower concentration range, the extent of physical adsorption increases with a gradual increase in concentration, leading to an increase in the inhibition efficiency. This is reflected in an increase in E*. But above 250 ppm, the possibility of chemical adsorption becomes more dominant. The observation that above 250 ppm, the inhibition efficiency increases even with a decrease in E*, can be accounted for by the corresponding decrease in the Arrhenius frequency factor (pre-exponential factor, λ). The enthalpy of activation (ΔH*) and entropy of activation (ΔS*) are evaluated from the slope and intercept, respectively, of the plot of log(CR/T) vs. (1/T) (Fig. S5 in ESI†) and are tabulated in Table 5. It is seen that ΔH* also varies in the same fashion as that for E*. It is also observed that the difference between E* and ΔH*, on average, remains very close to the average value of RT (2.56 kJ mol−1).
 |
| Fig. 7 Arrhenius plots for mild steel in a 1 M HCl solution in the absence and presence of different concentrations of gluten hydrolysate. | |
Table 5 Activation parameters for the mild steel dissolution in 1 M HCl in the absence and presence of gluten hydrolysate
Conc (ppm) |
λ (mg cm−2 h−1) |
E* (kJ mol−1) |
ΔH* (kJ mol−1) |
ΔS* (kJ mol−1 K−1) |
Blank |
42.46 × 10⁸ |
53.88 |
51.63 |
−69.82 |
100 |
7.69 × 10⁸ |
55.98 |
53.21 |
−84.11 |
250 |
47.20 × 10⁸ |
61.02 |
58.27 |
−68.89 |
500 |
4.27 × 10⁸ |
55.32 |
52.44 |
−89.28 |
1000 |
4.27 × 10⁸ |
55.66 |
53.17 |
−88.41 |
Surface analysis
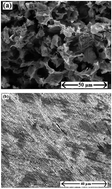
The corrosion inhibition potentiality of gluten hydrolysate is assessed directly by comparing the surface morphology of the mild steel sample immersed in 1 M HCl solution without and with 500 ppm of gluten hydrolysate through scanning electron micrographs (SEM) of the metal surface (Fig. 8a and b). The mild steel immersed in HCl shows a very rough surface due to formation of the corrosion product. But in the presence of gluten hydrolysate, a much cleaner and smoother surface comparable with that of the polished one is observed. This provides conclusive evidence towards the ability of gluten hydrolysate to decrease the aggressiveness of HCl in regard to its corrosive characteristics for mild steel.
 |
| Fig. 8 SEM images of mild steel after immersion in 1 M HCl having (a) no inhibitor and (b) gluten hydrolysate. | |
The formation of a corrosion inhibitive layer on the mild steel surface is further confirmed by comparing the FTIR spectra of gluten hydrolysate (Fig. 9A) with that of the adsorbed surface layer of mild steel immersed in 1 M HCl having 1000 ppm gluten hydrolysate (Fig. 9B). The main absorption bands of polypeptides or proteins are due to their characteristic amide I (mainly the stretching vibration of the C
O group) at around 1660 cm−1 and amide II (in-plane N–H bending) at nearly 1585 cm−1.38–40 These bands can distinctly be seen in the FTIR spectrum of gluten hydrolysate (Fig. 9A). The presence of bands at 1448 and 1401 cm−1 is due to the C–N stretching and COO− vibrations, respectively, of different amino acid side chains present in gluten hydrolysate.39,40 The amide A (∼3300 cm−1) and amide B (∼3100 cm−1) bands originate from a Fermi resonance between the first overtone of amide II and the N–H stretching vibrations.39 The bands in the range of 2961 cm−1 to 2868 cm−1 are due to the aliphatic C–H stretching vibrations.39,40 In the surface adsorbed gluten hydrolysate, the amide I band is prominently red shifted to 1635 cm−1. The amide II band at 1585 cm−1 in native gluten hydrolysate is also shifted to 1560 cm−1 (Fig. 9B). This illustrates the participation of the amide groups in the polypeptide (protein) backbone towards the adsorption of proteins on the metal surface. The absorption bands at 1448 and 1401 cm−1 are also seen to undergo prominent shift towards lower wavenumber region with some broadening of the bands in the adsorbed state. Thus in conjunction with the amide group, the involvement of the side chains present in the different amino acid residues can definitely be argued during the whole adsorption process.
 |
| Fig. 9 FTIR spectra of gluten hydrolysate in (A) native form, and (B) surface adsorbed form. | |
Discussion
Observations from the electrochemical as well as weight loss techniques have shown that the inhibition efficiency of gluten hydrolysate towards the corrosion of mild steel in a HCl medium does not vary monotonically with temperature, it first gradually increases from a lower temperature, reaching a maximum value at around 313 K, and then decreases. The free energy of adsorption is also found to be temperature dependent. The activation energy for the adsorption process, on the other hand, depends on concentration. These observations, along with the findings from the FTIR studies suggest that the possible mode of interaction between gluten hydrolysate with the mild steel surface in an acid medium is comprised of competition between electrostatic physical and chemical adsorption models as a function of temperature and concentration, as well as the complex nature of the adsorption of the polypeptide chains of the protein on the metal surface.41–44 It is well established that the mild steel surface in a 1 M HCl medium under equilibrium condition carries net positive charge. Hence, it is understood that at least a fraction of the metal surface should be pre-occupied by the Cl− ions.13,35 On the other hand, it is most possible that some of the peptide chains remain in protonated form in an acid medium. Thus at a lower concentration and a lower temperature range, the electrostatic physical adsorption of protonated peptide chains on the metal surface through Cl− ions can be considered as a natural phenomenon. Even, at very low temperature, the formation of multilayers cannot be ruled out (i.e., physical adsorption leading to multilayer formation at lower temperature). In these cases, the electrostatic repulsion among the charged groups present in the adjacent peptide chains can result in an increase in enthalpy (endothermic).35–37 Such repulsive interactions as well as the possibility of multilayer formation can be responsible for the positive entropy of adsorption. Additionally, the release of the water molecules which were bound to the metal surface before the adsorption of the peptide chains of the protein, can also contribute towards the positive ΔS0ads.41–43 The possibility of physical adsorption remains predominant nearly up to 250 ppm and as a result E* becomes maximal at this point. At higher concentration, higher the number of reactive functional groups that are available for adsorption. Higher temperature also opens up the protein chains, thus enhancing the accessibility of such groups.43 These reactive centers with either a lone pair of electrons or a negative charge present on them (e.g. the COO− group present in glutamic acid) can directly interact with the adsorption sites on the metal which are not occupied by Cl− ions, or even by replacing those pre-adsorbed Cl− ions, through a charge transfer mechanism. Data from the FTIR studies suggest the occurrence of such interactions. As a result, heat is evolved (exothermic chemisorption), and ΔS0ads becomes negative. As chemisorption becomes more dominating over physisorption, E* is seen to decrease gradually beyond 250 ppm concentration. The entropy of activation (ΔS*) for all the inhibitor concentrations remains more negative than that in the blank, except for the 250 ppm concentration. This may be explained by the formation of a compact inhibitor layer on the metal surface at the activated state, which lowers the disorder of that state. For the 250 ppm concentration, the possible multilayer formation or/and the enhanced repulsive interaction among adjacent peptide chains can be responsible for the slight increase in the disorder of the activated state compared to that in the blank solution. It is noteworthy that gluten hydrolysate does not induce inhibition of the corrosion of mild steel in 3.5% aqueous NaCl solution (pH ∼ 6) to any significant extent. At this pH, it is very much unlikely that the peptide side chains will acquire positive charges. As a result, electrostatic repulsion among the surface adsorbed Cl− ions and the lone pair of electrons of peptide bonds as well as the negative charge present on the glutamic acid residue provides hindrance towards a close approach between the peptide chain and the metal surface, which is required for any possible charge transfer leading to surface adsorption and subsequent corrosion inhibition. This further supports our explanation regarding the nature of the adsorption and inhibition properties of gluten hydrolysate towards the corrosion of mild steel in a highly acidic medium.
Conclusions
Gluten hydrolysate is shown to act as an efficient green inhibitor in mitigating the corrosion of mild steel in 1 M HCl. A high inhibition potentiality is observed (more than 90% with 1000 ppm concentration) in a temperature range of 293 to 323 K and for a considerable time of exposure. Potentiodynamic polarization studies indicate that gluten hydrolysate behaves as a mixed-type corrosion inhibitor for mild steel in an acid medium. Results from the EIS and weight loss experiments can be best explained following the formation of a corrosion resistive layer of the gluten hydrolysate on the metal surface. The inhibition efficiency is found to increase initially up to 313 K and then it decreases. The thermodynamic adsorption parameters are seen to be dependent on temperature, while the activation parameters are concentration dependent. A model of the simultaneous physical and chemical adsorption depending on temperature and concentration has been put forward to explain the experimental findings. FTIR studies confirm the involvement of amide groups as well as amino acid side chains for the adsorption of gluten hydrolysate on the metal surface.
Acknowledgements
DS thanks the Department of Science and Technology, Govt. of India for supporting a research project under the Fast Track Scheme for Young Scientists (no. SR/FT/CS-110/2010, dt. 20.09.2011).
References
- M. B. P. Mihajlović and M. M. Antonijević, Int. J. Electrochem. Sci., 2015, 10, 1027 Search PubMed.
- M. Finšgar and J. Jackson, Corros. Sci., 2014, 86, 17 CrossRef PubMed.
- P. Rajeev, A. O. Surendranathan and C. S. N. Murthy, J. Mater. Environ. Sci., 2012, 3, 856 CAS.
- K. Sayin and D. Karakaş, Corros. Sci., 2013, 77, 37 CrossRef CAS PubMed.
- I. L. Rozenfeld, Corrosion Inhibitors, McGraw-Hill Inc, New York, 1981 Search PubMed.
- S. A. Abd El-Maksoud, Int. J. Electrochem. Sci., 2008, 3, 528 CAS.
- D. M. Bastidas, E. Cano and E. M. Mora, Anti-Corros. Methods Mater., 2005, 52, 71 CrossRef CAS.
- V. S. Saji, Recent Pat. Corros. Sci., 2011, 1, 63 CrossRef.
- L. Bai, L.-J. Feng, H.-Y. Wang, Y.-B. Lu, X.-W. Lei and F.-L. Bai, RSC Adv., 2015, 5, 4716 RSC.
- P. B. Raja and M. G. Sethuraman, Mater. Lett., 2008, 62, 113 CrossRef CAS PubMed.
- S. A. Umoren, Open Corros. J., 2009, 2, 175 CrossRef CAS.
- B. E. A. Rani and B. B. J. Basu, Int. J. Corros., 2012 DOI:10.1155/2012/380217.
- M. A. Amin, K. F. Khaled, Q. Mohsen and H. A. Arid, Corros. Sci., 2010, 52, 1684 CrossRef CAS PubMed.
- M. Li, J. Xu, R. Li, D. Wang, T. Li, M. Yuan and J. Wang, J. Colloid Interface Sci., 2014, 417, 131 CrossRef CAS PubMed.
- R. Solmaz, Corros. Sci., 2014, 81, 75 CrossRef CAS PubMed.
- R. S. A. Hameed, E. A. Ismail, A. H. Abu-Nawwas and H. I. Al-Shafey, Int. J. Electrochem. Sci., 2015, 10, 2098 Search PubMed.
- F. Zhang, J. Pan and P. M. Claesson, Electrochim. Acta, 2011, 56, 1636 CrossRef CAS PubMed.
- S. A. Umoren, U. M. Eduok, A. U. Israel, I. B. Obot and M. M. Solomon, Green Chem. Lett. Rev., 2012, 5, 303 CrossRef CAS PubMed.
- P. Roy, A. Pal and D. Sukul, RSC Adv., 2014, 4, 10607 RSC.
- P. Roy, P. Karfa, U. Adhikari and D. Sukul, Corros. Sci., 2014, 88, 246 CrossRef CAS PubMed.
- P. Roy and D. Sukul, RSC Adv., 2015, 5, 1359 RSC.
- P. R. Shewry, N. G. Halford, P. S. Belton and A. S. Tatham, Philos. Trans. R. Soc. London, Ser. B, 2002, 357, 133 CrossRef CAS PubMed.
- L. Day, M. A. Augustin, I. L. Batey and C. W. Wrigley, Trends Food Sci. Technol., 2006, 17, 82 CrossRef CAS PubMed.
- B. H. Sarmadi and A. Ismail, Peptides, 2010, 31, 1949 CrossRef CAS PubMed.
- X. Zheng, L. Li, X. Liu, X. Wang, J. Lin and D. Li, Appl. Microbiol. Biotechnol., 2006, 73, 763 CrossRef CAS PubMed.
- E. Apper-Bossard, A. Feneuil, A. Wagner and F. Respondek, Aquat. Biosyst., 2013, 9, 13 CrossRef PubMed.
- M. Funaba, Y. Oka, S. Kobayashi, M. Kaneko, H. Yamamoto, K. Namikawa, T. Iriki, Y. Hatano and M. Abe, Can. J. Vet. Res., 2005, 69, 299 CAS.
- F. P. O’Mara, J. J. Murphy and M. Rath, J. Anim. Sci., 1997, 75, 1941 Search PubMed.
- T. Pajkossy, Solid State Ionics, 2005, 176, 1997 CrossRef CAS PubMed.
- U. Rammelt and G. Reinhard, Corros. Sci., 1987, 27, 373 CrossRef CAS.
- M. Chevalier, F. Robert, N. Amusant, M. Traisnel, C. Roos and M. Lebrini, Electrochim. Acta, 2014, 131, 96 CrossRef CAS PubMed.
- G. J. Brug, A. L. G. van den Eeden, M. Sluyters-Rehbach and J. H. Sluyters, J. Electroanal. Chem., 1984, 176, 275 CrossRef CAS.
- A. Dutta, S. K. Saha, P. Banerjee and D. Sukul, Corros. Sci., 2015 DOI:10.1016/j.corsci.2015.05.065.
- K. Y. Foo and B. H. Hameed, Chem. Eng. J., 2010, 156, 2 CrossRef CAS PubMed.
- E. A. Noor, Int. J. Electrochem. Sci., 2007, 2, 996 CAS.
- A. Popova, Corros. Sci., 2007, 49, 2144 CrossRef CAS PubMed.
- A. Zarrouk, B. Hammouti, H. Zarrok, S. S. Al-Deyab and M. Messali, Int. J. Electrochem. Sci., 2011, 6, 6261 CAS.
- M. Jackson and H. H. Mantsch, Crit. Rev. Biochem. Mol. Biol., 1995, 30, 95 CrossRef CAS PubMed.
- A. Barth, Biochim. Biophys. Acta, 2007, 1767, 1073 CrossRef CAS PubMed.
- A. Barth, Prog. Biophys. Mol. Biol., 2000, 74, 141 CrossRef CAS.
- N. P. Cosman, K. Fatih and S. G. Roscoe, J. Electroanal. Chem., 2005, 574, 261 CrossRef CAS PubMed.
- S. Omanovic and S. G. Roscoe, J. Colloid Interface Sci., 2000, 227, 452 CrossRef CAS PubMed.
- K. Nakanishi, T. Sakiyama and K. Imamura, J. Biosci. Bioeng., 2001, 91, 233 CrossRef CAS.
- O. Santos, T. Nylander, M. Paulsson and C. Trägårdh, J. Food Eng., 2006, 74, 468 CrossRef CAS PubMed.
Footnote |
† Electronic supplementary information (ESI) available. See DOI: 10.1039/c5ra12266j |
|
This journal is © The Royal Society of Chemistry 2015 |
Click here to see how this site uses Cookies. View our privacy policy here.