DOI:
10.1039/C5RA12136A
(Paper)
RSC Adv., 2015,
5, 85373-85382
Pore-scale modeling of a water/oil two-phase flow in hot water flooding for enhanced oil recovery
Received
23rd June 2015
, Accepted 23rd September 2015
First published on 23rd September 2015
Abstract
An attempt was made to investigate the hot water displacement process inside a two-dimensional pore–throat structure by a computational fluid dynamics (CFD) method. The VOF (volume of fluid) method implemented in the CFD software FLUNT was used and a model for two-phase flow and heat transfer was developed. Hot water injection was compared with conventional water injection and it exhibited a higher oil recovery factor and a lower displacement pressure. Then, the behaviors of hot water flooding in a pore with different wettability were investigated. For the oil-wet case, the contact angle and original oil saturation affected the displacement behavior and the oil recovery factor significantly. However, in the water-wet system, the oil phase was surrounded by water, and all the oil could then be driven out of the pore. For the intermediate wet system, three cases with different initial oil/water distribution patterns were simulated, also taking into consideration the effects of droplet size and the symmetry. The results show that the initial oil/water distribution patterns play a more important role in the hot water displacement behavior than the contact angle and oil viscosity.
1 Introduction
The worldwide demand for crude oil is continuously increasing due to industrial development and increase in the world's population. The increase in the global demand and consumption of oil stimulates oil producers to exploit unconventional oil resources. Heavy oil is one type of unconventional oil resource and has been found in many areas around the world, with the estimated global heavy oil resource being around 8 trillion barrels in place.1 However, the flow resistance of heavy oil in reservoirs is high because of its high viscosity. Thus, conventional recovery methods cannot yield good results in exploiting these oil reservoirs. Instead, heavy oil recovery methods mainly include primary production, thermal production, and cold enhanced oil recovery. Thermal recovery technology can reduce the viscosity of crude oil and its flow resistance by injecting hot water or steam in to the reservoir. This is widely used in the exploitation of heavy oil reservoirs because it has been proven to be effective for recovering heavy oil.2–5 The heat transfer and flow mechanisms in thermal recovery techniques are of great interest and importance to the rational use of heat medium and the effective exploitation of heavy oil.
Hot water flooding is a thermal recovery technique and is the least expensive and easiest to implement. Although the heat capacity carried by water is less than that by steam, hot water flooding has more advantages in mobility control and in increasing the volumetric sweep efficiency compared with steam flooding. Martin et al.6 conducted a case study of a hot water flooding pilot test in the Loco field in southern Oklahoma, which contained oil with a viscosity of 600 cp. Their study showed that the oil recovery increased after hot water flooding. Hot water flooding has also been adopted after steam channeling in steam flooding.7,8 In the final stage of steam flooding, steam channeling always occurs because of the steam gravity override in the upper reservoir. Steam channeling is weakened by hot water injection. Moreover, hot water flooding has been used in low permeability reservoirs containing oil with a high paraffin content. Field tests have been conducted in this type of oil reservoir such as the Senex oil field in Canada and the Ansai oil field in China, which indicated that hot water flooding increased oil recovery by as much as 25%.9
A large number of experimental and numerical studies on hot water displacement have been conducted because of the good performance of hot water flooding in oil recovery.10–13 In the experimental studies, a number of factors affecting oil recovery were investigated such as hot water temperature and the injection rate. Bousaid14 conducted hot water flooding in a five-foot cell with the Kern River viscous oil. The results showed that hot water flooding could mobilize the original oil in reservoirs effectively above a temperature of 96 °C. When the hot water temperature increased to 115 °C, the residual oil saturation near the injection well decreased to 18%. Jabbour et al.15 investigated the steam/water/oil flow in the steam flooding process. Their study showed that oil recovery increased with the increase in injected water temperature. Okasha et al.16 investigated the effect of hot water injection on tarmat displacement and concluded that oil recovery using hot water was higher than when using cold water in reservoirs containing tarmat.
Furthermore, numerical investigations have been conducted in which mathematical models were established to describe the physical processes in hot water flooding. Goodyear et al.13 presented a simulation study of hot water flooding in a high permeability reservoir containing heavy oil with a viscosity of 400 cp. They found that hot water flooding could recover 18% of the original oil in place (OOIP). Al-Shatti et al.17 evaluated the performances of hot water flooding and steam flooding in developing heavy oil from a Middle Eastern reservoir. Their simulation study showed that hot water flooding was more effective than steam flooding in developing this heavy oil reservoir. Furthermore, Alajmi et al.18,19 numerically investigated the effects of flooding patterns, well configurations, hot water temperatures and degree of reservoir heterogeneity on heavy oil recovery in both homogenous and heterogeneous reservoirs using the commercial reservoir simulator ECLIPSE. They concluded that these parameters played important roles in the heavy oil displacement. They found that the injection well length affected the heavy oil recovery more significantly in homogenous reservoirs, while reservoir heterogeneity affected heavy oil recovery more significantly in heterogeneous reservoirs. In another study, Alajmi et al.20 investigated the use of hot water flooding in a Middle Eastern heavy oil reservoir with heterogeneity that differed significantly from one location to another. They concluded that the degree and structure of heterogeneity played a significant role in the performance of the hot water flooding, and for the reservoir in their study, vertical wells in a five-spot pattern was the most suitable well configuration.
Overall, heat transfer includes conduction, convection and radiation. Radiative heat transfer has obvious effects in pores at temperatures higher than 1000 K, which is considerably higher than the hot water temperature in heavy oil recovery; thus,21 for hot water flooding it will be neglected. In the process of hot water displacement, the heat transfer processes are mainly heat conduction and convection.
Many studies on hot water displacement processes in porous media have been carried out.2,3,22,23 Some mechanisms of hot water flooding have been revealed such as viscosity reduction and thermal expansion; however, in most of the studies, the conclusions made are mainly at the macro level.2,3 Besides, the internal flow and temperature changes of each phase in the porous medium in the hot water displacement process are difficult to measure. Therefore, to date, little has been known about the heat and phase distributions at the pore scale in the hot water displacement process. The micro-mechanisms in the hot water displacement process are not well understood. Numerical simulation is an effective method to investigate the flow behaviors in microchannels.24,25 The study presented here is focused on the two-phase flow and heat transfer in a single pore in hot water displacement and it attempts to delineate the micro-mechanisms in the hot water displacement process. For the unsteady process of hot water flooding, physical and mathematical models were established. The CFD software FLUNT and VOF interface tracking technology were used in the simulation.
2 Computational model
In the present study, the CFD software FLUNT (Release 6.3, 2006) was used to simulate the process of hot water displacement in a single pore. For multiphase flow in a microchannel, one important problem is how to determine the position of the multiphase fluid interface. In this study, the VOF interface tracking technology26 was used to track the oil/water interface. The VOF model is an effective multiphase model for interface identification and has been successfully used in simulating gas/liquid and liquid/liquid two-phase flow in microchannels.27–30 The core principle behind the VOF method is to track the interface through the introduction of a volume fraction of the fluid and control equations. In the VOF method, a variable αi is defined as the phase volume fraction of the computational cell for each phase in the model, where the sum of the volume fractions αi of all the phases in a computational cell is 1. Furthermore, the volume fraction of oil equals to 1 in a cell completely occupied by the oil phase, while it equals to 0 in a cell occupied by the water phase. In the cell with the oil–water interface, the volume fractions of oil and water lie between 0 and 1.
2.1 Model geometry
The two-dimensional pore used in the simulation is a square with a side length of 160 μm, as shown in Fig. 1. The lengths of the two connecting throats are also 160 μm, and the radius ratio of the pore to throat is 5. The shadow region refers to the reservoir rock. The grid is made up of quadrilateral control volumes. The geometry was meshed by the GAMBIT package (Release 2.4.6), which was imported into FLUNT for the simulation. The hot water was injected through the left inlet with a constant velocity of 0.005 m s−1. The heat from the hot water was transferred to the fluids in the pore and the rock around the pore during the hot water displacement process; however, in this study, only the heat transfer between the water and oil was considered, and the computational domain was the pore and throats.
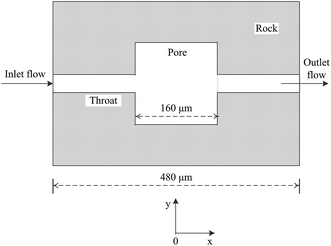 |
| | Fig. 1 Schematic of the two-dimensional pore–throat configuration. | |
2.2 Governing equations
The governing equations for the VOF method include the continuity equation, the momentum equation, the energy equation and the volume fraction equation.
Equation of continuity:
| |
 | (1) |
Equation of motion:
| |
 | (2) |
Equation of energy:
| |
 | (3) |
where

is the velocity vector,
ρ is the volume-averaged density,
p is the pressure,
μ is the coefficient of kinetic viscosity,

is the surface tension force per unit volume,
T is the temperature,
λ is the thermal conductivity and
cp is the specific heat capacity. In the microscale condition, surface tension plays a dominant role in the two-phase flow system. The surface tension was thus predicted using the continuum surface force (CSF) model.
31 The surface tension force per unit volume

in
eqn (2) is calculated as follows:
| |
 | (4) |
where
σ is the surface tension coefficient and
κ is the interface curvature. The subscripts w and o refer to the water and oil phase, respectively.
κ is calculated as
| |
κ = −(∇·![[n with combining circumflex]](https://www.rsc.org/images/entities/i_char_006e_0302.gif) ) )
| (5) |
where
![[n with combining circumflex]](https://www.rsc.org/images/entities/i_char_006e_0302.gif)
is the unit normal vector of the interface. The contact angle with the wall was used to adjust the unit normal vector of the interface (
![[n with combining circumflex]](https://www.rsc.org/images/entities/i_char_006e_0302.gif)
) in the cells near the wall. The surface normal at the live cell next to the wall is
where
![[n with combining circumflex]](https://www.rsc.org/images/entities/i_char_006e_0302.gif) w
w and
![[t with combining circumflex]](https://www.rsc.org/images/entities/i_char_0074_0302.gif) w
w are the unit vectors normal and tangential to the wall, respectively.
Volume fraction equation is as follows:
| |
 | (7) |
When the computational cell is occupied by a single phase, i.e. water or oil, the properties of the water or oil are used in the equations, whereas when the water/oil interface lies in the computational cell, the properties used are the mixture properties of the two phases in a volume fraction weighted average. The following equations were used for calculating the properties in a computational cell.
| | |
ρ = αwρw + (1 − αo)ρo
| (8) |
| | |
μ = αwμw + (1 − αo)μo
| (9) |
The oil/water interface was reconstructed using a geometric reconstruction scheme, which was based on the piece linear interface calculation (PLIC) method.32,33 The boundary condition for the left inlet was the velocity inlet, where the inlet velocity of hot water was set to 0.005 m s−1. The outlet of the microchannel was specified as the pressure outlet. The boundary conditions for the pore wall were the adiabatic boundary condition and no-slip condition. A segregated time dependent unsteady solver was used for the simulation. The PRESTO! option was chosen for the pressure interpolation and the pressure velocity coupling algorithm PISO was used. The second-order upwind differencing scheme was used for the momentum equation. A time step of 1 × 10⁻⁵ s was used in the simulation, taking in to consideration the grid size and the inlet velocity. Gravity effects were neglected because gravity has minor influence in the micron-scale microchannels.29 In this study, it was assumed that the oil is non-volatile and the two phases (oil and water) are immiscible.
2.3 Physical properties of fluids
The properties of oil from the Liaohe Oil Field in China and pure water were used for the oil phase and water phase, respectively, in the simulation. The viscosity of the gas-saturated oil under reservoir conditions was estimated from the viscosity of gas-free oil by the corrections proposed by Beggs and Robinson.34 The calculated results are listed in Table 1, and the viscosity was piecewise-linear with temperature in the numerical simulation. The density of crude oil in the reservoir was affected by various factors such as temperature and pressure, but only the influence of temperature was considered because it was the most important factor. The oil density ρo of 912 kg m−3 at 60 °C was taken as the reference, and the densities of crude oil under different temperatures were obtained with the thermal expansion coefficient of 7.4 × 10⁻⁴ K−1. The thermal conductivity of oil, λo, decreased with temperature, but not significantly; thus, it was taken as a constant, i.e., 0.15 W m−1 K−1. The specific heat capacity of oil, cpo, was also taken as a constant, i.e., 2000 J kg−1 K−1. Most data indicated that the oil/water interfacial tension, σow, decreased linearly with the increase in temperature when below 100 °C. The oil/water interfacial tension decreased by 0.05 mN m−1 when the temperature was increased by 1 °C with a value of 25 mN m−1 at 60 °C taken as the reference. The properties of hot water in the reservoir condition were obtained using the calculation package of water and steam properties in FLUENT.
Table 1 Viscosities of gas-saturated oil at different temperatures
| Temperature (°C) |
Viscosity of gas-saturated oil (mPa s) |
| 60 |
443 |
| 65 |
355 |
| 70 |
266 |
| 75 |
204 |
| 80 |
158 |
| 85 |
128 |
| 90 |
97.1 |
| 100 |
52.4 |
| 125 |
17.3 |
| 150 |
6.40 |
2.4 Initial oil/water distribution patterns
The distribution pattern of oil and water in a pore is mainly related to the pore geometry, the surface wettability of the rock, and the properties of the oil and water.35 The residual oil in pores appears in three forms: oil drops, films and clusters.36 A certain contact angle forms when the water/oil interface meets the solid wall. The contact angle here was defined as the angle between the tangent of the water/oil interface and the solid wall through the water phase. Typically, in an oil-wet system, the contact angle of the water phase is larger than 90°. Oil is attached to the pore wall and the water phase lies in the middle. However, in a water-wet system, the contact angle of the water phase is usually smaller than 90°. Water is attached to the surface of the pore wall and the oil phase lies in the middle of the pore. In the intermediate wet case, the contact angle of the water phase is close to 90°, and the water phase and oil phase exist both on the pore wall surface and in the inner part of the pore. Based on the abovementioned two-dimensional model geometry, the original oil and water distribution patterns for the different wettabilities used in this study were simplified, as shown in Fig. 2 and 3. The red represents the oil phase, while the blue represents the water phase. The shape of the droplet was taken as a rectangle for the convenience of initialization. For the oil-wet system, oil was attached to the pore wall, while the water phase existed in the middle of the pore and throats. The distribution of oil and water were opposite for the water-wet case. For the intermediate wet case, the initial oil/water distribution patterns were complex. Considering the effects of droplet size and symmetry, three initial oil/water distribution patterns for the intermediate wet system were used in this study, as shown in Fig. 3. The size of the oil/water droplets showed an increase in the following order: (a) < (b) < (c). For patterns (a) and (b), the oil droplets and water droplets were distributed alternately. The initial oil/water distribution of pattern (b) was up-down symmetrical, while those of patterns (a) and (c) were up-down asymmetric. The initial temperature and pressure of the reservoir were 60 °C and 8 MPa, respectively.
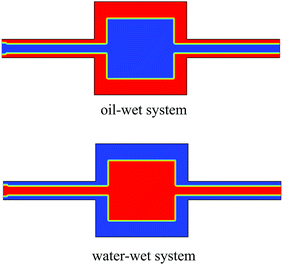 |
| | Fig. 2 The initial oil/water distribution patterns for the oil-wet system and water-wet system (red-oil, blue-water). | |
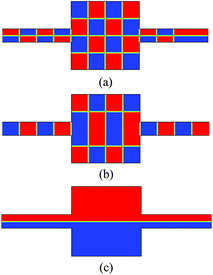 |
| | Fig. 3 Three initial oil/water distribution patterns for the intermediate wet system (a), (b) and (c). | |
3 Results and discussion
The hot water displacement processes were simulated for the three types of wettability: the oil-wet system, the intermediate wet system and the water-wet system. The initial temperature of the oil and water existing in the pore and throats was 60 °C and the temperature of the hot water injected was 100 °C. Because of the oil expansion with the increase in temperature, both the volume and mass recovery factors are given in the results and discussion. The oil recovery factor refers to the volume fraction of oil that was swept from the pore and throats, unless otherwise specified. The oil recovery factors can be calculated as follows:| |
 | (10) |
| |
 | (11) |
where Ev is the volume recovery factor, Em is the mass recovery factor, Vini (mini) is the initial volume (mass) of oil in the microchannel, Vswe (mswe) is the volume (mass) of oil swept from the microchannel, and Vres (mres) is the residual volume (mass) of oil in the microchannel after flooding.
3.1 Numerical verification
The rectangular grid was used for the simulations in this study. Initially, a grid independence study was performed in the oil-wet system (θ = 135°) originally saturated with oil. Fig. 4 shows the oil/water distributions at t = 90 ms in the displacement process at different mesh resolutions. The oil/water distributions were nearly the same, and the difference was only on the oil/water interface. The higher the resolution, the sharper the interface was. The volume fractions of the oil phase were 0.6016, 0.6015, 0.6015, and 0.6015 for the four mesh resolutions (a), (b), (c) and (d) in Fig. 4, respectively. The relative differences from coarse to dense meshes were within 0.003%. Considering both the computational accuracy and the computation time, the simulation in this study was based on 20![[thin space (1/6-em)]](https://www.rsc.org/images/entities/char_2009.gif) 160 quadrilateral cells in the model geometry. Convergence criteria were set at the beginning of computation. The residuals of continuity and velocity were less than 10−3, and the residual of energy was less than 10−6.
160 quadrilateral cells in the model geometry. Convergence criteria were set at the beginning of computation. The residuals of continuity and velocity were less than 10−3, and the residual of energy was less than 10−6.
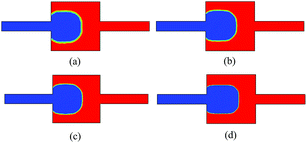 |
| | Fig. 4 Oil/water distributions at t = 90 ms at different mesh resolutions. Number of quadrilateral cells: (a) 5040 (b) 8960 (c) 20![[thin space (1/6-em)]](https://www.rsc.org/images/entities/char_2009.gif) 160 and (d) 35 160 and (d) 35![[thin space (1/6-em)]](https://www.rsc.org/images/entities/char_2009.gif) 840. 840. | |
Furthermore, the capillary force obtained from the simulation was compared with that calculated from the Laplace theory. Fig. 5 shows the oil/water interface and the pressure distribution on the central axis along the horizontal direction at t = 10 ms for hot water flooding. In hot water displacement, the capillary force refers to the pressure drop across the oil/water interface in the microchannel. As shown in Fig. 5, in this case, the first pressure drop on the curve was the capillary force. According to the Laplace theory, the capillary force Pc in a two-dimensional tube can be calculated by the following equation:
| |
 | (12) |
where
σ is the interfacial tension between the oil and water,
θ is the water contact angle, and
rc is the radius of a capillary tube.
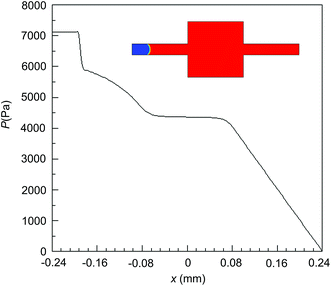 |
| | Fig. 5 Pressure distribution on the central axis along the horizontal direction at t = 10 ms in hot water flooding (θ = 135°). | |
The theoretical capillary force in the throat part was 1100 Pa, as calculated by eqn (12). Based on the simulation results, the capillary forces were 1200 Pa at t = 10 ms and 1190 Pa at t = 20 ms, which were obtained by calculating the pressure drop across the oil/water interface from the pressure distribution on the central axis of the microchannel along the horizontal direction. From the comparison, we can see that the capillary force from the simulation satisfies the Laplace theory quite well, albeit some discrepancy is caused by the real interface shape because the resolution in the simulations was not able to capture the interface shape adequately.
3.2 Comparison between hot water flooding and conventional water flooding
The process of hot water displacement was compared with that of conventional water displacement in a pore originally saturated with oil. Herein, the pore is oil-wet and the contact angle of the water phase is 135°.
Fig. 6 shows the changes of the pressure drop across the pore and throats with time during the hot water and conventional water displacement processes. Over the flooding, the pressure drop for hot water displacement was less than that of conventional water displacement. This was because the hot water heated the oil and thus reduced the viscosity of the oil. As the displacement proceeded, the oil in the pore was gradually replaced by water; thus, the pressure drops for both were reduced. For hot water flooding, the temperature of the oil phase gradually increased with the injection of hot water, and therefore the oil viscosity and pressure drop decreased gradually. However, in conventional water flooding, the pressure drop reduced gradually with the injection of water in the first stage, and it stayed constant when water entered the middle pore. After water flowed into the right throat, the pressure drop reduced rapidly until the water broke through.
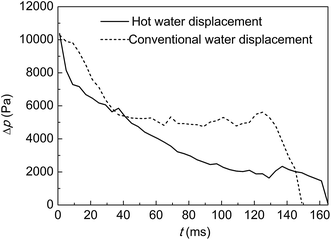 |
| | Fig. 6 Pressure drops across the pore–throat in the hot water and conventional water displacement processes for the oil-wet system. | |
In contrast, hot water flooding exhibited a higher oil recovery factor than conventional water flooding by 8% OOIP. Fig. 7 shows the distributions of residual oil and water in the pore when water broke through. The residual oil was mainly distributed in the pore wall in both hot water flooding and conventional water flooding. For the latter case, there was also some oil remaining in the left throat near the pore as well as on the right throat wall. In hot water flooding, the viscosity of oil reduced and the mobility of oil increased; thus, the sweep efficiency was higher, whereas in conventional water flooding, the removal of oil was difficult from the rock surface because of the high viscosity of the heavy oil.
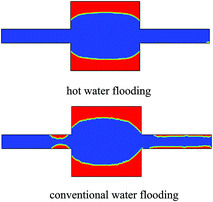 |
| | Fig. 7 Comparison between hot water flooding and conventional water flooding of the residual oil and water distributions after water broke through. | |
3.3 Oil-wet system
3.3.1 Effect of the water contact angle. For an oil-wet system, simulations were carried out for the cases with different water contact angles, namely, 110°, 135° and 150°. The original oil saturation was 50% and the oil phase adhered to the pore wall. Fig. 8 shows the distributions of the oil and water phases during the hot water displacement process with a water contact angle of 135°. With the injection of hot water, the water phase in the middle of the pore was first driven out, and then part of the oil was removed from the pore wall and driven out. At t = 170 ms, the water broke through and the residual oil could no longer be displaced out. All the oil in the throats and part of oil in the pore were displaced out. The final oil recovery factor was 47.66%.
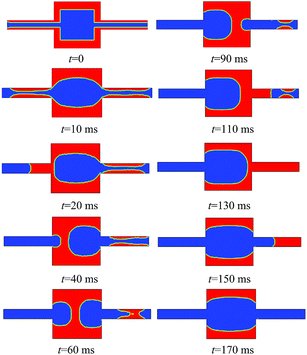 |
| | Fig. 8 Distributions of the oil and water phases in the hot water displacement process for the oil-wet system with a water contact angle of 135°. | |
When the temperature of hot water was increased to 150 °C in the oil-wet case with the same original oil saturation of 50%, the displacement process was similar. Moreover, the oil recovery factor increased to 57.07% from 47.67% at 100 °C, which was in accordance with the macro experimental results obtained by Jabbour et al.15 The phase distributions of oil and water when water broke through showed that the thickness of the residual oil film attached to the pore wall for 150 °C was smaller than that for 100 °C. The temperature of liquids in the pore for 150 °C was higher than that for 100 °C in the displacement process. Thus, in the case with hot water at 150 °C, the swept volume was larger because of the smaller oil viscosity and higher oil mobility.
The residual oil/water distributions and the oil recovery factors with different water contact angles are shown in Fig. 9 and 10, respectively. Both the volume and mass fractions of oil that was swept out are presented for the oil recovery factors. Because of the expansion of oil with the temperature increase, the mass fraction of oil recovered was slightly larger than the volume fraction. Overall, the oil recovery factors decreased with the increase in water contact angles for the oil-wet system. For the cases with water contact angles of 110° and 135°, the residual oil/water distributions were taken when water broke through at t = 166 ms and t = 170 ms, respectively. After water broke through, the residual oil could no longer be displaced out. The residual oil/water distributions were similar for the two cases, but one clear difference between them was the shape of the oil/water interface because of the different contact angles. All the oil in the throats and part of the oil in the pore were displaced out. The displacement processes for the two cases were similar, as can be seen in Fig. 8. The oil recovery factor for the case with the water contact angle of 135° was slightly lower than that for 110°. However, for the case with the water contact angle of 150°, the displacement process was quite different. The water passage in the middle of the pore was connected throughout the simulation time of 600 ms. The residual oil and water distributions were taken at t = 170 ms for comparison with the abovementioned two cases. Hot water flowed out of the pore along the water passage in the middle, and only part of the oil in the right throat was driven out. The oil attached to the pore wall was difficult to remove because of the high oil wettability in the case with the water contact angle of 150°. For this case, the oil recovery factor was as low as 8.76%.
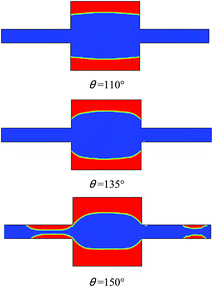 |
| | Fig. 9 Residual oil and water distributions for the oil-wet system with different water contact angles. | |
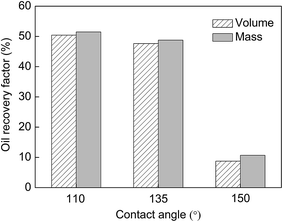 |
| | Fig. 10 Oil recovery factors of hot water displacements for the oil-wet system with different water contact angles. | |
3.3.2 Effect of the original oil saturations. The oil recovery factor is affected by the original oil saturation. For the oil-wet system, the oil film attached to the pore wall is thicker with a higher original oil saturation. Fig. 11 shows the oil recovery factors with different original oil saturations with the water contact angle of 135°. Overall, the oil recovery factors increased with the increase in the original oil saturations for the oil-wet system.
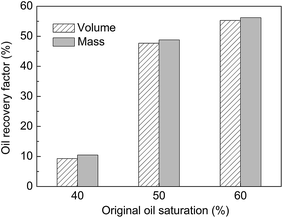 |
| | Fig. 11 Oil recovery factors of hot water displacements with different original oil saturations for the oil-wet system (θ = 135°). | |
The oil recovery factor was as low as about 10% when the original oil saturation was 40%, and when the original oil saturation increased from 40% to 50%, the recovery factor increased by more than 30% of OOIP. This can be explained from the different displacement processes of the two cases. In the case with the original oil saturation of 40%, a passage for the water phase formed quickly in the middle of the pore because of the large volume of the original water in the pore. Thus, the oil attached to the pore wall was difficult to be driven out and thus only the oil existing in right throat was driven out. However, the displacement process was different in the case with original oil saturation of 50%. Herein, the water in the middle of the pore was first driven out, then part of the oil was driven out and at last a water passage was formed. Therefore, more oil was displaced out in the case with original oil saturation of 50%. For the case with original oil saturation of 60%, the displacement process was similar to that of 50% case; thus, the oil recovery factor did not increase dramatically. The oil recovery factor was 55.31% in the case with original oil saturation of 60%, which was higher than the case of 50% by 7.64% of OOIP. This was because the original oil film attached to the pore wall was thicker for the case with 60% original oil saturation and the oil was thus easier to remove.
3.3.3 Effect of oil viscosity in an oil-wet system. In the investigation of the effect of oil viscosity on the hot water displacement in an oil-wet system, three oil viscosities were used: 0.5μoil, μoil and 2μoil. The number in front of the viscosity μoil refers to the multiple of the oil viscosity in Table 1. The original oil saturations were 50%. Fig. 12 shows the effects of oil viscosity on the residual oil/water distributions for an oil-wet system (θ = 135°). The oil recovery factors were 49.83%, 47.67%, and 37.96% for the three cases with oil viscosities of 0.5μoil, μoil and 2μoil, respectively. Overall, the oil recovery factors decreased with the increase of oil viscosities. As can be seen from Fig. 12, more oil was left on the pore wall after the breakthrough of hot water with the increase in oil viscosities, and a part of oil remained in the throats in the case with 2μoil. The oil attached to the pore wall was more difficult to be driven out with the increase in oil viscosities.
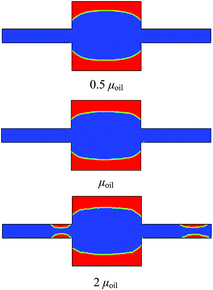 |
| | Fig. 12 Effects of oil viscosity on the residual oil/water distributions for the oil-wet system (θ = 135°). | |
3.4 Intermediate wet system
3.4.1 Effect of the initial oil/water distribution patterns. The initial oil/water distribution patterns are complex in the intermediate wet system. Cases with three initial oil/water distribution patterns, which are shown in Fig. 3, were simulated for the intermediate wet system. The distributions of oil and water during the hot water displacement process in the pore with different initial oil/water distribution patterns are shown in Fig. 13–15. The original oil saturation was 50% and the water contact angle was 90°.
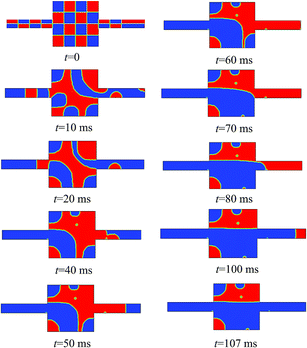 |
| | Fig. 13 Distributions of oil and water in the hot water displacement process for the intermediate wet system with the initial oil/water distribution pattern (a). | |
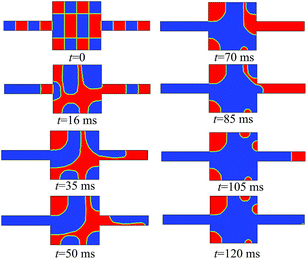 |
| | Fig. 14 Distributions of oil and water in the hot water displacement process for the intermediate wet system with the initial oil/water distribution pattern (b). | |
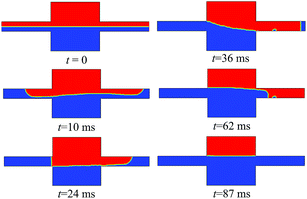 |
| | Fig. 15 Distributions of oil and water in the hot water displacement process for the intermediate wet system with the initial oil/water distribution pattern (c). | |
For the initial oil/water distribution pattern (a), the original fluids in the pore were heated, and the adjacent oil and water droplets were combined into large droplets with the injection of hot water. In the first stage, the combined water formed a passage in the right throat and the original water was displaced out of the pore. Then, a part of oil in the pore was displaced out. Finally, the water broke through at t = 107 ms, and the oil recovery factor was 47.73% of OOIP. A water passage was formed in the lower part of the pore with the combination of the local water droplets. Therefore, when the water broke through, the residual oil was mainly distributed in the upper part of the pore and was difficult to be displaced out any more. This is related to the combination of water and oil droplets, which is affected by several factors such as the sizes and distributions of droplets and oil viscosity. The oil recovery factor will be lower when the original oil saturation decreases. In the intermediate wet system, the size of the oil droplet may diminish or the number of oil droplets may decrease when the original oil saturation decreases, while the direct opposite is true for the water phase. Therefore, the combined oil clusters occupy a smaller volume than the water phase does in the pore. Moreover, a water passage could be easily formed, which is harmful to the oil displacement.
The initial oil/water distribution of pattern (b) was up-down symmetrical and the average droplet size was larger than for pattern (a). As can be seen in Fig. 14, the flow was up-down asymmetric and this may be because of a truncation error or numerical instability. In a real oil displacement, the flow may also be asymmetric because of small disturbances. Similarly, with the hot water injection, the adjacent oil and water droplets were combined into larger ones in the displacement process of pattern (b). The oil and water were displaced out of the pore alternately until the water broke through at t = 120 ms. Compared with the case of pattern (a), the residual oil distribution was relatively symmetrical in the upper and the lower part of the pore. The oil recovery factor was up to 67.35%, which was the highest in the three patterns. This was mainly because the larger oil droplets were distributed in the middle of the pore in pattern (b).
The initial oil/water distribution of pattern (c) was up-down asymmetric and the average droplet size was the largest of the three. As can be seen in Fig. 15, a water passage formed in the lower part of the pore, and only oil in the throats and in the middle of the pore was removed. The water broke through quickly at t = 87 ms, and the oil recovery factor was 42.98%, which was lower than patterns (a) and (b). Therefore, the initial oil/water distribution pattern played an important role in the oil/water flow, the residual oil/water distribution and in the oil recovery factor.
Cases with different water contact angles of 80°, 90° and 100° were simulated with the initial oil/water distribution patterns (a). As can be seen in Fig. 16, the residual oil/water distributions were similar for the three water contact angles. Moreover, the residual oil was mainly distributed in the upper part of the pore when water broke through. The oil recovery factors were 45.93%, 47.73% and 47.17% for the cases with water contact angles of 80°, 90° and 100°, respectively, which differed slightly.
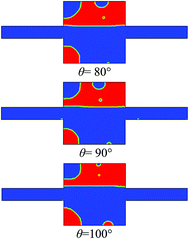 |
| | Fig. 16 Residual oil/water distributions when water broke through for the intermediate wet system (a) with different water contact angles. | |
3.4.2 Effect of oil viscosity in the intermediate wet system. In the investigation of the oil viscosity effect on the hot water displacement in a pore, two oil viscosities were used: μoil and 1.5μoil (1.5 times the oil viscosity in Table 1). Fig. 17 shows the effects of oil viscosity on the residual oil/water distributions for the intermediate wet system with different initial oil/water distribution patterns ((a), (b) and (c)). The changes of residual oil/water distributions were small for the three initial oil/water distribution patterns when the oil viscosity μoil increased to 1.5μoil. As can be seen in Table 2, the oil recovery factors for the cases with the initial patterns (b) and (c) decreased with the increase in oil viscosities, but the oil recovery factor increased for pattern (a). For the intermediate wet system, the initial oil/water distribution pattern played a more important role in oil/water flow, the residual oil/water distribution and the oil recovery factor, compared with the contact angle and oil viscosity.
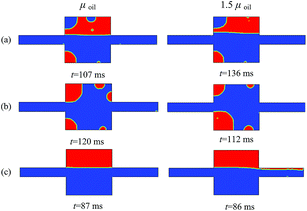 |
| | Fig. 17 Effects of oil viscosity on the residual oil/water distributions for the intermediate wet system with different initial oil/water distribution patterns (θ = 90°). | |
Table 2 Effects of oil viscosity on the oil recovery factors for the intermediate wet system with different initial oil/water distribution patterns
| Initial oil/water distribution patterns |
Oil recovery factors (%) |
| μoil |
1.5μoil |
| a |
47.73 |
52.22 |
| b |
67.35 |
65.18 |
| c |
42.98 |
38.67 |
3.5 Water-wet system
For the water-wet system, the simulations were carried out for the cases with different water contact angles of 20°, 45° and 60°. The initial oil/water distribution patterns used for the three cases were the same as those shown in Fig. 2. The original oil was in the middle of the pore with a saturation of 50%. Fig. 18 shows the distributions of the oil and water phases during the hot water displacement process for the water-wet system with a water contact angle of 45°. First, the original water in the right throat was displaced out. After t = 21 ms, the oil phase was displaced out of the pore continuously. At time t = 12 ms, all the original oil was driven out. In the other cases with the water contact angles of 20° and 60°, the original oil was also driven out completely. When the hot water was injected, the capillary force was the driving force for water flooding in the water-wet system. Therefore, in water-wet reservoirs, the original oil is easy to displace out and the oil recovery factor is relatively high.
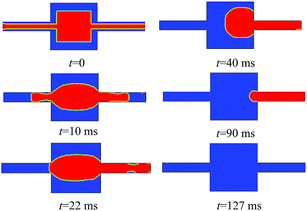 |
| | Fig. 18 Distributions of oil and water phases in the hot water displacement process for the water-wet system with the water contact angle of 45°. | |
4 Conclusions
The pore-scale behaviors of hot water displacement in a pore–throat microchannel were revealed by the VOF method for different wettability systems.
The processes involved in hot water flooding were different in different wetting conditions. For the oil-wet system, the original water phase was first driven out, then part of the oil was removed, and finally the water broke through. However, for the water-wet system, the oil phase was surrounded by water, and then all the oil could be driven out of the pore. For the intermediate wet system, the adjacent oil droplets and water droplets combined at first and then the oil and water phase were driven out alternately.
In the oil-wet system, the factors affecting hot water displacement were investigated. Overall, in the oil-wet system, the oil recovery factor increased with the increase in the original oil saturation and the hot water temperature, and decreased with the increase in the water contact angle and oil viscosity. The oil recovery factors were 9.32%, 47.67% and 55.31% for the original oil saturations of 40%, 50% and 60%, respectively. The oil recovery factors were 49.83%, 47.67%, and 37.96% for the three cases with oil viscosities of 0.5μoil, μoil and 2μoil, respectively.
For the intermediate wet system, three cases with different initial oil/water distribution patterns were simulated, taking into consideration the effects of the droplet size and symmetry. The results showed that the initial oil/water distribution patterns played a more important role in the oil/water two-phase flow, compared with the contact angle and oil viscosity. The oil recovery factors were 47.73%, 67.35%, and 42.98% for the initial oil/water distribution patterns (a), (b), and (c), respectively.
Acknowledgements
This study was supported by the National Natural Science Foundation of China under Number 90610021.
References
- S. M. Farouq Ali, J. Pet. Sci. Eng., 2003, 37, 5–9 CrossRef.
- C. Chu, J. Pet. Technol., 1985, 37, 1887–1902 CrossRef.
- E. Gomaa, J. Pet. Technol., 1980, 32, 325–332 CrossRef.
- B. Sharma, K. Santanu, S. Patil, V. Kamath and A. Dandekar, Regional/AAPG Pacific Section Joint Meeting, Anchorage, Alaska, USA, 2002 Search PubMed.
- P. Srivastava and L. Castro, SPE Middle East Oil and Gas Show and Conference, Manama, Bahrain, 2011 Search PubMed.
- W. L. Martin, J. N. Dew, M. L. Powers and H. B. Steves, J. Pet. Technol., 1968, 20, 739 CrossRef.
- Y. C. Cai, Y. J. Liu, X. F. Li, Y. Z. Li, X. L. Zhang, X. N. He and Q. Cheng, International Conference on Energy Engineering and Environmental Engineering, Hangzhou, China, 2013 Search PubMed.
- P. Y. Gai, F. H. Yin, T. T. Hao and Z. P. Zhang, 2nd International Conference on Chemical Engineering and Advanced Materials, Guangzhou, China, 2012 Search PubMed.
- J. C. Cassinat, M. C. Payette, D. B. Taylor and M. P. Cimolai, Improved Oil Recovery Symposium, Tulsa, Oklahoma, USA, 2002 Search PubMed.
- C. H. Wu, SPE California Regional Meeting, Bakersfield, California, USA, 1977 Search PubMed.
- L. D. Stewart and K. S. Udell, SPE Reservoir Eng., 1988, 3, 1233–1242 CrossRef CAS.
- T. B. Jensen, M. P. Sharma, H. G. Harris and D. L. Whitman, SPE/DOE Enhanced Oil Recovery Symposium, Tulsa, Oklahoma, USA, 1992 Search PubMed.
- S. G. Goodyear, C. B. Reynolds, P. H. Townsley and C. L. Woods, SPE/DOE Improved Oil Recovery Symposium, Tulsa, Oklahoma, USA, 1996 Search PubMed.
- I. S. Bousaid, SPE International Thermal Operations Symposium, Bakersfield, California, USA, 1991 Search PubMed.
- C. Jabbour, M. Quintrad, H. Betrin and M. Robin, J. Pet. Sci. Eng., 1996, 16, 109–130 CrossRef CAS.
- T. M. Okasha, H. K. Menouar and S. A. Abu-Khamsin, J. Can. Pet. Technol., 1998, 37, 33–40 CAS.
- A. Al-Shatti, M. Algharaib, R. Gharbi and A. Malallah, The Second International Conference on Thermal Engineering Theory and Applications, Al-Ain, UAE, 2006 Search PubMed.
- A. F. Alajmi, M. Algharaib and R. Gharbi, Technical Symposium of Saudi Arabia Section, Society of Petroleum Engineers, Dhahran, Saudi Arabia, 2006 Search PubMed.
- A. F. Alajmi, R. Gharbi and M. Algharaib, J. Pet. Sci. Eng., 2009, 66, 143–155 CrossRef CAS PubMed.
- A. F. Alajmi, R. Gharbi and M. Algharaib, J. Pet. Sci. Eng., 2014, 122, 524–533 CrossRef CAS PubMed.
- I. I. Kantorovich and E. Bar-Ziv, Fuel, 1999, 78, 279–299 CrossRef CAS.
- D. M. O'Carroll and B. E. Sleep, Transp. Porous Media, 2009, 79, 393–405 CrossRef.
- D. W. Zhao and I. D. Gates, Fuel, 2015, 153, 559–568 CrossRef CAS PubMed.
- G. Gamrat, M. Favre-Marinet and D. Asendrych, Int. J. Heat Mass Transfer, 2005, 48, 2943–2954 CrossRef CAS PubMed.
- S. Reynaud, F. Debray, J. P. Frans and T. Maitre, Int. J. Heat Mass Transfer, 2005, 48, 3197–3211 CrossRef PubMed.
- C. W. Hirt and B. D. Nichols, J. Comput. Phys., 1981, 39, 201–225 CrossRef.
- D. Goel and V. V. Buwa, Ind. Eng. Chem. Res., 2009, 48, 8109–8120 CrossRef CAS.
- D. Qian and A. Lawal, Chem. Eng. Sci., 2006, 61, 7609–7625 CrossRef CAS PubMed.
- L. Dai, W. Cai and F. Xin, Chem. Eng. Technol., 2009, 32, 1984–1991 CrossRef CAS PubMed.
- M. Huang, L. L. Wu and B. Chen, Numer. Heat Transfer, Part B, 2012, 61, 412–437 Search PubMed.
- J. U. Brackbill, D. B. Kothe and C. Zemach, J. Comput. Phys., 1992, 100, 335–354 CrossRef CAS.
- D. L. Youngs, in Numerical methods for fluid dynamics, Acdemic Press, New York, 1982 Search PubMed.
- W. J. Rider and D. B. Kothe, J. Comput. Phys., 1998, 141, 112–152 CrossRef.
- H. D. Beggs and J. R. Robinson, J. Pet. Technol., 1975, 27, 1140–1141 CrossRef.
- D. M. Wang, J. C. Cheng, H. F. Xia, Q. Li and J. P. Shi, SPE Asia Pacific Improved Oil Recovery Conference, Kuala Lumpur, Malaysia, 2001 Search PubMed.
- L. J. Zhang, X. A. Yue and F. Q. Guo, Pet. Sci., 2008, 5, 56–61 CrossRef.
|
| This journal is © The Royal Society of Chemistry 2015 |
Click here to see how this site uses Cookies. View our privacy policy here. 


 is the velocity vector, ρ is the volume-averaged density, p is the pressure, μ is the coefficient of kinetic viscosity,
  is the surface tension force per unit volume, T is the temperature, λ is the thermal conductivity and cp is the specific heat capacity. In the microscale condition, surface tension plays a dominant role in the two-phase flow system. The surface tension was thus predicted using the continuum surface force (CSF) model.31 The surface tension force per unit volume
  in eqn (2) is calculated as follows:
![[n with combining circumflex]](https://www.rsc.org/images/entities/i_char_006e_0302.gif) )
)
![[n with combining circumflex]](https://www.rsc.org/images/entities/i_char_006e_0302.gif) is the unit normal vector of the interface. The contact angle with the wall was used to adjust the unit normal vector of the interface (
is the unit normal vector of the interface. The contact angle with the wall was used to adjust the unit normal vector of the interface (![[n with combining circumflex]](https://www.rsc.org/images/entities/i_char_006e_0302.gif) ) in the cells near the wall. The surface normal at the live cell next to the wall is
) in the cells near the wall. The surface normal at the live cell next to the wall is![[n with combining circumflex]](https://www.rsc.org/images/entities/i_char_006e_0302.gif) =
= ![[n with combining circumflex]](https://www.rsc.org/images/entities/i_char_006e_0302.gif) w
w![[thin space (1/6-em)]](https://www.rsc.org/images/entities/char_2009.gif) cos
cos![[thin space (1/6-em)]](https://www.rsc.org/images/entities/char_2009.gif) θw +
θw + ![[t with combining circumflex]](https://www.rsc.org/images/entities/i_char_0074_0302.gif) w
w![[thin space (1/6-em)]](https://www.rsc.org/images/entities/char_2009.gif) sin
sin![[thin space (1/6-em)]](https://www.rsc.org/images/entities/char_2009.gif) θw
θw
![[n with combining circumflex]](https://www.rsc.org/images/entities/i_char_006e_0302.gif) w and
w and ![[t with combining circumflex]](https://www.rsc.org/images/entities/i_char_0074_0302.gif) w are the unit vectors normal and tangential to the wall, respectively.
w are the unit vectors normal and tangential to the wall, respectively.


![[thin space (1/6-em)]](https://www.rsc.org/images/entities/char_2009.gif) 160 quadrilateral cells in the model geometry. Convergence criteria were set at the beginning of computation. The residuals of continuity and velocity were less than 10−3, and the residual of energy was less than 10−6.
160 quadrilateral cells in the model geometry. Convergence criteria were set at the beginning of computation. The residuals of continuity and velocity were less than 10−3, and the residual of energy was less than 10−6.

![[thin space (1/6-em)]](https://www.rsc.org/images/entities/char_2009.gif) 160 and (d) 35
160 and (d) 35![[thin space (1/6-em)]](https://www.rsc.org/images/entities/char_2009.gif) 840.
840.


