A molecular dynamics study on thermal and mechanical properties of graphene–paraffin nanocomposites

Yu Wanga, Chunhui Yanga, Yuan Chengb and Yingyan Zhang*a
aSchool of Computing, Engineering and Mathematics, Western Sydney University, Locked Bag 1797, Sydney, NSW 2751, Australia. E-mail: yingyan.zhang@uws.edu.au; Fax: +61 2 47360833; Tel: +61 2 47360606
bInstitute of High Performance Computing, A*STAR, Singapore 138632

Received 22nd June 2015 , Accepted 18th September 2015

First published on 18th September 2015


Abstract

Owing to the superior thermal conductivity of graphene, nanocomposites with graphene fillers dispersed in a polymer matrix become promising in thermal management applications, e.g. serving as thermal interface materials (TIMs) in high power microelectronic devices. However, the thermal conductivity of graphene-based nanocomposites is constrained by the high interfacial thermal resistance between the graphene fillers and polymer matrix. This research focuses on changing graphene–paraffin interfacial thermal transport by employing various treatment methods. Using molecular dynamics (MD) simulations, the effectiveness of hydrogenation, defecting and doping on reducing the graphene–paraffin interfacial thermal resistance is closely investigated. We found that the interfacial thermal resistance can be considerably reduced by the hydrogenation of graphene, while it is insensitive to defecting and doping. From the simulation results of the graphene–paraffin nanocomposites under tensile loading, a lower Young’s modulus and lower tensile strength are observed for the paraffin filled with hydrogenated graphene. The results clearly show that the hydrogenation of graphene exerts opposite effects on the thermal and mechanical properties of graphene–paraffin nanocomposites. Thus hydrogenation is suggested to be used wisely in the graphene–paraffin nanocomposite so as to improve its interfacial thermal conductance at the minimum cost of its mechanical strength.

1. Introduction

Graphene is a single layer of carbon atoms arranged in a honeycomb-like hexagonal crystalline lattice.1 Over the past decade, enormous efforts have been devoted to graphene to explore its unique physical properties for engineering applications.2–6 Recently, its thermal properties have gained intensive attention from researchers around the world. In 2008, Balandin et al.7,8 discovered that the thermal conductivity of single layer graphene is in the range of 3080–5300 W m−1 K−1 from their nanoscale experiments. This extraordinary thermal conductivity makes graphene the best thermal conductor in the world. Numerous studies have thus been carried out to utilize graphene in thermal management applications, in particular for high power microelectronic devices. The most straightforward application is to use graphene as a filler in polymer matrices for synthesizing composite thermal interface materials (TIMs). It is expected that graphene-based composite TIMs should possess a significantly improved thermal conductivity. However, the reported thermal conductivity of these TIMs spreads from 1 to 7 W m−1 K−1, which is far below theoretical expectation.9–17 One of the main reasons for these unsatisfactory results is the high interfacial thermal resistance across the graphene–matrix interfaces.9–16 According to the effective medium theory, the interfacial thermal resistance between the filler and matrix is one of the key factors impeding the overall thermal conduction of these composite materials.18 Therefore, to develop new graphene-based composite TIMs with high performance, it is essential to find more appropriate and feasible techniques so as to effectively reduce the graphene–matrix interfacial thermal resistance.

Hydrogenation, defecting and doping are widely used in engineering the properties of graphene. Hydrogenation of graphene can be achieved by different processes. For example, Elias et al.19 found that hydrogenated graphene can be obtained by exposing graphene in low-pressure cold hydrogen plasma for 2 hours. Ryu et al.20 used an electron beam to initiate a reaction between hydrogen atoms and graphene to form hydrogenated graphene. Graphene grown using processes including chemical vapor deposition (CVD) and epitaxial growth is not perfect. Various types of defects such as single vacancy, double vacancy and Stone–Wales defects (SW) may be generated.21 In order to tailor the properties of graphene, defects can also be created intentionally.22 Doping of graphene involves the substitution of carbon atoms with other atoms of similar mass such as boron and nitrogen. It can be achieved by using CVD and electrothermal reactions.23,24 In the literature, abundant reports are available on the effects of hydrogenation, defecting and doping on the thermal properties of pristine graphene.25–29 However, their effects on the interfacial thermal transport properties in graphene–polymer composites have not been well understood. The high interfacial thermal resistance is one of the main barriers in developing advanced graphene-based composite TIMs. It is of great significance to understand how hydrogenation, defecting and doping modulate thermal transport across the interfaces between graphene and polymer.

In terms of the mechanical properties of graphene-based nanocomposites, extensive investigations have been carried out. It has been reported that the mechanical properties of polymers can be greatly improved by the addition of graphene fillers.30,31 For example, Rafiee et al.32 synthesized graphene–epoxy nanocomposites. They found that at a low filler weight fraction of 0.1%, the Young’s modulus and tensile strength of the nanocomposites could be remarkably enhanced by 31% and 40% over pristine epoxy, respectively. Zhao et al.33 fabricated nanocomposites based on exfoliated graphene sheets and poly(vinyl alcohol) (PVA). At a loading of 1.8 vol% graphene, they obtained a 150% improvement in tensile strength and a 10-fold increase in Young’s modulus over pure PVA. Based on previous studies, it is known that the presence of hydrogen leads to a remarkable reduction in the tensile strength and stiffness of graphene.34 However, how hydrogenation affects the overall mechanical properties of graphene-based composites still remains unknown. The reliable application of the graphene-based composite TIMs in a thermal environment also depends on the TIM’s mechanical integrity. It is thus of great importance to understand how the mechanical properties of the composites are influenced by various treatments such as hydrogenation.

In this paper, we investigate the thermal and mechanical properties of graphene–paraffin nanocomposites. Firstly, thermal transport across graphene–paraffin interfaces is investigated by using molecular dynamics (MD) simulations. The effectiveness of hydrogenation, defects and dopants in reducing the graphene–paraffin interfacial thermal resistance is systematically examined. Different coverages of hydrogen, defects and dopants (up to 4.17%) are considered. Secondly, using MD simulations, the mechanical properties of graphene–paraffin composites subjected to uniaxial tensile loading are investigated with the aim to explore the hydrogenation effect. The results reported herein can serve as a general guideline for future experimental studies on the design of graphene-based nanocomposites.

2. Computational methods

In this study, MD simulations were performed by using LAMMPS (large-scale atomic/molecular massive parallel simulator).35 In the simulation of the graphene–paraffin composites, the AIREBO potential was adopted to model the carbon and hydrogen atoms in graphene and hydrogenated graphene.36 The Tersoff potential was used to simulate the dopant atoms (i.e. boron and nitrogen) and their interactions with the carbon atoms in graphene.37,38 The polymer consistent force field (PCFF) was used to simulate the paraffin.39,40 The interactions between paraffin and graphene (or modified graphene) are van der Waals (vdW) interactions, which were described by the Lennard-Jones potential.

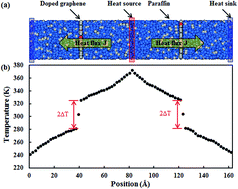
The reverse non-equilibrium molecular dynamics (RNEMD) simulation method based on Muller-Plathe’s approach41 was employed to investigate the thermal transport properties of the graphene–paraffin composites. In the present study, paraffin (C30H62) was chosen as the matrix material since it has been used as a thermal interface material in the thermal management of electronic devices.42,43 The paraffin blocks were initially built in Material Studio (Accelrys Inc., San Diego, CA) using the amorphous cell module, which generates disordered systems containing paraffin molecules in realistic equilibrium conformations. The paraffin blocks were then stacked with graphene sheets to form composites as shown in Fig. 1a. The composite has a size of 29 Å × 29 Å × 160 Å. Periodic boundary conditions were applied in all three directions. A small time step of 0.25 fs was used in the simulations. At the beginning of a simulation, an energy minimization was performed using the conjugate gradient algorithm. Then the composite model was annealed in a canonical NVT ensemble (i.e. a constant number of atoms, volume and temperature) for 500 ps with the temperature increasing from 300 K to 1000 K, and then cooling down to 300 K. Finally, the composite model was relaxed in an isothermal–isobaric NPT ensemble (i.e. a constant number of atoms, pressure and temperature) at 300 K and 1 atm for 500 ps. In the RNEMD simulation, a heat flux was imposed on an atomic system to form a temperature gradient. As shown in Fig. 1a, the heat source and sink regions are located in the middle and at the two ends of the composite model, respectively. A heat flux J was imposed between the heat source and sink regions by exchanging the kinetic energies between the hottest atom in the heat sink region and the coldest atom in the heat source region in a microcanonical NVE ensemble (i.e. a constant number of atoms, volume and energy). The exchange process was performed every 1000 time steps. The resultant heat flux J is given by

 
image file: c5ra12028d-t1.tif(1)
where ttransfer is the summation time, Ntransfer is the number of exchange, A is the cross-sectional area, and subscripts h and c refer to the hottest and coldest atoms of which the kinetic energies are interchanged. Once a steady state is reached, a stable temperature gradient between the heat source and sink regions can be established (see Fig. 1b). Due to the presence of the graphene–paraffin interface, there exists a temperature jump ΔT at the interface. The graphene–paraffin interfacial thermal resistance RK is then calculated by
 
RK = ΔT/J (2)


image file: c5ra12028d-f1.tif
Fig. 1 (a) Composite composed of paraffin and doped graphene in a RNEMD simulation (grey balls are carbon atoms, blue balls are hydrogen atoms and red balls refer to dopant atoms); and (b) resultant temperature gradient along the length of the composite.

By averaging the data collected over a 500 ps period in the steady state, the final interfacial thermal resistance value was determined. The error bars were then calculated using the block averaging approach.44

The mechanical properties of the graphene–paraffin composites were explored by adopting a MD simulation method similar to that used by Frankland et al.45 As shown in Fig. 2, a composite model consisting of a graphene sheet sandwiched in a paraffin matrix was designed with a size of 29 Å × 29 Å × 80 Å. The armchair and zigzag edges of the graphene are orientated along the X and Y axes, respectively. Prior to the tensile loading, the composite model was relaxed similarly to the model described above. A tensile loading with a strain rate of 0.0005 ps−1 is applied in the X (armchair) direction as shown in Fig. 2. Based on the obtained stress–strain curves, the Young’s modulus and tensile strength can be obtained. The Young’s modulus was calculated as the initial slope of the stress–strain curve and the tensile strength was defined at the point where the peak stress is reached.


image file: c5ra12028d-f2.tif
Fig. 2 Composite composed of paraffin and graphene under tension (grey balls are carbon atoms and blue balls are hydrogen atoms).

3. Results and discussion

3.1. Thermal transport across graphene–paraffin interfaces

First of all, MD simulations were performed on pure paraffin in order to validate the computational model. The thermal conductivity was determined by using the Fourier law as λ = J/(∂T/∂x), where ∂T/∂x is the temperature gradient along the heat flux direction. Based on a paraffin block with a size of 29 Å × 29 Å × 74 Å and a density of 0.887 g cm−3, the thermal conductivity of pure paraffin was obtained as 0.309 ± 0.014 W m−1 K−1. This value is in good agreement with 0.220–0.345 W m−1 K−1 obtained from simulations and experimental measurements in the literature.46,47

MD simulations were then performed to obtain the interfacial thermal resistance between paraffin and pristine graphene as a benchmark. A pristine graphene model with a planar size of 29 Å × 29 Å was placed into the paraffin blocks in Fig. 1a to construct the composite system. Based on eqn (2), the interfacial thermal resistance between paraffin and pristine graphene was calculated as RK0 = 0.669 ± 0.043 × 10⁻⁸ m2 K W−1. This value is in good agreement with 0.666–0.909 × 10⁻⁸ m2 K W−1 as obtained by other researchers.46,48,49 In the following, RK0 was used as a reference to check the effect of hydrogenation on the interfacial thermal resistance between paraffin and hydrogenated graphene, denoted as RK.

The hydrogen atoms were randomly distributed onto both sides of the graphene sheet and the H-coverage varied from 0.60% to 4.17%. The H-coverage is defined as the number of hydrogen atoms divided by the total number of carbon atoms in the graphene. Comparing the results with the interfacial thermal resistance between paraffin and pristine graphene RK0, relative interfacial thermal resistance RK/RK0 with respect to the H-coverage is illustrated in Fig. 3. It clearly shows that hydrogenation of graphene leads to a reduction of graphene–paraffin interfacial thermal resistance and this reduction increases with higher H-coverage. For example, with a 4.17% H-coverage, the interfacial thermal resistance between graphene and paraffin is reduced significantly by 11.6%.


image file: c5ra12028d-f3.tif
Fig. 3 Variation of the relative interfacial thermal resistance with respect to the H-coverage.

According to the theoretical models of interfacial thermal transport,50 the interfacial thermal resistance is inherently limited by the overlap of the vibrational density of states (VDOS) of the two interfacing materials. In order to elucidate the underlying mechanisms for the effect of hydrogenation on the interfacial thermal resistance, the VDOS for paraffin, pristine graphene and hydrogenated graphene were calculated and displayed in Fig. 4. The VDOS were obtained by calculating the Fourier transformation of atomic velocities autocorrelation functions at an equilibrium state before the heat conduction starts. As shown in Fig. 4, the VDOS of pristine graphene displays peaks at about 53 THz and 10 to 18 THz, which is consistent with the results obtained by other researchers.46,51 The peaks at 53 THz and 10–18 THz represent the in-plane and out-of-plane phonon modes, respectively. The VDOS of paraffin displays several peaks at about 88 THz and 20 to 45 THz. The peak at 88 THz corresponds to the VDOS for optical phonons assigned to carbon–hydrogen (C–H) stretching vibrations. The peaks at 20 to 45 THz are presumably due to H–C–H bending and C–C stretching vibrations. Comparing the VDOS of paraffin to that of pristine graphene, it is readily seen that they have a poor VDOS overlap with each other. This poor VDOS overlap indicates a poor heat conduction between them, which leads to the high interfacial thermal resistance between paraffin and graphene, which is consistent with the previous studies.46,49,51 When the graphene is functionalized by hydrogen atoms, two extra VDOS peaks at about 49 THz and 87 THz appear, which can be due to the in-plane C–C stretching and out-of-plane C–H stretching vibrations, respectively (see Fig. 4). The peak at 49 THz does not overlap with the peaks of paraffin, so it may not be beneficial to the enhancement of interfacial thermal transport. However, the peak at 87 THz has a better overlap with the peak of paraffin at 88 THz, which could explain the hydrogenation-induced reduction of the graphene–paraffin interfacial thermal resistance, as seen in Fig. 3.


image file: c5ra12028d-f4.tif
Fig. 4 VDOS of paraffin, pristine and hydrogenated graphene.

Next, the effects of defecting and doping on the thermal transport across the graphene–paraffin interfaces were investigated. Using the pristine graphene–paraffin interfacial thermal resistance as a reference, the effects of defecting and doping were studied through simulating the defective graphene and doped graphene in the composite system, respectively. The defects include single vacancy, double vacancy and SW. Boron and nitrogen were used as the dopants. The defects or dopants were randomly distributed in the graphene with different coverages up to 4.17%. Fig. 5 shows defective and doped graphene models with single vacancy defects, double vacancy defects, SW defects and dopants. The defective and doped graphene models were then placed into the composite systems depicted in Fig. 1a to carry out RNEMD simulations.


image file: c5ra12028d-f5.tif
Fig. 5 MD models of graphene with (a) single vacancy defects, (b) double vacancy defects, (c) SW defects and (d) dopants (grey and blue balls are carbon atoms, and red balls refer to dopant atoms).

The relative interfacial thermal resistance RK/RK0 with respect to the coverage of defects and dopants is plotted in Fig. 6 and 7, respectively. It can be seen that the interfacial thermal resistance remains unchanged as the coverage of defects or dopants increases to 4.17%, which indicates that the graphene–paraffin interfacial thermal transport is insensitive to these structural modifications.


image file: c5ra12028d-f6.tif
Fig. 6 Variation of the relative interfacial thermal resistance with respect to the coverage of different defects.

image file: c5ra12028d-f7.tif
Fig. 7 Variation of the relative interfacial thermal resistance with respect to the coverage of boron and nitrogen dopants.

The VDOS for the defective and doped graphene at a coverage of 4.17% were calculated and shown in Fig. 8 and 9, respectively. It can be seen that the various types of defects or dopants weaken the VDOS peaks of graphene at both low and high frequency ranges. These results agree with the observations reported in previous works on defective and doped graphene.27–29 It has been suggested that both defects and dopants in graphene cause phonon scattering, which leads to the weakening of the VDOS peaks. However, in the context of this work, these modifications to the VDOS peaks of graphene have nearly no effect on their overlaps with the VDOS of paraffin. As a result, the graphene–paraffin interfacial thermal resistance was found to be insensitive to defects and dopants.


image file: c5ra12028d-f8.tif
Fig. 8 VDOS of paraffin, pristine and defective graphene.

image file: c5ra12028d-f9.tif
Fig. 9 VDOS of paraffin, pristine and doped graphene.

3.2. Mechanical properties of graphene–paraffin composites

The mechanical properties of graphene–paraffin composites were investigated considering two types of composites – paraffin filled with pristine graphene and hydrogenated graphene. The hydrogenated graphene has a randomly distributed H-coverage of 4.17%. The paraffin interacts with the pristine graphene or hydrogenated graphene via non-bonded vdW interactions. The obtained stress–strain curves of the composites are plotted in Fig. 10. The stress–strain curve of the pure paraffin is included for easy reference. It is clearly shown in Fig. 10 that the mechanical properties of graphene–paraffin composites are distinct from those of the pure paraffin. The composites consisting of paraffin and pristine graphene have a high Young’s modulus of 26.7 GPa. At the critical strain of 0.137, the tensile strength reaches its peak with the value of 2.85 GPa. A 4.17% hydrogenated graphene leads to ∼9% and ∼21% deteriorations in the Young’s modulus and tensile strength of the graphene–paraffin composites, respectively. It is well known that hydrogenation of graphene triggers the transition of strong sp2 bonds to weaker sp3 bonds.34 In this case, since the graphene bears the majority of the stress in the composite before it ruptures, the observed deterioration in Young’s modulus and ultimate tensile strength can also be attributed to the formation of sp3 bonds induced by the hydrogenation. Fig. 11 displays the tensile deformation processes of the graphene–paraffin composites at different strain levels. The composite remains intact before the critical/breaking strain (Fig. 11c and f). Shortly after, rupture of the graphene occurs and the composite fails (Fig. 11d and g).
image file: c5ra12028d-f10.tif
Fig. 10 Stress–strain curves of graphene–paraffin composites.

image file: c5ra12028d-f11.tif
Fig. 11 Deformation evolutions of graphene–paraffin composites at different tensile strain levels.

4. Conclusions

Herein intensive MD simulations have been performed to investigate thermal transport across graphene–paraffin interfaces and the tensile strength of graphene–paraffin composites. Based on the obtained results, it has been found that hydrogenation of graphene leads to a reduction of the graphene–paraffin interfacial thermal resistance and this reduction is proportional to the coverage of hydrogen atoms. Various types of defects and dopants up to the coverage of 4.17% have been found to have a negligible influence on the graphene–paraffin interfacial thermal transport. The effects of various treatments on the interfacial thermal transport are explained by analysing the VDOS of the interfacing materials. The presence of hydrogen atoms facilitates better overlaps between the VDOS peaks of graphene and paraffin and a better heat transport between them which results in a lower interfacial thermal resistance. Defects and dopants weaken the VDOS peaks of graphene, but do not affect their overlaps with that of paraffin, and thus do not affect the interfacial thermal resistance. As for the mechanical properties of graphene–paraffin nanocomposites, it has been found that the nanocomposite of paraffin and graphene possesses a high Young’s modulus of 26.7 GPa and an ultimate tensile strength of 2.85 GPa. Hydrogenation of graphene deteriorates the Young’s modulus and tensile strength of the composites. These research findings provide an exciting insight into the interfacial thermal transport behaviour and mechanical properties of graphene–paraffin nanocomposites, and shed more light on the future development of graphene-based composites for practical thermal applications.

Acknowledgements

Y. Wang acknowledges financial support for his PhD study from the Australian Government via the Australian Postgraduate Awards Scheme. The computational support provided by Intersect Australia Ltd (INTERSECT) and National Computing Infrastructure (NCI) is gratefully acknowledged.

Notes and references

  1. A. K. Geim and K. S. Novoselov, Nat. Mater., 2007, 6, 183–191 CrossRef CAS PubMed .
  2. K. I. Bolotin, K. J. Sikes, Z. Jiang, M. Klima, G. Fudenberg, J. Hone, P. Kim and H. L. Stormer, Solid State Commun., 2008, 146, 351–355 CrossRef CAS .
  3. K. S. Novoselov, A. K. Geim, S. V. Morozov, D. Jiang, Y. Zhang, S. V. Dubonos, I. V. Grigorieva and A. A. Firsov, Science, 2004, 306, 666–669 CrossRef CAS PubMed .
  4. C. Lee, X. Wei, J. W. Kysar and J. Hone, Science, 2008, 321, 385–388 CrossRef CAS PubMed .
  5. F. Scarpa, S. Adhikari and A. Srikantha Phani, Nanotechnology, 2009, 20, 065709 CrossRef CAS PubMed .
  6. R. R. Nair, P. Blake, A. N. Grigorenko, K. S. Novoselov, T. J. Booth, T. Stauber, N. M. Peres and A. K. Geim, Science, 2008, 320, 1308 CrossRef CAS PubMed .
  7. A. A. Balandin, S. Ghosh, W. Bao, I. Calizo, D. Teweldebrhan, F. Miao and C. N. Lau, Nano Lett., 2008, 8, 902–907 CrossRef CAS PubMed .
  8. S. Ghosh, I. Calizo, D. Teweldebrhan, E. P. Pokatilov, D. L. Nika, A. A. Balandin, W. Bao, F. Miao and C. N. Lau, Appl. Phys. Lett., 2008, 92, 151911 CrossRef .
  9. K. M. F. Shahil and A. A. Balandin, Nano Lett., 2012, 12, 861–867 CrossRef CAS PubMed .
  10. A. P. Yu, P. Ramesh, M. E. Itkis, E. Bekyarova and R. C. Haddon, J. Phys. Chem. C, 2007, 111, 7565–7569 CrossRef CAS .
  11. W. Guo and G. Chen, J. Appl. Polym. Sci., 2014, 131, 40565 Search PubMed .
  12. P. Ding, S. Su, N. Song, S. Tang, Y. Liu and L. Shi, RSC Adv., 2014, 4, 18782–18791 RSC .
  13. W. Yu, H. Q. Xie, L. F. Chen, Z. G. Zhu, J. C. Zhao and Z. H. Zhang, Phys. Lett. A, 2014, 378, 207–211 CrossRef CAS .
  14. K. Chu, W. S. Li and H. Dong, Appl. Phys. A: Mater. Sci. Process., 2013, 111, 221–225 CrossRef CAS .
  15. A. P. Yu, P. Ramesh, X. B. Sun, E. Bekyarova, M. E. Itkis and R. C. Haddon, Adv. Mater., 2008, 20, 4740–4744 CrossRef CAS .
  16. S. Y. Yang, W. N. Lin, Y. L. Huang, H. W. Tien, J. Y. Wang, C. C. M. Ma, S. M. Li and Y. S. Wang, Carbon, 2011, 49, 793–803 CrossRef CAS .
  17. X. Pu, H. B. Zhang, X. F. Li, C. X. Gui and Z. Z. Yu, RSC Adv., 2014, 4, 15297–15303 RSC .
  18. C. W. Nan, R. Birringer, D. R. Clarke and H. Gleiter, J. Appl. Phys., 1997, 81, 6692–6699 CrossRef CAS .
  19. D. C. Elias, R. R. Nair, T. M. Mohiuddin, S. V. Morozov, P. Blake, M. P. Halsall, A. C. Ferrari, D. W. Boukhvalov, M. I. Katsnelson, A. K. Geim and K. S. Novoselov, Science, 2009, 323, 610–613 CrossRef CAS PubMed .
  20. S. Ryu, M. Y. Han, J. Maultzsch, T. F. Heinz, P. Kim, M. L. Steigerwald and L. E. Brus, Nano Lett., 2008, 8, 4597–4602 CrossRef CAS PubMed .
  21. F. Banhart, J. Kotakoski and A. V. Krasheninnikov, ACS Nano, 2011, 5, 26–41 CrossRef CAS PubMed .
  22. M. T. Lusk and L. D. Carr, Phys. Rev. Lett., 2008, 100, 175503 CrossRef PubMed .
  23. D. Wei, Y. Liu, Y. Wang, H. Zhang, L. Huang and G. Yu, Nano Lett., 2009, 9, 1752–1758 CrossRef CAS PubMed .
  24. X. Wang, X. Li, L. Zhang, Y. Yoon, P. K. Weber, H. Wang, J. Guo and H. Dai, Science, 2009, 324, 768–771 CrossRef CAS PubMed .
  25. Q. X. Pei, Z. D. Sha and Y. W. Zhang, Carbon, 2011, 49, 4752–4759 CrossRef CAS .
  26. Y. Y. Zhang, Y. Cheng, Q. X. Pei, C. M. Wang and Y. Xiang, Phys. Lett. A, 2012, 376, 3668–3672 CrossRef CAS .
  27. B. Mortazavi and S. Ahzi, Carbon, 2013, 63, 460–470 CrossRef CAS .
  28. B. Mortazavi and S. Ahzi, Solid State Commun., 2012, 152, 1503–1507 CrossRef CAS .
  29. B. Mortazavi, A. Rajabpour, S. Ahzi, Y. Rmond and S. Mehdi Vaez Allaei, Solid State Commun., 2012, 152, 261–264 CrossRef CAS .
  30. T. Kuilla, S. Bhadra, D. H. Yao, N. H. Kim, S. Bose and J. H. Lee, Prog. Polym. Sci., 2010, 35, 1350–1375 CrossRef CAS .
  31. J. R. Potts, D. R. Dreyer, C. W. Bielawski and R. S. Ruoff, Polymer, 2011, 52, 5–25 CrossRef CAS .
  32. M. A. Rafiee, J. Rafiee, Z. Wang, H. Song, Z. Z. Yu and N. Koratkar, ACS Nano, 2009, 3, 3884–3890 CrossRef CAS PubMed .
  33. X. Zhao, Q. Zhang, D. Chen and P. Lu, Macromolecules, 2010, 43, 2357–2363 CrossRef CAS .
  34. Q. X. Pei, Y. W. Zhang and V. B. Shenoy, Carbon, 2010, 48, 898–904 CrossRef CAS .
  35. S. Plimpton, J. Comput. Phys., 1995, 117, 1–19 CrossRef CAS .
  36. D. W. Brenner, O. A. Shenderova, J. A. Harrison, S. J. Stuart, B. Ni and S. B. Sinnott, J. Phys.: Condens. Matter, 2002, 14, 783–802 CrossRef CAS .
  37. J. Tersoff, Phys. Rev. B: Condens. Matter Mater. Phys., 1989, 39, 5566–5568 CrossRef .
  38. K. Matsunaga, C. Fisher and H. Matsubara, Jpn. J. Appl. Phys., 2000, 39, L48–L51 CrossRef CAS .
  39. H. Sun, Macromolecules, 1993, 26, 5924–5936 CrossRef CAS .
  40. H. Sun, S. J. Mumby, J. R. Maple and A. T. Hagler, J. Am. Chem. Soc., 1994, 116, 2978–2987 CrossRef CAS .
  41. F. Muller-Plathe, J. Chem. Phys., 1997, 106, 6082–6085 CrossRef .
  42. P. Goli, S. Legedza, A. Dhar, R. Salgado, J. Renteria and A. A. Balandin, J. Power Sources, 2014, 248, 37–43 CrossRef CAS .
  43. R. J. Warzoha and A. S. Fleischer, Int. J. Heat Mass Transfer, 2014, 79, 314–323 CrossRef CAS .
  44. T. D. Romo and A. Grossfield, J. Chem. Theory Comput., 2011, 7, 2464–2472 CrossRef CAS PubMed .
  45. S. J. V. Frankland, V. M. Harik, G. M. Odegard, D. W. Brenner and T. S. Gates, Compos. Sci. Technol., 2003, 63, 1655–1661 CrossRef CAS .
  46. T. F. Luo and J. R. Lloyd, Adv. Funct. Mater., 2012, 22, 2495–2502 CrossRef CAS .
  47. A. Sari and A. Karaipekli, Appl. Therm. Eng., 2007, 27, 1271–1277 CrossRef CAS .
  48. Y. Liu, J. S. Huang, B. Yang, B. G. Sumpter and R. Qiao, Carbon, 2014, 75, 169–177 CrossRef CAS .
  49. L. Hu, T. Desai and P. Keblinski, Phys. Rev. B: Condens. Matter Mater. Phys., 2011, 83, 195423 CrossRef .
  50. E. Swartz and R. Pohl, Rev. Mod. Phys., 1989, 61, 605–668 CrossRef .
  51. S. Lin and M. J. Buehler, Nanotechnology, 2013, 24, 165702 CrossRef PubMed .

This journal is © The Royal Society of Chemistry 2015
Click here to see how this site uses Cookies. View our privacy policy here.