Anode hydrodynamics in bioelectrochemical systems

Albert Vilà-Rovira, Sebastià Puig*, M. Dolors Balaguer and Jesús Colprim
LEQUiA, Institute of the Environment, University of Girona, Campus Montilivi, E-17071 Girona, Catalonia, Spain. E-mail: sebastia@lequia.udg.cat; Fax: +34 972418150; Tel: +34 972418281

Received 22nd June 2015 , Accepted 7th September 2015

First published on 7th September 2015


Abstract

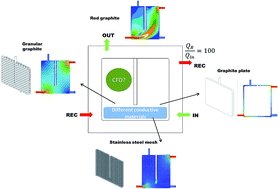
This study assesses the hydrodynamics in the anode compartment of a bioelectrochemical system (BES) when using different electrode materials (graphite rod, granular graphite, stainless steel mesh or graphite plate). For this purpose, computational fluid dynamics (CFDs) modelling was used. Granular graphite or stainless steel mesh allowed a better water flow distribution through the system favouring biomass attachment and consequently, removal efficiency and electricity production. This study provides the necessary mechanistic understanding on how these materials affect the hydrodynamics and substrate distribution behaviour within the bioanodes and electricity production.

1. Introduction

Bioelectrochemical systems (BES) are a sustainable technology used in groundwater1 and wastewater2 treatments. A wide range of products, such as methane,3 acetate,4 butyrate,5 and hydrogen6 can also be produced from contaminated water or polluted gaseous streams using BES. The performance of BES is influenced by many factors such as: substrate characteristics and availability,7 microbial community,8 electrode characteristics9 and reactor design,10 among others. Some of these key factors are directly linked to the hydrodynamics inside the BES.

Computational Fluid Dynamics (CFD) modelling uses numerical methods and algorithms to analyse fluid flows. CFD is a powerful tool for investigating fluid flow by computer software and it complements the limitations of field and laboratory experiments with minimal cost. CFD are widely used to optimise processes and equipment's design in wastewater treatment plants11 such as: aeration systems operation,12 membrane reactor designs,13 anaerobic digesters performance,14 mass transfer in airlift reactors15 or reaction parameters in packed bed reactors.16 The use of CFD could be also a powerful tool in BES to optimise scaling-up BES design or select the suitable electrode material, among others. Unfortunately, CFDs have been hardly applied to BES. Recently, Kim et al.,17 investigated for the first time the fluid flow and estimated the electricity generation in the anodes of 12 different BES configurations with different internal structures (shape-triangular and rectangular type-, number, length, and angle).17 Michie et al.,18 (2014) applied CFD modelling within three novel helical geometries anodes within an anodic BES chamber. They linked COD (Chemical Oxygen Demand) removal and power production to the fluid flow distribution.

One of the key parameters in designing BES is the identification of suitable conductive materials to ensure proper electron transfer distribution and an appropriate surface for biofilm attachment.19 In the current state of the art, anode configurations are mainly composed of graphite-based electrode collectors and additional conductive material which favours biomass attachment.19 Since a plethora of conductive materials have been reported in literature (graphite rod, granular graphite, carbon felt, among others),20,21 it is necessary to gain a mechanistic insight on how these materials affects the hydrodynamic behaviour, and consequently the substrate distribution, within the bioanodes. Up to date, further research on fluid distribution and hydrodynamics within the anode compartment in common anode electrodes is still missing. This study determines the fluid flow and substrate distributions in the anode compartments of different conductive materials (graphite rod, granular graphite, stainless steel mesh and graphite plate) commonly used in the literature.

2. Materials and methods

2.1 Bioelectrochemical system

The BES considered for the modelling was a rectangular methacrylate reactor,22 with a squared internal chamber of 200 mm × 200 mm × 10 mm (Fig. 1). It consisted of an anode and a cathode chambers separated by a cation exchange membrane (CEM, Nafion 117, DuPont, USA). Both anode and cathode chambers contained a graphite rod as collector electrodes (107 × 6 mm [anode] and 130 × 6 mm [cathode], Sofacel, Spain). The cathode chamber was filled with granular graphite (model 00514, EnViro-cell, Germany). This design was successfully applied for treating contaminated groundwater.23
image file: c5ra11995b-f1.tif
Fig. 1 Representation of the reactor design: (a) reactor flowchart and the selected planes for results plotting (x1, x2 and x3), (b) different electrode materials used: graphite rod (Case 1), granular graphite (Case 2), stainless steel (Case 3) and graphite plate (Case 4). Rin and Rout represented inlet and outlet recirculation's streams, respectively.

Fig. 1 shows a scheme of each anode compartment configuration (Fig. 1A) and the different additional conductive material assessed (Fig. 1B). Four different anode electrodes were considered for evaluating the anode hydrodynamics, as they have been widely reported in the literature. Table 1 presents the main characteristics of the materials assessed, which were:

Table 1 Comparison of the ratio between electrode surface and liquid volume, void fraction, hydraulic retention time, power generation, columbic efficiency, and methane production for each case studied
Case Electrode material Characteristic size Distribution
1 Graphite rod (control) ϕ = 10 mm height = 17, 5 cm Centre
2 Graphite rod plus granular graphite ϕgranule particle = 9 mm Two layers of spheres separated 3 mm each other separation between spheres 11 mm (centre to centre)
3 Graphite rod plus stainless steel mesh ϕmesh = 1 mm Three layers of mesh, separated 4 mm each other mesh light path: 5 mm × 5 mm
4 Graphite plate 180 × 180 × 10 mm  


- Case 1: graphite rod (as the control and the collector electrode).

- Case 2: graphite rod (collector electrode) plus granular graphite particles filling the total anode chamber domain.

- Case 3: graphite rod plus stainless steel meshes (three different meshes separated by 4 mm).

- Case 4: graphite plate.

The anode compartment was fed with 1.5 L per day of an enriched acetate medium (containing 500 mg L−1 of acetate). A recirculation loop ratio of 1[thin space (1/6-em)]:[thin space (1/6-em)]100 was applied to homogenise the anode compartment. The operating temperature and pressure were kept at 293.15 K and 101[thin space (1/6-em)]325 Pa, respectively.

2.2 Computational fluid dynamics modelling

The fluid hydrodynamics were modelled using Ansys Fluent platform (ANSYS® Academic Research, Release 12.1). The momentum, continuity and energy equations were resolved for each case (Section S1; eqn (S1)–(S4)). The low velocities streams of made feasible to work in a laminar state. Proprieties values of aqueous solution were considered at 298.15 K and 101[thin space (1/6-em)]325 Pa. Gravity forces were also accounted within the simulations. To solve the hydrodynamic equations, velocity inlet boundary conditions were set for the inlet and outlet streams and recirculation loop streams (inlet and outlet), adapting in each case the velocities magnitudes and directions. All of them were fixed as a constant flux: the recirculation streams were fixed at 80 m h−1 (150 L per day) and the inlet/outlet streams at 0.80 m h−1 (1.5 L per day). Wall boundary conditions were set for the collector graphite rod electrode and the anode walls, as well for the rest of the electrode materials (granular graphite, stainless steel and graphite plate). All these wall boundary conditions were defined as non-slip. The low water permeability through biofilm made the water velocity negligible.24 The planes were defined as a middle section of anode chamber (Fig. 1A – x1), the section between those two planes (Fig. 1A – x2) and near the anode wall (membrane) (Fig. 1A – x3). The experimental low Reynolds number (Fig. S1) resulted in a laminar flow, which is characterised by smooth and constant fluid motion.

2.3 Biological model

A simplification of the biological model proposed by Pinto et al.,25 was considered for acetate oxidation in the anode compartment. The biological model proposed two main microbial populations (anodophilic and methanogenic) competing for a common substrate (acetate). The kinetic equations are presented within the ESI (Section S2). The concentrations of these microorganisms within the anode compartment were considered to be constant at steady state run, and homogeneous through overall anode domain; and fixed at 500 mg CODx L−1 and 250 mg CODx L−1, respectively, as assumed by Pinto et al.25 Acetate concentration was introduced as solubilised specie within aqueous solution. The acetate biological consumption was introduced as source term in the mass conservation equation (eqn (S1), Sm term), by means of user defined functions. The anode was fed with an influent acetate concentration of 500 mg L−1. Void fraction calculated as NAC/TAN (Net Anode volume Compartment/Total Anode volume Compartment). Current generation and methane production rates were calculated according to eqn (S9) and (S10).

Power generation was calculated using eqn (1):19

 
image file: c5ra11995b-t1.tif(1)
where maximum specific growth rate (μmax) was fixed at 8.3 per day, cell yield (YX/C) of 4.1 × 10³ cells per mol-Ac, bes of 8 mol e per mol-Ac, being F the Faraday's constant (C mol−1), CE the coulombic efficiency (−) and E the redox potential (V), and X is the fraction of anode surface occupied by the cell biofilm. CE (eqn (2)) was calculated as:19
 
image file: c5ra11995b-t2.tif(2)

From which q is the inlet flow (L s−1) and ΔCOD is the total substrate removal (mg COD L−1).

Shear rate ([small gamma, Greek, dot above], eqn (3)) was analyzed within the different configurations to determine if the hydrodynamics conditions reinforced biomass attachment. Pham et al.,26 stated a value of 120 s−1 as optimal value during the enrichment period to obtain high BES performance:

 
image file: c5ra11995b-t3.tif(3)

The shear rate is defined as the second order deformation tensor, where D (eqn (4)) represents the rate of deformation tensor, defined as:

 
image file: c5ra11995b-t4.tif(4)
u represents the velocity vector, and x the distance or position vector, with i and j representing each of its components.

3. Results and discussion

3.1 Anodic fluid dynamics

Anodic fluid flow was analysed for different selected electrode materials. Fig. 2 presents the fluid velocities contours and vectors profiles for each anode compartment configuration ((A): graphite rod, (B): granular graphite, (C): stainless steel mesh and (D): graphite plate). Graphite rod was considered as the control configuration and the collector electrode (Fig. 2A). The low surface availability (14.76 m per m3 NAC – Table 2) conducted to a clear preferential way caused by the recycling flow. The fastest velocity, ranging from 10–50 m h−1, was reached in the preferable way from inlet to outlet recirculation (Fig. 2A). In contrast, the slowest velocities (0–1 m h−1) were found at the opposite sides corresponding to both inlet and outlet streams. Velocity ranges between 0–10 m h−1 represented 78%, 83% and 92% of all the flow distributions for the x1, x2, x3 planes, respectively (Fig. 3). The highest velocities range (10–20 m h−1) represented only 10% of the total area (averaged from the three different planes). The wide range of velocities indicated a poor flux distribution influenced by the electrode used, the chamber architecture (square design) and the recirculation flow (100 times higher than the influent flow).
image file: c5ra11995b-f2.tif
Fig. 2 Velocity contours and vectors at three different planes (x1, x2, x3) from the centre to the anode wall, for each simulated case (inlet/outlet flow: 1.5 L per day, recirculation flow: 150 L per day): (a) graphite rod (14.76 m2 per m3 NAC, HRT 12 hours), (b) graphite rod + granular graphite (225.44 m2 per m3 NAC, HRT 9.55 hours), (c) graphite rod + stainless steel meshes (213.81 m2 per m3 NAC, HRT 12.08 hours), (d) graphite plate (208.7 m2 per m3 NAC, HRT 6.41 hours).
Table 2 Comparison of the ratio between electrode surface and liquid volume, void fraction, hydraulic retention time, power generation, columbic efficiency, and methane production for each case studied
Case Electrode material m2 per m3 NAC Void fraction HRT (hours) Power (W m−2) I (A m−2) C.E (%) CH4 prod. (mL per day)
1 Graphite rod 14.76 0.98 12
2 Graphite rod plus granular graphite 225.44 0.75 9.55 0.02 0.40 52 26.9
3 Graphite rod plus stainless steel mesh 213.81 0.94 12.08 0.14 0.36 58 28.6
4 Graphite plate 208.7 0.50 6.41


image file: c5ra11995b-f3.tif
Fig. 3 Relatives areas as a function of velocity ranges for the different longitudinal planes of the anode chamber (x1, x2 and x3). Operational conditions: inlet/outlet velocities: 0.80 m h−1, recirculation velocities: 80 m h−1. Parameters: (a) graphite rod: 14.76 m2 per m3 NAC, HRT 12 hours, (b) graphite rod + granular graphite (225.44 m2 per m3 NAC, HRT 9.55 hours), (c) graphite rod + stainless steel meshes (213.81 m2 per m3 NAC, HRT 12.08 hours), (d) graphite plate (208.7 m2 per m3 NAC, HRT 6.41 hours).

When granular graphite was introduced in the anode compartment (Fig. 2B), the available electrode surface considerably increased 225.44 m2 per m3 NAC decreasing the void fraction to 0.75 (Table 2). Granular graphite favoured the flow dispersion in the inlet zones with a better velocity distribution within the domain. Velocity ranges were between 2 and 5 m h−1. The lowest velocities zones were found closer to the both inlet and outlet streams (0–1 m h−1) influenced by the anode architecture. When moving towards the anode chamber wall (x2, x3), the maximum velocities at the recirculation streams were reduced. The range of velocities was more homogeneous. Velocities between 0 and 10 m h−1 occupied an average area of 96% (93%, 98% and 98% to x1, x2 and x3 respectively).

The third electrode assessed was stainless steel mesh (Fig. 2C). Three meshes were introduced inside the compartment (Fig. 1). This resulted in an available surface of 213.18 m2 per m3 NAC and a void fraction of 0.94. The flow inside the chamber was regularly distributed by the presence of stainless steel meshes. An average of 95% of the total liquid relative area relied on velocities range between 0–5 m h−1. Only a predominant flux between inlet and outlet recirculation streams was observed in x3 (Fig. 2C and 3) because of the no presence of electrode material near the membrane wall. The average percentage of the total area at velocity range 0–5 m h−1 was 96%, with the smallest value close to the membrane wall (x3 – 93%).

The fourth case of study used a 10 mm thickness graphite plate (Fig. 2D). The plate covered the majority of the anode chamber domain (a surface area of 208.7 m2 per m3 NAC and a void fraction of 0.50). The inlet recirculation was configured with the fluid stream flowing through the space between the anode chamber wall and graphite plate surface. The friction of the water in contact with the plate caused a drop of the velocity to 0–1 m h−1 close to the graphite plate wall (x2). The fastest velocities were found near the membrane wall in plane x3 in the zone connecting both recirculation streams (ranging from 5 to 30 m h−1).

3.2 Dynamics of substrate within the anode compartment

The different hydrodynamics may influence the substrate distribution within the anode compartment. In order to assess hydrodynamics effects on substrate distribution, the two cases with a better flow distribution were considered (Cases B and C). The biological model considered the acetate oxidation and its competition between anodophilic and methanogenium bacteria. Fig. 4 depicts the simulated acetate concentration profiles at steady state conditions for Cases 2 and 3. The anodes were fed with an acetate enriched solution of 500 mg L−1. The low daily flow (1.5 L per day) favoured the fast consumption of substrate at the inlet zone. In both cases, the anode initially worked as a plug flow system with circular development, since the concentration gradients occurred in the direction of the influent flow. When the inlet flow reached the recirculation stream, substrate was completely homogenized.
image file: c5ra11995b-f4.tif
Fig. 4 Acetate concentration profiles using (a) rod graphite + granular graphite (225.44 m2 per m3 NAC, HRT 9.55 hours) and rod graphite + stainless steel meshes (b) (13.81 m2 per m3 NAC, HRT 12.08 hours) as electrode materials.

The main differences in both concentration profiles were found due to the different void fractions which influenced the HRT value (Table 2). The lower HRT (9.55 hours) of the granular graphite anode (Case B, Fig. 4A) involved lower substrate removal efficiency, causing higher substrate gradient within the anode compartment. The higher HRT (12.08 hours) of the stainless steel meshes anode (Case 4, Fig. 4B) maximized substrate removal efficiency. The substrate was mainly removed in one quarter of the anode and no acetate was recirculated. This result suggested that an increment of the daily flow was hydrodynamically feasible.

This computational fluid dynamics study demonstrated that spatial heterogeneity existed. This result was validated by Pous et al.,23 who took inoculums from three different sampling ports of the cathode volume of an identical BES with granular graphite as the electrode. The highest nitrate removal and current production were observed close to the feed stream, where according to Fig. 4A more substrate was available.

3.3 Selection of the electrode material

The selection of the electrode material affects the hydrodynamic behaviour within the chamber, influencing the substrate distribution and biomass attachment. The use of CFD enables the selection of the proper conductive material shape in terms of regular flow distribution within the anode compartment minimising preferential flow ways. The choice of the optimal configuration should be done based on three parameters: available surface, shear rate and power performance.

At larger conductive surface areas, more biomass can be attached and consequently, power production can be reinforced. Both granular graphite and stainless steel anodic materials ensure these conditions. Stainless steel had slightly higher surface (0.16 m2 of electrode) and a void fraction (0.94) than granular graphite (0.13 m2 and 0.75, respectively).

Moreover, both stainless steel and granular graphite had better flow homogenization within the system. To assess the homogeneity of the systems, residence time distribution curves by CFD were determined. A constant concentration of a tracer at the inlet stream was applied, measuring the response at the outflow stream. To simulate the recirculation stream, and especial user defined function was developed to adapt the tracer concentration at the outflow recirculation stream to the concentration at the influent recirculation. The essay was done for the two more representative electrode materials (granular graphite and stainless steel mesh). The average time for each distribution was calculated, for a step input as (eqn (5)):

 
image file: c5ra11995b-t5.tif(5)

Fig. 5 presents the residence time distribution curves. The average times of each distribution were 14.5 and 11.6 days for granular and stainless steel, respectively. These values compared to the HRT values confirmed the heterogeneity of the anode flow (dead zones, preferential flows). This reinforces the information given by the velocity contours from Fig. 1.


image file: c5ra11995b-f5.tif
Fig. 5 Computational residence time distribution using two different electrode materials: rod graphite + granular graphite (225.44 m2 per m3 NAC, HRT 9.55 hours) and rod graphite + stainless steel meshes (13.81 m2 per m3 NAC, HRT 12.08 hours) as electrode materials. Value τ means Hydraulyc residence time.

The larger void fraction and larger HRT favoured the better homogenization within the configuration using stainless steel mesh. Additionally better substrate distribution was achieved when using both materials (Fig. 4), and the higher HRT favoured better acetate removal when using rod graphite plus stainless steel mesh.

Shear rate represents the velocity gradient produced by the movement between a fluid in movement and other in stationary movement or a wall influencing biomass attachment. Fig. S2 presents the shear rate across the anodic chamber using both materials. The maximum shear reached was 20 s−1, far below the 120 s−1 suggested by Pahm et al.26 At such low values, the biomass got attached. Moreover, despite the model presented in this study was not developed a multiphase model, dimensionless values were useful to balance the substrate convection and mass transfer through the biofilm. To determine the mass transference from the liquid to the solid surface the Peclet number at each computational cell was determined. Peclet number (Pe) is a balance ratio between the advection processes over the diffusion processes (eqn (6)). The Pe profiles (Fig. S3) obtained showed that mass transfer was achieved by dispersion or diffusion, rather than convection.

 
image file: c5ra11995b-t6.tif(6)

From which L is the characteristic length, u the fluid velocity and D the mass diffusivity.

Moreover, the biomass attached on the electrodes could be either exoelectrogenic bacteria or methanogenic archaea. The highest power production was obtained using stainless steel material (0.14 W m−2, Table 2) instead of granular graphite (0.02 W m−2). The coulombic efficiency was slightly higher for stainless steel mesh and less methane was produced.

The choice of the anode material is crucial for every bio-anode microbial fuel cell (MFC) setup. Several types of catalysts, such as platinum, manganese oxides, and iron complexes have been investigated as catalysts to enhance electricity production (decrease the overpotential) in MFCs. Unfortunately, these catalysts are often expensive, unsustainable or time-consuming in preparation, might be subject to poisoning or secondary pollution, and difficult biofilm formation on the surface of the electrode. Carbon materials with various structures, shapes and properties are widely used as electrodes for MES applications due to their high conductivity, good chemical stability and relatively low cost but constrained by low current density mainly resulting from the low rate of extracellular electron transfer between bacteria and electrode.27 Granular graphite is one of the most used carbon based electrode. It is advised to do chemical cleanings to remove possible metal and biomass contamination which could inhibit electrogenic population.28 The negatives impacts of using granular graphite particles is related to the biofilm builds up through the granular graphite particles, blocking the fluid flow path, and producing clogging, which would affect directly the electrogenic microbial activity.29,30

Biofilms on electrode surfaces play a key role in current generation or transformation in BES. By modifying the electrode properties the electronic conductivity, electron transfer and biofilm adhesion can be enhanced. The surface properties, which include the chemistry and charges present at the electrode surface, have been found to affect bacterial adhesion, biofilm formation and electron transfer significantly.27 When having biofilms, the material composition should only be accounted if it is influencing rheological surfaces properties of the material. The rheological and physical properties of surface materials should be taken in account in the art of numerical methods. The definition of the material properties (i.e. surface rugosity) had a particular interest when modelling turbulent flow motions. Computational fluid dynamics is able to model systems including specific wall properties (even reacting, moving or heating walls). However, a logical equilibrium by proper modelling results and computational effort should be taking into account. In this study, the material composition was not selected as a key parameter since the operational conditions made the flow to be in a laminar flow (Fig. S1), and the motivation of this work is to test specific operational conditions with different anode materials.

Considering all these parameters and flow distribution, the stainless steel anodic material was selected as the best configuration. These results are in agreement with Pocaznoi et al.,31 who proposed stainless steel as an alternative material for BES electrodes, due to lower costs and higher electronic conductivity and higher current densities (up to 35 A m−2, while graphite did not exceed 11 A m−2). This was the first demonstration that stainless steel offers a very promising ability to form microbial anodes. Recently, Ledezma et al.,32 proposed oxidised stainless steel as a very effective electrode material besides its high risk of corrosion and the low material porosity.

4. Conclusions

Inside knowledge about the behaviour of bioanodes was obtained by combining flow hydrodynamics and biological process modelling. This computational fluid dynamics study demonstrated that spatial heterogeneity existed. Some configurations (graphite rod or plate) favour the occurrence of preferential flow ways which decreases the anode performance. The use of granular graphite or stainless steel meshes as anode material ensures a better flow distribution within the anode chamber and offers high surface available for biomass attachment and consequently, higher treatment capacity and electricity production.

Acknowledgements

This research was financially supported by the Spanish Government (CTQ2014-53718-R). We thank Narcis Pous and Pau Batlle-Vilanova for the useful suggestions and critically reading of the manuscript.

References

  1. N. Pous, S. Puig, M. Coma, M. D. Balaguer and J. Colprim, J. Chem. Technol. Biotechnol., 2013, 88, 1690–1696 CrossRef CAS PubMed.
  2. S. J. Lim, W. Park, T.-H. Kim and I. H. Shin, Bioresour. Technol., 2012, 118, 163–169 CrossRef CAS PubMed.
  3. P. Batlle-Vilanova, S. Puig, R. Gonzalez-Olmos, A. Vilajeliu-Pons, M. D. Balaguer and J. Colprim, RSC Adv., 2015, 52243–52251 RSC.
  4. K. P. Nevin, S. A. Hensley, A. E. Franks, Z. M. Summers, J. Ou, T. L. Woodard, O. L. Snoeyenbos-West and D. R. Lovley, Appl. Environ. Microbiol., 2011, 77, 2882–2886 CrossRef CAS PubMed.
  5. R. Ganigué, S. Puig, P. Batlle-Vilanova, M. D. Balaguer and J. Colprim, Chem. Commun., 2015, 51, 3235–3238 RSC.
  6. A. W. Jeremiasse, H. V. M. Hamelers and C. J. N. Buisman, Bioelectrochemistry, 2010, 78, 39–43 CrossRef CAS PubMed.
  7. C. I. Torres, H.-S. Lee and B. E. Rittmann, Environ. Sci. Technol., 2008, 42, 8773–8777 CrossRef CAS.
  8. A. Vilar-Sanz, S. Puig, A. García-Lledó, R. Trias, M. D. Balaguer, J. Colprim and L. Bañeras, PLoS One, 2013, 8, e63460 CAS.
  9. D. H. Park and J. G. Zeikus, Biotechnol. Bioeng., 2003, 81, 348–355 CrossRef CAS PubMed.
  10. Y. Ahn, M. C. Hatzell, F. Zhang and B. E. Logan, J. Power Sources, 2014, 249, 440–445 CrossRef CAS PubMed.
  11. R. Andersson, B. Andersson, F. Chopard and T. Norén, Chem. Eng. Sci., 2004, 59, 4911–4917 CrossRef CAS PubMed.
  12. Y. le Moullec, C. Gentric, O. Potier and J. P. Leclerc, Chem. Eng. Sci., 2010, 65, 492–498 CrossRef CAS PubMed.
  13. T. R. Bentzen, N. Ratkovich, S. Madsen, J. C. Jensen, S. N. Bak and M. R. Rasmussen, Water Sci. Technol., 2012, 66, 2318–2327 CrossRef CAS PubMed.
  14. B. Wu, Biotechnol. Bioeng., 2012, 109, 2864–2874 CrossRef CAS PubMed.
  15. Q. Huang, C. Yang, G. Yu and Z.-S. Mao, Chem. Eng. Sci., 2010, 65, 5527–5536 CrossRef CAS PubMed.
  16. R. J. G. Lopes and R. M. Quinta-Ferreira, Chem. Eng. Sci., 2010, 65, 291–297 CrossRef CAS PubMed.
  17. J. Kim, H. Kim, B. Kim and J. Yu, Water Sci. Technol., 2014, 69, 1447–1452 CrossRef CAS PubMed.
  18. I. S. Michie, J. R. Kim, R. M. Dinsdale, A. J. Guwy and G. C. Premier, Bioresour. Technol., 2014, 165, 13–20 CrossRef CAS PubMed.
  19. B. E. Logan, B. Hamelers, R. Rozendal, U. Schröder, J. Keller, S. Freguia, P. Aelterman, W. Verstraete and K. Rabaey, Environ. Sci. Technol., 2006, 40, 5181–5192 CrossRef CAS.
  20. Y. Zhang, J. Sun, Y. Hu, S. Li and Q. Xu, Int. J. Hydrogen Energy, 2012, 37, 16935–16942 CrossRef CAS PubMed.
  21. M. Zhou, M. Chi, J. Luo, H. He and T. Jin, J. Power Sources, 2011, 196, 4427–4435 CrossRef CAS PubMed.
  22. S. Puig, M. Coma, J. Desloover, N. Boon, J. Colprim and M. D. Balaguer, Environ. Sci. Technol., 2012, 46, 2309–2315 CrossRef CAS PubMed.
  23. N. Pous, C. Koch, a. Vilà-Rovira, M. D. Balaguer, J. Colprim, J. Mühlenberg, S. Müller, F. Harnisch and S. Puig, RSC Adv., 2015, 5, 68326–68333 RSC.
  24. C. Picioreanu, J. S. Vrouwenvelder and M. C. M. van Loosdrecht, J. Membr. Sci., 2009, 345, 340–354 CrossRef CAS PubMed.
  25. R. P. Pinto, B. Srinivasan, M.-F. Manuel and B. Tartakovsky, Bioresour. Technol., 2010, 101, 5256–5265 CrossRef CAS PubMed.
  26. H. T. Pham, N. Boon, P. Aelterman, P. Clauwaert, L. de Schamphelaire, P. van Oostveldt, K. Verbeken, K. Rabaey and W. Verstraete, Microb. Biotechnol., 2008, 1, 487–496 CrossRef CAS PubMed.
  27. E. Fiset and S. Puig, J. Biorem. Biodegrad., 2015, 6, 1–2 Search PubMed.
  28. D. R. Bond and D. R. Lovley, J. Biorem. Biodegrad., 2003, 69, 1548–1555 CAS.
  29. M. Di Lorenzo, K. Scott, T. P. Curtis and I. M. Head, Chem. Eng. J., 2010, 156, 40–48 CrossRef CAS PubMed.
  30. P. Aelterman, M. Versichele, M. Marzorati, N. Boon and W. Verstraete, Bioresour. Technol., 2008, 99, 8895–8902 CrossRef CAS PubMed.
  31. D. Pocaznoi, A. Calmet, L. Etcheverry, B. Erable and A. Bergel, Energy Environ. Sci., 2012, 5, 9645 CAS.
  32. P. Ledezma, B. C. Donose, S. Freguia and J. Keller, Oxidised stainless steel: a very effective electrode material for microbial fuel cell bioanodes but at high risk of corrosion, Electrochim. Acta, 2015, 158, 356–360 CrossRef CAS PubMed.

Footnote

Electronic supplementary information (ESI) available. See DOI: 10.1039/c5ra11995b

This journal is © The Royal Society of Chemistry 2015
Click here to see how this site uses Cookies. View our privacy policy here.