Parvaneh Shabanzadehab,
Rubiyah Yusof*ab and
Kamyar Shamelib
aCentre for Artificial Intelligence and Robotics, Universiti Teknologi Malaysia, 54100 Kuala Lumpur, Malaysia. E-mail: rubiyah.kl@utm.my; Tel: +60 173371365
bMalaysia-Japan International Institute of Technology (MJIIT), Universiti Teknologi Malaysia, Jalan Sultan Yahya Petra (Jalan Semarak), 54100 Kuala Lumpur, Malaysia
First published on 7th October 2015
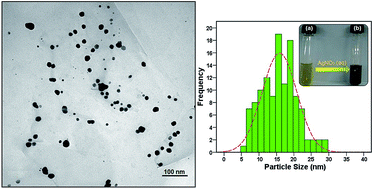
In this study silver nanoparticles (Ag-NPs) are biosynthesized from silver nitrate aqueous solution through a simple and eco-friendly route using water extract of Vitex negundo L. (V. negundo) which acted as a reductant and stabilizer simultaneously. The as prepared samples are characterized using UV-visible spectroscopy, X-ray diffraction (XRD), and transmission electron microscopy (TEM). Also artificial neural network (ANN) model was presented for synthesized silver nanoparticles in V. negundo L. extract. The aim was to predict size of silver nanoparticles produced as a function of the weight percentage of V. negundo L. extract, reaction of temperature, stirring time and molar concentration of AgNO3. The fast Levenberg–Marquardt (LM) optimization technique was employed for training of ANN model. The optimized ANN was as a multilayer perceptron (MLP) network with two hidden layers and 10 neurons. Therefore ANN is found out to be an efficient tool to model the complicated chemical field. This model is capable for predicting the size of nanoparticles for a wide range of conditions with a mean square error 0.4576 and a regression of about 0.998. Based on the presented model it is possible to design an effective green method for obtain silver nanoparticles, while minimum received materials are used and minimum size of nanoparticles will be obtained.
A number of approaches are available for the synthesis of silver nanoparticles for example, reduction in solutions, chemical and photochemical reactions in reverse micelles, thermal decomposition of silver compounds, radiation assisted, electrochemical, sonochemical, microwave assisted process and recently via green biosynthetic route.1
The biosynthesis of nanoparticles, which represents a connection between biotechnology and nanotechnology, has received increasing consideration due to the growing need to develop environmentally friendly technologies for material syntheses. The search for appropriate biomaterials for the biosynthesis of nanoparticles continues through many different synthetic methods.2 The biosynthetic method using plant extracts has received more attention than chemical and physical methods and even than the use of microbes. The method is suitable for nanoscale metal synthesis due to the absence of any requirement to maintain an aseptic environment.3 The possibility of using plant materials for the synthesis of nanoscale metals was reported initially by Gardea-Torresdey et al.4,5
In continuation, we have demonstrated the prospect of using Curcuma longa tuber powder water extract, Callicarpa manigayi stem bark and V. negundo L. methanolic extracts for the synthesis of the Ag-NPs.6–9
Basically, artificial neural networks were inspired by the learning process in the human brain. Since 1940 till now, it has been evolved steadily and was adopted in many areas of science and various fields such as process control, pattern recognition, forecasting, and system identification.10–12 In recent years, ANNs have been used as a powerful modeling tool in various chemical processes such as.13–15
In the ANN modeling approach, it requires known input data set without any assumptions; therefore it has several advantages over traditional mathematical or statistical models. In order to predict the desired output as a function of suitable inputs, ANN develops a mapping of the input into output variables. Almost more of multilayer neural networks by selecting a suitable set of connecting weights and transfer functions can approximate any smooth, measurable function between input and output vectors.16–18 The objective of this paper is to reach the prediction model to the evaluate influence of different variables on size of silver nanoparticles obtained by V. negundo L. extract and compression the experimental data with predicted neural network model's values.
• Linear transfer function
f(x) = x, −∞ ≤ f(x) ≤ +∞ | (1) |
• Sigmoid transfer function
f(x) = 1/(1 + e−x), 0 ≤ f(x) ≤ 1 | (2) |
• Hyperbolic tangent transfer function
f(x) = (ex − e−x)/(ex + e−x), −1 ≤ f(x) ≤ 1 | (3) |
ANN training process is an optimization process the which takes a set of input dataset and checks the output for the desired output by systematically adjusting of weights so that the network can predict the correct outputs. The training process modifies the weight and biases until the accuracy of results prediction be acceptable, then the ANN learns how to predict. One of the most common algorithms for training process is the feed forward back propagation (FFBP) neural network,20 which is a multiple-layer network with an input layer, an output layer and some hidden layers between the input and output layers.21 Different types of algorithm of training with mathematical aspects of them are comprehensively described in the literature.22–25
The input–output relationship between each node of a hidden layer can be written as follows
![]() | (4) |
The most widely criteria used for evaluation of the performance of the ANN model are the mean squared error (MSE) and correlation coefficient (R). In statistics, R indicates the strength and direction of a linear relationship between two variables. In general statistical usage R refers to the departure of two variables from independence. A number of different coefficients are used for different situations. The iteration of leaning process terminates when MSE of performance is less than a specific tolerance (here, 10−3). The MSE and R are as follow:
![]() | (5) |
![]() | (6) |
![]() | ||
Fig. 2 UV-vis absorption spectra and photographs of (a) V. negundo aqueous extract and (b) Ag/V. negundo emulsion. |
The preparation of Ag-NPs was studied by UV-vis spectroscopy, which has proven to be a useful spectroscopic method for the detection of prepared metallic nanoparticles. The formation of Ag-NPs was followed by measuring the surface plasmon resonance of the V. negundo and Ag/V. negundo emulsions over the wavelength range from 300 to 800 nm. Fig. 2 shows that Ag-NPs started forming when AgNO3 reacted directly with V. negundo at a room temperature. In UV-vis spectra, the spherical Ag-NPs must display a surface plasmon resonance band at around 400–450 nm.26
In addition, all the Ag-NPs had a similar diffraction profile and XRD peaks at 2θ of 38.17°, 44.413°, 64.44°, 77.37° and 81.33° could be attributed to the 111, 200, 220, 311 and 222 crystallographic planes of the face-centered cubic (fcc) silver crystals, respectively.27 The XRD pattern thus clearly illustrated that the Ag-NPs formed in this study are crystalline in nature. The main crystalline phase was silver and there was no obvious other phases as impurities were found in the XRD patterns (Ag XRD Ref. no. 01-087-0719).
It should be attention that the range of input variables was dissimilar. Therefore, each of input variables was normalized in the range of −1 to 1 by the following equation:
![]() | (7) |
The experimental divided into three sections (train, test, and validation) due to avoiding over fitting.28 This method is called “early stopping” that is used to protect network from over fitting.29,30 The train dataset is always used to training of the network model while validation dataset is applied to determine the optimum network architecture and also to stop training network when over learning takes placed. The test dataset is just applied to evaluate the network. Also “The test set was utilized to avoid over fitting by controlling errors”.31 It must be mentioned that validation and test data were not used in training of ANN model.
The optimal ANN architecture was found with four neurons (the V. negundo extract, stirring time, temperature of reaction and AgNO3 concentration), one neuron (size of nanoparticles) and 10 neurons in the hidden layer as 4:
10
:
1, with the hyperbolic tangent and the pure line transfer functions for hidden and output layers, respectively (Fig. 5), while the weight and bias values of each layer were determined.
In Table 1 is presented the experimental data used for the obtaining of best ANN model. The predicted particle size is compared to the observed particle size and the difference between the predicted and observed size is stated as particle size error based on the difference between these two values.
Run no. | Plant extract in 100 water (g) | Temperature of reaction (C) | Stirring time (hour) | Molar concentration of 100 (mL) AgNO3 | Size of silver (actual) (nm) | Size of silver (predict) (nm) | Error = actual − predict (nm) |
---|---|---|---|---|---|---|---|
1 | 0.1 | 25 | 48 | 0.1 | 27.39 | 28.383 | −0.99308 |
2 | 0.1 | 30 | 48 | 0.2 | 28.44 | 28.737 | −0.29705 |
3 | 0.1 | 40 | 48 | 0.5 | 28.83 | 28.84 | −0.0104 |
4 | 0.1 | 50 | 48 | 1 | 29.31 | 29.313 | −0.00334 |
5 | 0.1 | 60 | 48 | 1.5 | 30.98 | 30.927 | 0.052567 |
6 | 0.1 | 70 | 24 | 2 | 31.79 | 30.443 | 1.3466 |
7 | 0.25 | 25 | 24 | 0.1 | 24.62 | 24.637 | −0.01667 |
8 | 0.25 | 30 | 24 | 0.2 | 25.77 | 25.787 | −0.01734 |
9 | 0.25 | 40 | 24 | 0.5 | 26.08 | 26.101 | −0.02101 |
10 | 0.25 | 50 | 24 | 1 | 26.84 | 26.223 | 0.61658 |
11 | 0.25 | 60 | 12 | 1.5 | 27.49 | 27.483 | 0.007177 |
12 | 0.25 | 70 | 12 | 2 | 28.53 | 28.489 | 0.040549 |
13 | 0.5 | 25 | 12 | 0.1 | 18.23 | 18.059 | 0.17082 |
14 | 0.5 | 30 | 12 | 0.2 | 19.21 | 19.125 | 0.084778 |
15 | 0.5 | 40 | 12 | 0.5 | 20.67 | 21.099 | −0.42885 |
16 | 0.5 | 50 | 6 | 1 | 21.32 | 21.355 | −0.03466 |
17 | 0.5 | 60 | 6 | 1.5 | 23.78 | 23.809 | −0.02877 |
18 | 0.5 | 70 | 6 | 2 | 24.12 | 24.157 | −0.03654 |
19 | 0.75 | 25 | 6 | 0.1 | 15.37 | 15.425 | −0.05481 |
20 | 0.75 | 30 | 6 | 0.2 | 16.43 | 16.769 | −0.33903 |
21 | 0.75 | 40 | 3 | 0.5 | 17.83 | 17.882 | −0.05204 |
22 | 0.75 | 50 | 3 | 1 | 19.33 | 18.772 | 0.55796 |
23 | 0.75 | 60 | 3 | 1.5 | 19.85 | 19.884 | −0.03443 |
24 | 0.75 | 70 | 3 | 2 | 20.74 | 20.33 | 0.41021 |
25 | 1 | 25 | 3 | 0.1 | 15.64 | 15.664 | −0.02369 |
26 | 1 | 30 | 1 | 0.2 | 16.44 | 16.484 | −0.04385 |
27 | 1 | 40 | 1 | 0.5 | 17.31 | 17.358 | −0.04816 |
28 | 1 | 50 | 1 | 1 | 17.55 | 17.58 | −0.02975 |
29 | 1 | 60 | 1 | 1.5 | 18.47 | 18.488 | −0.01838 |
30 | 1 | 70 | 1 | 2 | 18.72 | 18.74 | −0.02016 |
In the Table 2 is shown the values of connection weights (parameters of the model) for the complete ANN model trained on the experimental datasets. This information let other researchers can use present ANN model with their own experimental data.
Node1 | Node2 | Node3 | Node4 | Node5 | Node6 | Node7 | Node8 | Node9 | Node10 | Bias 2 | |
---|---|---|---|---|---|---|---|---|---|---|---|
Input 1 | 1.2888 | 0.80109 | −1.4691 | 0.4282 | 0.17815 | −1.8229 | −1.8128 | −0.4232 | 2.5278 | 1.5863 | |
Input 2 | −1.4193 | 1.8848 | 2.1709 | −0.24801 | 0.44858 | −1.525 | −0.21333 | 2.3386 | 0.8617 | 1.5071 | |
Input 3 | 0.86468 | −1.359 | 1.6485 | 0.82539 | 0.78086 | 0.17248 | 1.1837 | 0.13042 | 1.1185 | −1.1452 | |
Input 4 | 1.1096 | −0.68414 | −1.1089 | −2.0553 | −2.7909 | 1.2445 | 1.3834 | −1.0763 | 1.1503 | −1.1424 | |
Output | −0.1686 | −0.19511 | 0.43103 | 0.1953 | −0.24939 | 0.2941 | −0.12225 | 0.37159 | 0.20407 | −0.15654 | |
Bias 1 | −2.6573 | −1.6986 | 0.60093 | −0.1745 | 0.35521 | −0.3558 | 0.043435 | 1.5129 | 1.2438 | 2.1805 | −0.4754 |
As mentioned in (ref. 30 and 32–37), the error functions (R and MSE are carried out based on predicted output and actual output) are commonly used and applied for evaluation and presentation of every statistical or mathematical model. The values of MSE and R for the optimum architecture were presented in Table 3. Therefore they were employed in our work that which as clearly show power and accuracy of optimized ANN model. Then the results showed that the network can predict the unused date with high accuracy.
Test | R | MSE |
---|---|---|
Train | 1.0000 | 0.0011 |
Validation | 0.9938 | 0.359 |
Test | 0.9982 | 0.4576 |
Also, in the Fig. 6 is shown the scatter diagram of predicted values by ANN modeling (Output) in comparison with experimental values (Target). It is indicating good predictive ability of the proposed model is obtained by the ANN process.38
In the Fig. 7 is shown the errors histogram of train, validation and test sets. These results specify that the experimental data has been fitted with proper accuracy using the obtained ANN model.
Fig. 8 represents the MSE of test, train, and validation datasets for 5 iterations, and the best validation performance is found to in 0.359 in the 5th epoch (iteration). The results of Fig. 8 show other reasons for validating the final obtained ANN model.
The results were presented in Fig. 9 show that measurement of size of Ag-NPs decreased rapidly with the increase in the amount of V. negundo extract. As inversely, increasing of temperature of reaction, stirring time, and AgNO3 concentration will be increased the size of Ag-NPs.
![]() | ||
Fig. 9 Two-dimensional plots, effects of amount of V. negundo extract (a), temperature of reaction (b), stirring time (c), AgNO3 concentration on size of Ag-NPs (d). |
The Fig. 10(a)–(f) presents the combined effects of the four input variables, on the size of nano particles. In Fig. 10(a) the size of Ag-NPs on based the amount of V. negundo extract and temperature of reaction is presented. Indicating the points are inside the red, yellow, and dark blue areas can conclude that: “The V. negundo extract has the decreasing property on size of Ag-NPs and Temperature has the decreasing property” so that minimum of size of Ag-NPs is accrued in the experimental condition, 25 °C of temperature and 1.0 gram of V. negundo extract. Also the maximum of size of Ag-NPs outcropped in 70 °C of temperature and amount 0.2 gram of V. negundo extract.
The size of Ag-NPs on based the amount of V. negundo extract and AgNO3 concentration is presented in the Fig. 10(b). The points of red area show the increasing property of AgNO3 concentration so that maximum of size of Ag-NPs was happened 2 mol of AgNO3 concentration and 0.1 gram of V. negundo extract. Also the points of dark blue area indicative more effective of V. negundo extract on the size of nanoparticle; also they demonstrate the decreasing property of V. negundo extract on the measure of Ag-NPs, as the minimum of size of Ag-NPs was occurred 1 gram of V. negundo extract and amount of less than 0.2 mol of AgNO3 concentration.
The effects of concentration AgNO3 and temperature of reaction on the size of nanoparticles is shown in Fig. 10(c). The points of inside the green, yellow, red and dark blue areas indicate both factors are important in determining nanoparticle size. The minimum of size of Ag-NPs was befall in less than 0.2 mol of AgNO3 concentration and 25 °C of temperature and also maximum of size of Ag-NPs was happened in 70 °C of temperature and amount 2 mol of AgNO3 concentration.
Fig. 10(d) displays the effects of stirring time and amount of temperature on output. The points inside the red and dark blue areas represents that the factor of stirring time is more important than temperature. Therefore minimum of size of Ag-NPs is happed in during less than 5 hour of stirring time and 25 °C of temperature of condition experimental, and also maximum of size of Ag-NPs is arisen in 24 hour and 60 °C.
The size of Ag-NPs on based the amount of V. negundo extract and time of stirring is presented in Fig. 10(e). The points inside of different colure of figure show factor V. negundo of extract is more important than stirring's time for determining nanoparticle size. Then maximum size of Ag-NPs is accrued in 24 hour of stirring time and 0.1 gram of V. negundo extract and minimum size of Ag-NPs is 1 hour of stirring time and 1 gram of V. negundo extract.
The effects of AgNO3 concentration and stirring time of reaction on the size of nanoparticles are shown in Fig. 10(f). The points inside the blue and yellow and orange areas demonstrate that the factor of stirring time is more important than AgNO3 concentration. Therefore minimum of size of Ag-NPs is happed in during less than 5 hour of stirring time and 0.2 mol of AgNO3 concentration of condition experimental, and also maximum of size of Ag-NPs is arisen in 24 hour and 2 mol of AgNO3 concentration. The results obtained from Fig. 10(a)–(f) verify the higher efficiency of amount of V. negundo extract compared to the other effects on the size of Ag-NPs. Also, the other important factors are stirring time, molar concentration AgNO3 and reaction temperature as respectively.
This journal is © The Royal Society of Chemistry 2015 |