Determination of the ion exchange process of K2Ti4O9 fibers at constant pH and modeling with statistical rate theory

Chang Liuab, Nanhua Wuac, Jun Wanga, Liangliang Huang*b and Xiaohua Lu*a
aState Key Laboratory of Materials-Oriented Chemical Engineering, Nanjing Tech University, Nanjing 210009, China. E-mail: xhlu@njtech.edu.cn
bSchool of Chemical, Biological and Materials Engineering, University of Oklahoma, Norman, Oklahoma 73019, USA. E-mail: HLL@ou.edu
cDivision of Energy Science/Energy Engineering, Luleå University of Technology, 97187 Luleå, Sweden

Received 19th June 2015 , Accepted 13th August 2015

First published on 13th August 2015


Abstract

The ion exchange kinetics of K2Ti4O9 fibers at constant pH was determined precisely by ion-selective electrodes, and activity coefficients of ions in solutions were calculated by the Lu–Maurer equation. It was found that the equilibrium time and TiO2/K2O molar ratio in the solid phase are more sensitive to pH than to water volume. After that, a two-step exchange kinetics model was developed, in which a statistical rate theory base on chemical potential difference between interface was use to describe surface reaction process instead of an empirical exponential equation. The model shows that the resistance of the surface reaction step, which includes hydration of K+ ions on the surface and their transport in the solid phase, is the main resistance of the ion exchange process.

1 Introduction

Potassium hexatitanates (K2Ti6O13) fibers are promising functional materials.1–5 In its crystal structure, TiO6 units form a stable tunnel structure and potassium ions are fixed in the tunnel. Therefore, K2Ti6O13 fibers show outstanding mechanical performance, low hardness and excellent chemical stability. They have found many applications for example, as a heat-insulator, automotive brake lining, a filler for various composite materials and a photocatalyst.

K2Ti6O13 fibers can be prepared by many methods including calcinations,6 flux growth,7 and hydrothermal reaction.8 Among them it is easy to produce K2Ti6O13 fibers by calcination on a large scale.9,10 Through calcination K2Ti4O9 fibers were synthesized at high temperature using K2CO3 and TiO2 as raw materials. Then K2Ti4O9 fibers were treated with an acid solution, and an ion exchange process occurred between potassium ion in fibers and hydrogen ion in acid solution, to remove potassium ions in the fibers. K2Ti6O13 fibers can be obtained after heating the ion exchange products at high temperatures (>500 °C).

In order to prepare K2Ti6O13 fibers it is important to control ion exchange process precisely between K2Ti4O9 fibers and acid solutions. The ion exchange products are affected by water amount, pH, temperature, and exchange time. Sasaki et al.11 investigated the ion exchange process of hydrous titanium dioxide with K+ in an aqueous solution and found several intermediate phases, including H2Ti4O9·1.2H2O, K0.5H1.5Ti4O9·0.6H2O, KHTi4O9·0.5H2O, and K1.4H0.6Ti4O9·1.2H2O. Heating the ion exchange products with different TiO2/K2O molar ratios at high temperatures (>500 °C) usually produce a mixture of various titanate and titania including K2Ti6O13, K2Ti8O17, TiO2 (B), anatase, and rutile.12,13

In our previous work a thermodynamics model was developed to describe the ion exchange process of K2Ti4O9 whisker in acid solution.14,15 It shows that pH is essential in controlling TiO2/K2O ratio in products. However, the ion exchange kinetics of K2Ti4O9 in acid solution remains unknown because it is difficult to measure. In practice, K2Ti4O9 fibers are treated at a constant solution pH to control TiO2/K2O molar ratio in the solid phase. Adding acid solution and exchanging K+ from the solid phase cause determination problems. The other challenge in constructing a kinetics model is the multiphase problem, wherein several intermediate phases coexist during the ion exchange process. Several simplified models have been proposed. One is the use of a mass transfer model based on linear driving force approximations for liquid and particle. This model was used by chemical engineers interested in the effects and performance of ion exchangers. The others are mechanism models, including Nernst–Planck model and Maxwell–Stefan model. Although these equations show significant improvement over Fick's law, they involve complex calculations and are difficult to use in practice.16

Now a two steps model is often used in ion exchange kinetics. One step is a diffusion of ions in solution; the other step is surface reaction process between interfaces. Usually the diffusion process in solution is described by Fick's equation based on concentration gradient in liquid film, and the surface process is described by empirical exponential equation.16 In 1998, Ward et al.17 developed statistical rate theory (SRT), which describes the interfacial transport kinetics in aqueous solution based on chemical potential difference between interfaces. SRT model had been used to investigate the dissolution kinetics of K2SO4 in aqueous solution and mixed solvents.18,19 In the present work, the ion exchange process of K2Ti4O9 at constant pH was determined by ion-selective electrode. And a new two-step model for K2Ti4O9 ion exchange process in solution was developed, in which surface reaction process was described by SRT model.

2 Experiment

K2Ti4O9 fibers were prepared by calcination. The preparation process is detailed in the literature.20–22 K2Ti4O9 fibers were ground to pass through a 100-mesh sieve. The diameter of fibers is about 1 micron and their length is 10–100 micron (BET surface area = 2.93 m2 g−1). Ion exchange experiments were carried out in a 250 ml glass beaker with water jacket. Firstly 100 ml KCl solution (0.001 M) was put into glass beaker to stabilize K-Cl electrode pair. The solution was stirred at 200 rpm by an electric motor and its temperature was controlled at 25 °C by a thermostatic bath. After that, a certain amount of K2Ti4O9 fibers were added to the solution. HCl solution (0.01 M) was then added. An automatic potentiometric titrator was used to control solution pH. The potential of K-Cl electrode pairs and the added volume of HCl solution were recorded. The diagram of the ion exchange experiment is shown in Fig. 1.
image file: c5ra11882d-f1.tif
Fig. 1 Diagram of the K2Ti4O9 ion exchange process: (1) automatic titrator; (2) glass electrode; (3) calomel electrode; (4) jacketed reactor; (5) stirring paddle; (6) potassium electrode; (7) chlorine electrode; (8) potentiometer; (9) RS-232 C serial interface; (10) computer; (11) titration head; (12) rubber hose; (13) acid test burette; (14) electric motor; (15) solenoid valve; (16) hydrochloric acid.

The two counter ions of the ion exchange process are K+ in K2Ti4O9 and H+ in solution. HCl was continuously added during the process to keep the system at constant pH. Therefore, the solution adjacent to the solid phase can be considered as the H+–K+–ClOHH2O system. Based on the electrically neutral equation, ionization balance equation for water, and Nernst equation for K+ and Cl, we have

 
image file: c5ra11882d-t1.tif(1)
where Kw is the ionization constant of water and E0 and S are the standard electromotive force and the slope of the electrodes' response to the ionic activities, respectively. The experiment was carried out in solution at constant pH. mCl can be calculated from the mass of HCl solution added; the activity of water aw and the activity coefficient γ±,Kcl are functions of system compositions and can be calculated with Lu–Maurer Equation.23 mK+ can be calculated from the electromotive force E by trial and error.

3 Theory

The exchange process of K+ from K2Ti4O9 to the solution has two steps. The first step is a surface reaction process: K+ in solid diffuses to the surface and forms hydrated K+. The second step is a diffusion process: hydrated K+ diffuses from the boundary layer to the bulk solution.

We assume that the diffusion of K+ in the boundary layer follows Fick's Law:

 
J = kd(mimb) (2)
where J is K+ flux across the boundary layer [mol (kg−1 m−2 s−1)]; mi is hydrated K+ concentration on the solid surface (mol kg−1); mb is K+ concentration in bulk solution (mol kg−1); and kd is transport coefficient in solution [1/(m2 s)].

The surface reaction step is a nonlinear process described by an exponential equation. Given that SRT has been successfully proven for interfacial transport processes,24,25 it was used to describe the step in the present study. According to SRT, the exchange rate of K+ on the solid surface follows

 
image file: c5ra11882d-t2.tif(3)
where ms is K+ concentration in the solid phase, which can be calculated from the ion exchange thermodynamic model,14 and ke is the equilibrium exchange rate [mol kg−1 m−2 s−1)]. The concentration mi was calculated using eqn (2) and (3):
 
image file: c5ra11882d-t3.tif(4)

The expression of J was rewritten by substituting eqn (4) into eqn (2):

 
image file: c5ra11882d-t4.tif(5)

The collision frequency of K+ on the solid surface increases with its concentration in bulk solution. In addition, TiO2 rapidly dissolves in acid solution when the pH of the solution is less than 1.26 In our experiments, pH was controlled above 2 to avoid the destruction of the layered structure of K2Ti4O9. Considering that the ion exchange rate was influenced by the change in K+ concentration in bulk solution and pH, ke was modeled as follows:

 
ke = A + B × (mb/ms)C (6)
where A, B, and C are model parameters. Substituting eqn (6) into eqn (5), we obtained
 
image file: c5ra11882d-t5.tif(7)

The potassium ion flux across the boundary layer, J, was calculated by eqn (8):

 
image file: c5ra11882d-t6.tif(8)

Thus, eqn (7) and (8) were used to analyze the experimental data on ion exchange kinetics and to find the control step for the entire process.

4 Results and discussion

4.1 Effect of water amount

To prepare K2Ti6O13 fibers, pH was usually controlled at 9.3 for K2Ti4O9 in the ion exchange process.27,28 We studied the effect of water amount on ion exchange kinetics at pH 9.3. The time evolution of K+ concentration in the solution at pH 9.3 and various water amounts is shown in Fig. 2.
image file: c5ra11882d-f2.tif
Fig. 2 Time evolution of K+ concentration in the solution at pH 9.3.

In Fig. 2, the label “pH 9.3–10” means that the pH is controlled at 9.3 and that the initial water amount is 10 g per 1 g solid sample. As shown in Fig. 2, K+ concentration in the solution for pH 9.3 to 10 is the largest among the three conditions. K+ concentration in the solution still increases after 20[thin space (1/6-em)]000 s, indicating that it has not yet reached the equilibrium. With increasing water amount, K+ concentration in the solution decreases, and the rate gradually decreases. At 100 ml g−1 water amount, K+ concentration remains unchanged after 5000 s.

The K+ concentration curves can be divided into two stages: increase stage and equilibrium stage. K+ concentration increases dramatically at the initial reaction and then increases smoothly in the second stage. K+ titanate fibers were pretreated to remove most K2O flux on the surface. However, the dramatic increment of K+ in the first stage should not contribute to K2O flux on the surface.

The change in solid composition with time during the ion exchange process can be obtained according to the plots shown in Fig. 2. However, different crystal forms exist during the ion exchange process of K2Ti4O9.11 Some of these crystal forms include K2Ti4O9·2.2H2O, K1.4H0.6Ti4O9·1.2H2O, KHTi4O9·0.5H2O, K0.5H1.5Ti4O9·0.6H2O, and H2Ti4O9·1.2H2O. Their exact molar ratios are difficult to determine because the process occurs fast and the hydration products are usually amorphous. Thus, the solid composition was represented as K2O·RTiO2·nH2O. The values of R can be calculated from the TiO2/K2O molar ratio of the initial materials and K+ concentration in the solutions. Fig. 3 shows the TiO2/K2O molar ratios in the solid phase as a function of time.


image file: c5ra11882d-f3.tif
Fig. 3 Time evolution of TiO2/K2O molar ratio in the solid phase at pH 9.3.

At pH 9.3, the TiO2/K2O molar ratio in the solid phase increases as the water amount increases (Fig. 3). Each curve contains two stages. The R value rises rapidly in the first stage and then slowly after approximately 1000 s in the second stage. The equations for liner regression of the second stage are listed in Table 1.

Table 1 Fitting equations of the second stage curves
Water amount, ml g−1 Equation Correlation coefficient R value at equilibrium Time to reach R = 6, h
10 y = 3 × 10⁻⁵x + 4.49 0.9936 5.9935 13.9
20 y = 3 × 10⁻⁵x + 4.6653 0.9804 6.0592 12.4
100 y = 3 × 10⁻⁵x + 5.0956 0.9961 6.2732 8.4


Based on our thermodynamic model for the ion exchange process,15,28 the equilibrium R values at pH 9.3 and different water amounts were calculated. The results are shown in Table 1. Thus, the ion exchange time to prepare K2Ti6O13 ranges from 8 h to 14 h at pH 9.3 and at 10 to 100 ml g−1 water amount. Large water amounts (>100 ml g−1) can reduce the reaction time. Our thermodynamic analysis for the ion exchange process of K2Ti4O9 (ref. 15) showed that K2Ti6O13 is easy to prepare at pH 9.3 because the water amount does not affect the equilibrium R. In the current work, the R value reaches 5.65 after 15[thin space (1/6-em)]000 s (approximately 4 h) at pH 9.3 and 100 ml g−1 water amount. Heating the ion exchange product at 800 °C yields K2Ti6O13 with 99% purity. Thus, the time range of ion exchange is flexible (4 to 8 h) when the water amount is above 100 ml g−1.

Fig. 3 shows that the first stage of ion exchange is not due to the dissolution of surface-free K2O; otherwise, the R value should be consistent until end of the first stage regardless of the water amount. This finding suggests that the first stage is an ion exchange process but with a reaction mechanism different from the second stage. Therefore, in the first stage, ion exchange occurs between surface K+ on fibers with H+ in the solution. By contrast, in the second stage, K+ in the fiber bulk gradually spreads to the surface then exchanges with H+ in the solution.

4.2 Effect of pH in solution

Increasing H+ concentration in the solution can accelerate the ion exchange process. Thus, we studied the ion exchange kinetics of K2Ti4O9 fibers at different pH values.

Fig. 4 and 5 show that the ion exchange process at different pH values also consist of two stages. The ion exchange rates increase significantly with decreasing pH. The reaction time of the first stage is short (less than 1000 s at different pH values) at 10 ml g−1 water amount. However, the reaction time of the first stage at different pH values increases to approximately 2000 s at 100 ml g−1 water amount. Therefore, at large water amounts, the low K+ concentration in the solution causes a large concentration gradient between the solid and the solution. As a result, more K+ ions are exchanged into the solution, reaction time is prolonged, and the R value of the solid phase is higher in the first stage.


image file: c5ra11882d-f4.tif
Fig. 4 Time evolution of TiO2/K2O molar ratio in the solid phase (R value) at 10 ml g−1 water amount.

image file: c5ra11882d-f5.tif
Fig. 5 Time evolution of TiO2/K2O molar ratio in the solid phase (R value) at 100 ml g−1 water amount.

As shown in Fig. 3 to 5, the water amount slightly affects the exchange rate in the second stage at the same pH. However, the pH significantly affects the exchange rate in the second stage at the same water amount. The steep slope in the second stage at low pH means that the reaction time must be accurately controlled. Otherwise, the R value will be out of range to prepare K2Ti6O13 and produce mixtures of K2Ti6O13 and K2Ti8O17 after calcination. The water amount should be increased to accelerate the reaction rate and thus prepare K2Ti6O13 fibers at easy conditions.

4.3 Exchange kinetics model

According to ion exchange kinetics data, the K+ exchange rate J between the solid and solution at different conditions were calculated. Then SRT was used to analyze the exchange process and to establish an ion exchange kinetics model of K2Ti4O9. The regression parameters of Jmb according to the kinetics model (eqn (7)) are shown in Table 2.
Table 2 Regression results of kinetics model parameters
pH Water mole ratio kd × 10−6 (kg g−1 s−1) A (mol kg−1) B (mol kg−1) C Correlation coefficient
5 10 613.4551 1.053478 0.023823 −4.781314 0.972
5 100 750.1152 3.728385 0.046171 −9.2509 0.998
7 10 524.1934 3.202929 0.019674 −4.83952 0.985
7 100 667.1249 0.120816 0.003677 −9.39438 0.999
9.3 10 272.1910 0.175242 0.012860 −4.32142 0.999
9.3 20 443.6438 −0.454361 0.545712 −1.21611 0.999
9.3 100 483.7275 0.021692 0.008527 −9.51036 0.999


The ion exchange of K2Ti4O9 fibers is a complex process. The composition and structure of fibers change with ion exchange process. In addition, K2Ti4O9 fibers are approximately 1 micron in diameter and 10 micron to 100 micron in length. These fibers are amorphous during the ion exchange process because of the large amount of water. Thus, observing the structural changes in K2Ti4O9 is difficult. In the preset study, a simplified approach, which had been successfully used in dissolution or crystallization process,18,29 was used to analyze the ion exchange kinetics process. The whole reaction process has two steps. The first step is the reaction process in which K+ ions in K2Ti4O9 fibers exchange with H+ on the fiber surface to become hydrated K+. The second step is a diffusion process in which hydrated K+ ions diffuse across liquid membrane and enter into the bulk. The process diagram is shown in Fig. 6.


image file: c5ra11882d-f6.tif
Fig. 6 Schematic of the ion exchange process.

We analyzed the resistance of surface reaction and diffusion process in the solution according to their definition in Table 3. The resistances of the two steps were calculated according their flux equation. The results are listed in Table 4.

Table 3 Resistance in the ion exchange process of K2Ti4O9 fibers
Process Flux equation Resistance
Surface reaction process J = ks(msmi) 1/ks
Diffusion process J = kd(mimb) 1/kd


Table 4 Resistance comparison under different conditions for K2Ti4O9 ion exchange
Experimental conditions Resistance of diffusion Resistance of surface reaction

image file: c5ra11882d-t7.tif

1/kd (m2 s) 1/ks (m2 s)
pH 5–10 1630 15[thin space (1/6-em)]200 ± 1000 89.7–90.9%
pH 5–100 1333 12[thin space (1/6-em)]500 ± 1000 89.6–91.0%
pH 7–10 1908 26[thin space (1/6-em)]100 ± 1400 92.8–93.5%
pH 7–100 1499 22[thin space (1/6-em)]600 ± 1300 93.4–94.1%
pH 9.3–10 3674 46[thin space (1/6-em)]100 ± 2000 92.3–92.9%
pH 9.3–20 2254 36[thin space (1/6-em)]400 ± 1500 93.9–94.4%
pH 9.3–100 2067 32[thin space (1/6-em)]100 ± 1400 93.7–94.2%


Table 4 shows that the resistance of the surface reaction process is always more than that of the diffusion process in the solution. The control step of ion exchange reaction is the surface reaction process. Moreover, the surface reaction process is a virtual step. It includes the hydration of K+ on the surface and the diffusion of K+ from the solid inside to the surface. Therefore, aside from increasing the stirring speed of the solution, the temperature should also be increased to accelerate the ion exchange process.

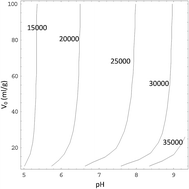
We fitted the surface reaction resistance with pH as a function of the solution and water amount to reflect the changes in surface reaction resistance under different conditions. Fig. 7 shows the contour plot.


image file: c5ra11882d-f7.tif
Fig. 7 Contour plot of surface resistance 1/Ks as a function of pH and water amount V0.

Fig. 7 shows that the surface reaction resistance increases rapidly with pH. Water amounts below 40 ml g−1 affect surface reaction resistance. However, pH can only affect surface reaction resistance when water amount is above 40 ml g−1. Therefore, solution pH is a key factor that affects equilibrium composition for the ion exchange process of K2Ti4O9 and determines the exchange rate and time.

5 Conclusion

In the current work, the ion exchange kinetics of K2Ti4O9 fibers at constant pH was determined by ion selective electrode and presented by a two-step model based on SRT. Compared with water amount, pH has a more significant effect on exchange rate. Given that the exchange process is moderate and easy to control, pH 9.3 was proven to be optimal for the preparation of K2Ti6O13 fibers. The reaction time is flexible in the range of 4 h to 8 h. The ion exchange kinetics process was analyzed based on the kinetics model. The resistances of the two steps were calculated. The main resistance of the ion exchange process originates from the surface reaction step.

Nomenclature

Epotential difference between potassium and chlorine electrodes (mv)
E0standard potential difference between potassium and chlorine electrodes (mv)
Sslope of the electrodes' response to the ionic activities
Kwionization constant of water
Mconcentration on the basis of molality (mol kg−1)
Nwater amount per 1 g solid sample (g g−1)
Ttemperature (K)
JK+ flux across the boundary layer [mol kg−1 m−2 s−1)]
kdtransport coefficient in solution [1/(m2 s)]
keequilibrium exchange rate [mol kg−1 m−2 s−1)]
kssurface reaction coefficient [1/(m2 s)]
RTiO2/K2O molar ratio in the solid phase
SBETsurface area of K2Ti4O9 fibers [m2 g−1]

Greek letters

γactivity coefficient

Subscripts

iposition between surface reaction process and diffusion process
sposition on solid surface
bposition on bulk solution

Acknowledgements

This work was supported by Chinese MOST 973 project (2013CB733501), National Natural Science Foundation of China (21136004, 21476106) and the Priority Academic Program Development of Jiangsu Higher Education Institutions (PAPD).

References

  1. J. Cai, Y. Zhu, D. Liu, M. Meng, Z. Hu and Z. Jiang, ACS Catal., 2015, 5, 1708–1716 CrossRef CAS.
  2. Y. Shi, L. Mu, X. Feng and X. Lu, J. Appl. Polym. Sci., 2012, 124, 1456–1463 CrossRef CAS PubMed.
  3. Z. Zhao, X. Chen, A. Chen, G. Huo and H. Li, J. Mater. Sci., 2009, 44, 6310–6316 CrossRef CAS.
  4. G. Zhao, T. Wang and Q. Wang, J. Mater. Sci., 2011, 46, 6673–6681 CrossRef CAS.
  5. K. Shimura, H. Kawai, T. Yoshida and H. Yoshida, ACS Catal., 2012, 2, 2126–2134 CrossRef CAS.
  6. Q. Sun, H. Wang, B. Wang and S. Zhang, Feijinshukuang, 2013, 36, 50–52 CAS.
  7. C. Dai, Y. Wang and Y. Gu, Naihuo Cailiao, 2013, 47, 24–27 CAS.
  8. Q. Liu, Y. Liu, T. Lei, Y. Tan, H. Wu and J. Li, Appl. Surf. Sci., 2015, 328, 279–286 CrossRef CAS PubMed.
  9. T. Shimizu, H. Yanagida, M. Hori, K. Hashimoto and Y. Nishikawa, Yogyo Kyokaishi, 1979, 87, 565–571 CrossRef CAS.
  10. N. Ohta and Y. Fujuiki, Yogyo Kyokaishi, 1980, 88, 1–8 CAS.
  11. T. Sasaki, M. Watanabe, Y. Komatsu and Y. Fujiki, Inorg. Chem., 1985, 24, 2265–2271 CrossRef CAS.
  12. C. Liu, X.-H. Lu, X. Feng and Z.-H. Yang, J. Nanjing Univ. Inf. Sci. Technol., Nat. Sci. Ed., 2003, 25, 17–20 CAS.
  13. Z. Xiong and X. S. Zhao, J. Am. Chem. Soc., 2012, 134, 5754–5757 CrossRef CAS PubMed.
  14. N. Bao, X. Lu, X. Ji, X. Feng and J. Xie, Fluid Phase Equilib., 2002, 193, 229–243 CrossRef CAS.
  15. C. Liu, Y. Ji, Q. Shao, X. Feng and X. Lu, Molecular Thermodynamics of Complex Systems, 2009, vol. 131, pp. 193–270 Search PubMed.
  16. P. F. Lito, S. P. Cardoso, J. M. Loureiro and C. M. Silva, Ion Exchange Technology I: Theory and Materials, Springer, 2012, pp. 51–120 Search PubMed.
  17. M. Dejmek and C. A. Ward, J. Chem. Phys., 1998, 108, 8698–8704 CrossRef CAS PubMed.
  18. C. Liu, X. Feng, X. Y. Ji, D. L. Chen, T. Wei and X. H. Lu, Chin. J. Chem. Eng., 2004, 12, 128–130 CAS.
  19. X. Y. Ji, D. L. Chen, T. Wei, X. H. Lu, Y. R. Wang and J. Shi, Chem. Eng. Sci., 2001, 56, 7017–7024 CrossRef CAS.
  20. C. Liu, X. Lu, G. Yu, X. Feng, Q. Zhang and Z. Xu, Mater. Chem. Phys., 2005, 94, 401–407 CrossRef CAS PubMed.
  21. C. Liu, M. He, X. Lu, Q. Zhang and Z. Xu, Cryst. Growth Des., 2005, 5, 1399–1404 CAS.
  22. N. Bao, L. Shen, X. Feng and X. Lu, J. Am. Ceram. Soc., 2004, 87, 326–330 CrossRef CAS PubMed.
  23. X. H. Lu and G. Maurer, AIChE J., 1993, 39, 1527–1538 CrossRef CAS PubMed.
  24. H. Bashiri, J. Phys. Chem. C, 2011, 115, 5732–5739 CAS.
  25. W. Plazinski and W. Rudzinski, Langmuir, 2009, 25, 298–304 CrossRef CAS PubMed.
  26. J. K. Lee, K. H. Lee and H. Kim, J. Mater. Sci., 1996, 31, 5493–5498 CrossRef CAS.
  27. H. Harada, Y. Kudoh, Y. Inoue and H. Shima, J. Ceram. Soc. Jpn., 1995, 103, 155–161 CrossRef CAS.
  28. M. He, X. Feng, X. H. Lu, X. Y. Ji, C. Liu, N. Z. Bao and J. W. Xie, J. Mater. Sci., 2004, 39, 3745–3750 CrossRef CAS.
  29. F. Cheng, Y. Bai, C. Liu, X. Lu and C. Dong, Ind. Eng. Chem. Res., 2006, 45, 6266–6271 CrossRef CAS.

This journal is © The Royal Society of Chemistry 2015
Click here to see how this site uses Cookies. View our privacy policy here.