Jatrorrhizine hydrochloride potentiates the neuraminidase inhibitory effect of oseltamivir towards H7N9 influenza
Ye Wanga,
Miao Yub,
Xiaonan Wangc,
Xin Zhangd,
Xizhu Wangb and
Xuexun Fang*b
aSchool of Life Science, Jilin University, 2699 Qianjin Street, Changchun 130012, China
bKey Laboratory for Molecular Enzymology and Engineering of Ministry of Education, Jilin University, 2699 Qianjin Street, Changchun 130012, China. E-mail: fangxx@jlu.edu.cn; Fax: +86-431-85155249; Tel: +86-431-85155249
cThe Second Affiliated Hospital of Mudanjiang Medical College, 3 Xiaoyun Street, Mudanjiang 157009, China
dDepartment of Pharmacy, The First Affiliated Hospital of Jilin University, 71 Xinmin Street, Changchun 130021, China
First published on 23rd July 2015
Abstract
A Chinese natural product, jatrorrhizine hydrochloride (JH), exhibited a potent inhibitory effect toward neuraminidase of the H7N9 (N9) avian influenza virus. The interaction between JH and N9 was modeled using the molecular docking software AutoDock. Similar to the control drug oseltamivir, JH bound into the active site of N9, but its position did not overlap with the position of oseltamivir. In addition, JH and oseltamivir were simultaneously docked into the active site of N9s (N9WT and N9R294K). By analyzing the docking result of the binding position, hydrogen bond interaction, and pi–pi interaction, N9 inhibition was likely enhanced by the combination of JH and oseltamivir. Molecular dynamics simulations using GROMACS were used to obtain trajectories of N9s and two compound complexes (JH was chosen from the docking result, whereas oseltamivir was directly extracted from the crystal structure) and to validate key interactions. The coordination between JH and oseltamivir to inhibit neuraminidase activity was further confirmed by the enzymatic assays of N9s. This study introduces novel treatment strategies to target N9 for a potential anti-H7N9 influenza drug.
1. Introduction
In 2013, a novel reassortant avian influenza A (H7N9) virus in China was identified, accompanied with substantial morbidity and mortality.1 Avian influenza is a sub-type of influenza viruses that has been detected in birds in the past. This particular virus had not been previously seen in either animals or people until it was found in March 2013 in China.2 A total of 602 cases of human infection with avian influenza virus have been confirmed, including 227 deaths up to 3 March 2015.3 Influenza caused by influenza virus is an acute respiratory infection that infects millions of people every year. According to its antigenic and genic characteristics, three genera of influenza virus exist: A, B, and C.4 Given that H7N9 is a novel sub-type of influenza A virus, no corresponding vaccination, which is always regarded as the most effective therapy to prevent influenza, is currently available.Influenza viruses are further divided into sub-types according to the specific variety and combinations of two proteins, hemagglutinin (HA) and neuraminidase (NA), that occur on the surface of the virus.5 HA mediates the process of viral entry into the host cells.6 NA, also called sialic acid enzyme, is a glycoprotein distributed in the influenza virus membrane. NA plays a crucial role in the life cycle of the influenza virus as it cleaves sialic acid receptor from the cell surface and facilitates the release of progeny virions from the infected host cells.7 Therefore, the inhibition of influenza virus NA potentially blocks influenza virus infection. NA has been the most potential target for anti-influenza drugs because of its importance in the pathogenesis of influenza virus infection.8 Two antiviral drugs, namely, oseltamivir and zanamivir, target NA and are currently prescribed for the prophylaxis and treatment of influenza infections.
Although oseltamivir and zanamivir are the best drugs for the prophylaxis and treatment of influenza infections, the emergence of drug-resistant variants is a major problem in antiviral therapy.9 The NA-R292K mutation has been isolated from (A/Shanghai/1/2013) H7N9 influenza virus. Viruses with this mutation cause reduced sensitivity to oseltamivir and zanamivir. More researchers utilize two or more drugs against this drug-resistant mutant. For instance, Galabov et al. found that rimantadine and oseltamivir demonstrate a synergistic combination effect in mice infected with H3N2 virus.10 Nguyen et al. studied a triple combination of amantadine, ribavirin, and oseltamivir treated in vitro against drug-resistant influenza virus strains, and the synergistic effects of combined treatment are highly effective in vitro.11
In recent years, Chinese natural products (CNPs) have been increasingly reported to show anti-influenza virus activities.12,13 CNPs have been the mainstay of traditional medicine for thousands of years. The advantage of CNPs is their innate affinity to biological receptors, which makes them effective targets for drug development.8 Therefore, CNPs may provide a valuable source of lead compounds for anti-influenza activities, and their inhibitory effects toward NA need to be systematically analyzed.
Computer-based modeling methodology has been increasingly used to explore the inhibitory mechanism of an inhibitor and development of new drugs. Compared with traditional drug development, the cost of development would decrease in this new method, and the drug development cycle would be drastically reduced. Two common medicines, oseltamivir and zanamivir, which are based on the crystal structure of NA, have been designed.13,14
In the present study, the inhibitory activity of JH to NA of H7N9 (N9) was detected by calculating the half maximal inhibitory concentration (IC50). N9 inhibition was enhanced by the combination of JH and oseltamivir. Through molecular simulation, both compounds were found to bind at the active sites and be non-superposed. Molecular dynamics (MD) study detected the stability of N9 compounds. All data were consistent with the enzymatic experiment results in vitro. This work provided the approach to optimize and design N9 inhibitors and to develop novel drugs for the treatment of influenza.
2. Materials and methods
2.1 Reagents
2-(N-Morpholino)ethanesulfonic acid (MES, >99%) and 2′-(4-methylumbelliferyl)-α-D-N-acetylneuraminic acid sodium salt hydrate (MU-NANA, CAS No. M8639) were used. The NAs of H1N1 (A/New Caledonia/20/1999) and H3N2 (A/Fujian/411/2002) were obtained from Changchun Institute of Biological Products. N9s (A/Anhui/1/2013 and A/Shanghai/1/2013) were purchased from Sino Biological Inc. Chemical reagents were purchased from Beijing Chemical Works.2.2 Compounds from CNPs
A total of 300 compounds (analytic reagent), which are ingredients of CNPs, were purchased from Beijing Chemical Works. Each compound was dissolved in DMSO with a final concentration of 20 mmol L−1 and then stored in 96-well plates numbered α, β, γ, and δ at −80 °C.2.3 NA activity assay
NA was assayed with MU-NANA using the method of Potier et al.15 The supernatant of allantoic fluid was first dissolved in pH 6.5 MES buffer (32.5 mM) containing 4 mM CaCl2. For NA inhibition assay, 49 μL of supernatant was incubated with 1 μL of compound in concentration gradient at 37 °C for 30 min in a black ELISA plate. The N9s were dissolved at 0.02 U in MES buffer (32.5 mM, pH 6.5) containing 4 mM CaCl2. About 49 μL of dissolved N9 was added into the black 96-well plate and incubated with 0, 50, 100, 150, 200, and 250 μM compounds at 37 °C for 30 min. Subsequently, 50 μL of 20 μM MU-NANA substrate solution was added. Florescence intensity was quantified using a FLX800 fluorescence micro-plate reader (Bio-Tek) with excitation and emission wavelengths at 360 and 450 nm, respectively. The detection lasted for 8 min. The natural control (NC) was reacted without compounds, and IC50 was determined as the concentration of the detected compound to reduce N9 activity by 50% relative to the NC. All measurements were replicated in three independent experiments.2.4 Docking
To estimate the potential interaction and conformation of the protein–ligand complex, the compound was docked into the N9 protein using AutoDock 4.2 program16 based on the Lamarckian genetic algorithm.17 The crystal structures of N9WT (PDB ID: 4MWQ_A) and N9R294K (PDB ID: 4MWW_A) were obtained from the RCSB Protein Data Bank (http://www.rcsb.org/pdb). A receptor file was prepared by removing the water molecules and the original bound ligand (oseltamivir) in the active site of the structure file. The ligand structure of N9 and oseltamivir (Fig. 1A) was also separated from the PDB file. The 3D structure of JH (Fig. 1B) was obtained from PubChem (CID: 21115138). The predicted complexes were optimized and ranked according to the empirical scoring function, ScreenScore, which estimates the free binding energy of the ligand–receptor complex.18 Each docking was performed twice, and each operation screened 250 conformations for the protein–ligand complex that were advantageous for docking. Each docking had 500 preferred conformations. The most stable conformation was distinguished, which had the minimal binding energy, was shown in a Discovery Studio 3.5 Visualizer.192.5 MD simulations
MD simulations were performed using GROMACS version 4.6.527 with the GROMOS96 43a1 force field. The JH conformation was chosen for the simulations based on its AutoDock 4.2 binding score. Ligand parameters, including atom type and partial charges, were acquired with PRODRG 2.5, an automated server for topology generation.20 The N9 protein structure was obtained in the same manner as described in the molecular docking experiments, with the H atom ignored for the simulation. The N9–JH complex was centered in separate cubic boxes and solvated using the SPC216 water model.21 No additional ions were needed for the system to achieve electroneutrality, because the protein had a total charge of 0.000e. Short-range non-bonded interaction cut-offs were set to 1.0 nm, whereas the Particle Mesh Ewald22 algorithm was executed as the coulomb type to calculate long-range electrostatics. The steepest descent minimization removed improper atom contacts. Convergence was achieved when a maximum force of less than 1000 kJ mol−1 nm−1 resided on any atom. Sequentially, a two-step equilibration phase was used to independently simulate both constant volume and constant pressure ensembles with 500 ps until the system became well-equilibrated at the desired temperature and pressure. Following equilibration, MD simulations were conducted for 50 ns using the same conditions as described. The system stability and differences in the trajectories, root mean square deviation (RMSD), and root mean square fluctuations (RMSF) were analyzed using tools available in the GROMACS package.2.6 Combination index (CI) to determine combined JH and oseltamivir interactions against N9s
CI was calculated to determine the interactions between JH and oseltamivir. CI analysis provides qualitative information on drug interaction. Its value was calculated as follows:
 | (A) |
In accordance with the IC50 value of JH and oseltamivir against N9s, the concentrations of the combined drugs were determined at 0.5, 0.75, 1, 1.25, and 1.5 times of the respective IC50. The ratio was constant and equal to the ratio between the IC50 value of the two drugs. About 30 μL of dissolved N9s containing 0.02 U was added into a black 96-well plate. After N9s were added, two treatment methods were performed. First, the concentration of 10 μL of JH was added at 37 °C, and each concentration was repeated three times. After 30 min, 10 μL of oseltamivir in constant proportional concentration was added at 37 °C for 30 min. Second, the concentration of 10 μL of oseltamivir was added at 37 °C for 30 min. Each concentration was repeated three times, and 10 μL of the constant ratio concentration of JH was added at 37 °C for 30 min. About 50 μL of 20 μM MU-NANA substrate solution was added. Fluorescence intensity was detected by N9 activity assay.
3. Results and discussion
3.1 JH inhibits N9 activities
NA is one of the two glycoproteins on the influenza virus surface. Given the importance of NA in locating host cells and replicating the influenza virus, it is regarded as the most important target to screen novel drugs. In 2013, H7N9 led to numerous deaths, as well as high morbidity and mortality, in China. CNPs play a crucial role against swine influenza in China. In this study, about 300 CNPs were screened to detect whether the compounds inhibit NA activities of N1 and N2 (Table 1). The NA of influenza A has been divided into two different groups, known as group 1 (N1, N4, N5, and N8) and group 2 (N2, N3, N6, N7, and N9), based on their primary nucleotide sequences. This study aimed to find a compound that can inhibit N9 activity. The JH (Table 1, plate no. F6) that had inhibitory effect against N9s was selected according to the inhibitory rate. Fig. 2 shows that JH inhibited N9s in a dose-dependent manner. The IC50 values for JH were 176.01 ± 1.91 and 235.32 ± 5.24 μM against N9WT and N9R294K, respectively (Table 2).| Well no. plate γ | IC50 value towards NA from influenza virus H1N1 (μM) | IC50 value towards NA from influenza virus H3N2 (μM) |
|---|---|---|
| A2 | ≥200 | ≥200 |
| B9 | ≥200 | ≥200 |
| B10 | 154.95 ± 14.02 | ≥200 |
| B11 | ≥200 | ≥200 |
| C2 | ≥200 | ≥200 |
| C5 | ≥200 | ≥200 |
| E10 | 196.63 ± 18.84 | ≥200 |
| F6 | 120.40 ± 20.07 | 193.40 ± 21.70 |
| F7 | ≥200 | ≥200 |
| G5 | 144.56 ± 26.69 | ≥200 |
| H5 | ≥200 | ≥200 |
| N9WT | N9R294K | |
|---|---|---|
| JH | 176.01 ± 1.91 μM | 235.32 ± 5.24 μM |
| Oseltamivir | 3.15 ± 1.71 nM | 29.15 ± 2.50 μM |
3.2 Molecular docking
| Receptor/ligand | Energy (kcal mol−1) | Receptor + ligand1/ligand2 | Energy (kcal mol−1) |
|---|---|---|---|
| N9WT/oseltamivir | −7.35 | N9WT + JH/oseltamivir | −8.01 |
| N9R294K/oseltamivir | −5.91 | N9R294K + JH/oseltamivir | −6.79 |
| N9WT/JH | −5.55 | N9WT + oseltamivir/JH | −6.26 |
| N9R294K/JH | −5.52 | N9R294K + oseltamivir/JH | −6.42 |
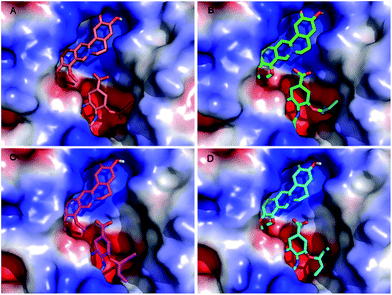
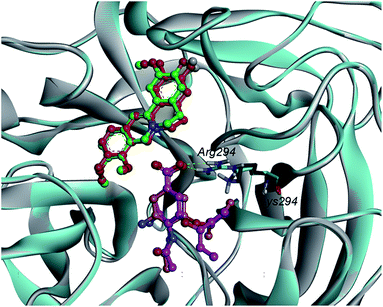
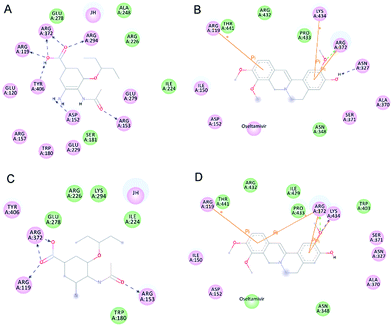
Hydrogen bonds formed between the compound and protein usually contribute to the stability of the substrate–enzyme complexes, and more hydrogen bonds form a growing stable complex. Tables 4 and 5 show the parameters of the complexes. Molecular docking results revealed that oseltamivir formed six hydrogen bonds with N9WT and only formed four with N9R294K. As shown in Fig. 5, the N atom of the guanidine group in Arg294 of N9WT formed two hydrogen bonds with the O atom of carboxylic acid in oseltamivir. Meanwhile, the amine group in Lys294 of N9R294K was changed instead of the guanidine group, in which shaped hydrogen bonds with oseltamivir were absent. Consequently, the position was changed in a way that N9R294K mutant conformation also missed the opportunity of carboxylic oxygen in Glu120 to form hydrogen bonds with amino nitrogen in oseltamivir. Fig. 6 illustrates the details of the binding mode. The results showed that the binding force of oseltamivir with N9R294K was weaker than that with N9WT. Interestingly, JH formed an identical number of hydrogen bonds with both N9WT and N9R294K. The residues of Asn327, Arg372, and Lys434 of N9s were considered important in the hydrogen bond interaction (Table 5). However, the JH–N9R294K complex (four) formed one more pi–pi interaction than JH–N9WT complex (three), resulting in weaker binding energy of JH to the N9WT complex (−6.26 kcal mol−1) than to the JH–N9R294K complex (−6.42 kcal mol−1). The residues of Arg119, Arg372, and Lys434 of N9s were identified to be important amino acids with strong pi–pi interaction (Table 6).
| Donors atom | Receptor atom | Distances (Å) | |
|---|---|---|---|
| N9WT | Arg119:NH1 | ose:O1A | 2.83 |
| Arg153:NH1 | ose:O10 | 2.91 | |
| Arg294:NH2 | ose:O1B | 3.20 | |
| Arg372:NH1 | ose:O1A | 2.12 | |
| Arg372:NH2 | ose:O1B | 2.63 | |
| ose:N4 | Glu120:OE2 | 3.13 | |
| N9R294 | Arg119:NH1 | ose:O1A | 2.75 |
| Arg153:NH1 | ose:O10 | 2.84 | |
| Arg372:NH1 | ose:O1A | 2.74 | |
| Arg372:NH2 | ose:O1B | 2.58 |
| Donors atom | Receptor atom | Distances (Å) | |
|---|---|---|---|
| N9WT | Arg372:N | JH:O4 | 2.76 |
| JH:H17 | Asn327:OD1 | 2.31 | |
| N9R294 | Arg372:N | JH:O4 | 2.78 |
| Lys434:NZ | JH:O4 | 2.95 |
| End1 | End2 | Distances (Å) | |
|---|---|---|---|
| N9WT | JH | Arg119:NH2 | 5.33 |
| JH | Arg372:NH2 | 4.51 | |
| JH | Lys434:NZ | 4.57 | |
| N9R294 | JH | Arg119:NH2 | 5.24 |
| JH | Arg372:NH1 | 4.71 | |
| JH | Arg372:NH2 | 4.91 | |
| JH | Lys434:NZ | 3.77 |
Upon analyzing the binding position, hydrogen bond interaction, and pi–pi interaction of JH, no obvious difference between wild-type and mutant-type N9 was observed when combined with oseltamivir.
3.3 MD trajectories
To gain insight into the stability of the binding complex, explicit solvent MD simulations were performed using the GROMACS program. The starting ligand binding pose of JH was taken from the AutoDock molecular docking result, choosing the more optimal conformation, whereas the starting pose of oseltamivir was directly extracted from the crystal structure. Both compounds (JH and oseltamivir) should be added when the complex and topology files were built at step two “Prepare the Ligand Topology.” The RMSD values of the N9 inhibitor complex and N9 control are shown in Fig. 7. The results of MD simulation suggested that all N9 structures were stable in aqueous solution during 50.0 ns, and the RMSD of the Cα atoms immediately reached a plateau. The average RMSD trajectory values were below 0.30 nm for N9 with the inhibitor retained in the binding cavity. Furthermore, to estimate the structural flexibility of the N9 inhibitor complex and N9 control, the mean RMSF values (Fig. 8A and B) were calculated, and the flexible regions (peaks in the plot) of N9 were observed. All the catalytically important residues, including hydrogen bonds and pi–pi interaction forming residues, were very stable throughout the simulation in all systems, with or without inhibitors. As shown in Fig. 8C and D, the residues significantly fluctuated (color red) when inhibitors were bound, and the flexible residues were all present at the surface, far away from the active site of protein. The MD trajectories were within expectations, because the stability of this complex throughout the duration of the simulation gives credence to the proposed binding orientation in the pose space.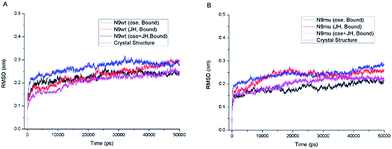 | ||
| Fig. 7 RMSD plot during 50 ns simulation of protein–inhibitors complex and protein alone. Protein were (A) N9WT; (B) N9R294. | ||
3.4 CI of JH and oseltamivir against N9s
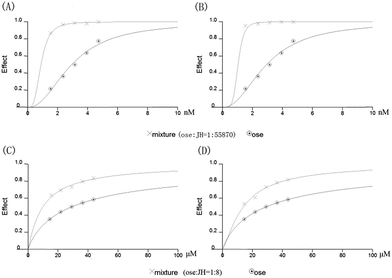
N9 was mixed with JH or oseltamivir to detect the inhibitory rate, and JH and oseltamivir could inhibit N9s in a dose-dependent manner. In Table 2, the IC50 values were 176.01 ± 1.91 and 235.32 ± 5.24 μM for JH against N9WT and N9R294K, respectively. By contrast, the IC50 values were 3.15 ± 1.71 nM and 29.15 ± 2.50 μM for oseltamivir against N9WT and N9R294K, respectively. The IC50 value increased by approximately 1.34 times for JH for wild-type N9 to oseltamivir-resistant mutant, but it increased by approximately 9000 times for oseltamivir.The CI values are presented in Table 7. Regardless of N9WT or N9R294K, treatment method 1 was better than treatment method 2, which suggested that prior JH incubation was more effective than adding oseltamivir first. Treatment method 1 was slightly better than treatment method 2 against N9WT, whereas the interactions of JH and oseltamivir were significantly synergistic. However, for N9R294K, the interactions of the two drugs showed less synergism compared to N9WT with treatment method 1. In treatment method 2, the interactions only showed an additive effect and minimal antagonism. Similar results are also shown in Fig. 9. Regardless of N9WT or N9R294K, the inhibitory effect was enhanced when JH was added under the same oseltamivir concentration.
| N9WT CI value at | N9R294K CI value at | |||||
|---|---|---|---|---|---|---|
| ED50 | ED75 | ED90 | ED50 | ED75 | ED90 | |
| TM1 | 0.62637 | 0.49752 | 0.39604 | 0.66446 | 0.89675 | 1.36938 |
| TM2 | 0.73278 | 0.51102 | 0.35714 | 1.00899 | 1.03956 | 1.21187 |
4. Conclusions
A novel anti-influenza strategy that targets NA has been described in this paper. JH with inhibitory activity of NA was detected from CNPs. Although the inhibition of JH to N9s was less important than that of oseltamivir, no significant differences were recorded between the wild-type and mutant-type N9. Using the molecular docking software AutoDock, the compounds (JH and oseltamivir) were bound at the active site of N9s. Docking results demonstrated that JH and oseltamivir were not superposed, and sufficient space was present in the active pocket to accommodate both compounds. The estimated free binding energy calculated in this study showed that N9 inhibition was enhanced by the combination of JH and oseltamivir. Through MD simulations via GROMACS, these interactions were consistent throughout the 50 ns simulation without major fluctuations of the ligands within the binding cavity. As mentioned above, the combination effect of two or more compounds could prevent drug resistance. Subsequently, the combination effect of JH and oseltamivir with N9s was studied. Regardless of N9WT or N9R294K, the inhibitory effect was enhanced when JH was combined with oseltamivir. This work can be thoroughly expanded to develop novel anti-influenza therapy. The success achieved by combining JH with oseltamivir and docking them into N9s, which led to increased inhibition and less drug resistance, paves the way for future work to utilize ligand docking experiments by screening a new virtual library of compounds.Acknowledgements
The authors gratefully acknowledge financial support from Science and Technology Department of Jilin Province (grant No. 20150520153JH), China; Science and Technology Department of Jilin Province (grant No. 20130206066YY), China; National Natural Science Foundation of China (Grant No. 31170742); and the National Science Foundation of China (grant No. 31370742).Notes and references
- WHO, China—WHO Joint Mission on Human Infection with Avian Influenza A(H7N9) Virus, http://www.who.int/influenza/human_animal_interface/influenza_h7n9/ChinaH7N9JointMissionReport2013u.pdf?ua=1.
- WHO, Avian influenza A(H7N9) virus, 2013, available from: http://www.who.int/influenza/human_animal_interface/influenza_h7n9/en/.
- WHO, Influenza at the human-animal interface, available from: http://www.who.int/influenza/human_animal_interface/Influenza_Summary_IRA_HA_interface_3_March_2015.pdf.
- P. Palese and J. F. Young, Science, 1982, 215, 1468–1474 CAS.
- WHO, Influenza virus infections in humans, February 2014, available from: http://www.who.int/influenza/human_animal_interface/virology_laboratories_and_vaccines/influenza_virus_infections_humans_feb14.pdf.
- D. C. Wiley and J. J. Skehel, Annu. Rev. Biochem., 1987, 56, 365–394 CrossRef CAS PubMed.
- J. L. McKimm-Breschkin, Antiviral Res., 2000, 47, 1–17 CrossRef CAS.
- Y. Wang, D. Wu, D. Yu, Z. Wang, L. Tian, Y. Wang, W. Han and X. Fang, J. Mol. Model., 2012, 18, 3445–3453 CrossRef CAS PubMed.
- A. U. Khan, S. Shakil and S. K. Lal, Indian J. Microbiol., 2009, 49, 370–376 CrossRef CAS PubMed.
- A. S. Galabov, L. Simeonova and G. Gegova, Antiviral Chem. Chemother., 2006, 17, 251–258 CrossRef CAS PubMed.
- J. T. Nguyen, J. D. Hoopes, M. H. Le, D. F. Smee, A. K. Patick, D. J. Faix, P. J. Blair, M. D. De Jong, M. N. Prichard and G. T. Went, PLoS One, 2010, 5, e9332 Search PubMed.
- Y. Li, K.-T. Leung, F. Yao, L. S. Ooi and V. E. Ooi, J. Nat. Prod., 2006, 69, 833–835 CrossRef CAS PubMed.
- J. N. Varghese, J. L. McKimm-Breschkin, J. B. Caldwell, A. A. Kortt and P. M. Colman, Proteins: Struct., Funct., Bioinf., 1992, 14, 327–332 CrossRef CAS PubMed.
- C. L. White, M. N. Janakiraman, G. W. Laver, C. Philippon, A. Vasella, G. M. Air and M. Luo, J. Mol. Biol., 1995, 245, 623–634 CrossRef CAS.
- M. Potier, L. Mameli, M. Belisle, L. Dallaire and S. Melancon, Anal. Biochem., 1979, 94, 287–296 CrossRef CAS.
- G. M. Morris, R. Huey, W. Lindstrom, M. F. Sanner, R. K. Belew, D. S. Goodsell and A. J. Olson, J. Comput. Chem., 2009, 30, 2785–2791 CrossRef CAS PubMed.
- G. M. Morris, D. S. Goodsell, R. S. Halliday, R. Huey, W. E. Hart, R. K. Belew and A. J. Olson, J. Comput. Chem., 1998, 19, 1639–1662 CrossRef CAS.
- R. Huey, G. M. Morris, A. J. Olson and D. S. Goodsell, J. Comput. Chem., 2007, 28, 1145–1152 CrossRef CAS PubMed.
- Discovery Studio Visualizer 3.5, Accelrys Software Inc, 2012 Search PubMed.
- A. W. SchuÈttelkopf and D. M. Van Aalten, Acta Crystallogr., Sect. D: Biol. Crystallogr., 2004, 60, 1355–1363 CrossRef PubMed.
- B. Pullman, Intermolecular Forces: Smposium Proceedings, D. Reidel Publishing Company, Dordrecht, 1981, pp. 331–342 Search PubMed.
- T. Darden, D. York and L. Pedersen, J. Chem. Phys., 1993, 98, 10089–10092 CrossRef CAS PubMed.
| This journal is © The Royal Society of Chemistry 2015 |


