Sonochemical synthesis of cyclophosphazene bridged mesoporous organosilicas and their application in methyl orange, congo red and Cr(VI) removal

Pawan Rekha, Raeesh Muhammad and Paritosh Mohanty*
Department of Applied Science & Engineering, Indian Institute of Technology Roorkee, Saharanpur Campus, Saharanpur-247001, India. E-mail: paritosh75@gmail.com; Fax: +91-132-271-4311; Tel: +91-132-271-4338

Received 17th June 2015 , Accepted 3rd August 2015

First published on 3rd August 2015


Abstract

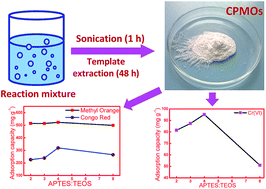
A rapid sonochemical route was adopted for the synthesis of cyclophosphazene bridged mesoporous organosilicas (CPMOs) by co-condensation of (3-aminopropyl)triethoxysilane (APTES) and phosphonitrilic chloride trimer (PNC) with variable amounts of tetraethyl orthosilicate (TEOS) in the presence of cetyltrimethylammonium bromide (CTABr). The products were formed as early as 15 min, however, the experiments were carried out for 1 h for better condensation and aging. The specific surface areas of the specimens were a function of the APTES to TEOS ratio and varied in the range of 58 to 974 m2 g−1. The pore size distribution of these specimens was centred around 1.4 to 3.7 nm. These CPMOs were employed for the adsorption of organic dyes such as methyl orange (MO) and congo red (CR) as well as Cr(VI) ions. Adsorption studies were carried out in aqueous solution by varying the contact time, initial dye concentration, and temperature. The equilibrium data were fitted using the Langmuir and Freundlich isotherm by linear regression analysis. The kinetic analysis revealed that the overall adsorption process was pseudo-second-order. The maximum adsorption capacities were 523 mg g−1, 320 mg g−1 and 101 mg g−1 for MO, CR and Cr(VI) ions, respectively at 25 °C. The adsorption was a spontaneous exothermic process with negative ΔG and ΔH derived from the thermodynamics studies.


Introduction

After the pioneering work by three research groups in 1999,1–3 the development of periodic mesoporous organosilicas (PMOs) has received tremendous attention owing to their wide spread applications from catalysis, light harvesting, sensing, imprinting, gas sorption, hosts for drug and biomolecules, chromatographical phase to different environmental applications.4–9 The incorporation and homogeneous distribution of a large numbers of organic moieties such as, ethylene, methylene, phenylene, ethylbenzene, thioether, biphenyl, divinylbenzene, porphyrin, acridone and their derivatives4–9 of late, has made this class of material one of the very important nanoporous materials categories. The most common strategy used for the synthesis of PMOs was the hydrolysis of the silsesquioxane precursors in the presence of the structure directing agents followed by condensation and aging.4–9 These processes are slow and normally require several hours to days. A lot of research has been devoted to decrease the experimental time which is very much beneficial both in the energy and environmental perspectives. Among the various strategies adopted to decrease the experimental time, microwave and ultrasound assisted methods were more popular as these yield products at much less time without compromising the quality.10–18 Smeulders et al. reported microwave assisted synthesis of benzene bridged PMOs with the shorter experimental time of 5 h. Microwave irradiation was used for the hydrothermal step of the already hydrolyzed and polycondensed products.10 Jaroniec and co-workers have reported the ethane and disulfide bridged PMOs by microwave assisted method with the experimental time of 10 to 72 h.11 However, the limitations associated with the microwave assisted approach was taking special care for handling the vessels at high temperature and pressure.12

Suslick and coworkers for the first time used ultrasound irradiation for the synthesis of nanostructured materials.19,20 The chemical effect of ultrasound is due to acoustic cavitation which create high temperature (20[thin space (1/6-em)]000 K) and pressure (100 MPa) locally combined with rapid cooling rate (1012 K s−1) without practically increasing the pressure or temperature substantially in the reaction mixture.13–17 Although, sonochemistry has been used by several research groups to synthesize mesoporous silica,13,15,17 but its use in the synthesis of PMOs is limited.14,16,18 Mohanty et al. for the first time reported the ultarafast sonochemical synthesis of methane and ethane bridged PMOs with total experiment time of 1 h (30 min for synthesis and 30 min for template extraction) using CTABr.18 Kao and co-workers used similar ultrasound irradiation method to synthesize benzene bridged mesoporous organosilicas with a total synthesis time of 4 h.14 The same group recently reported a substantial decrease in the reaction time to 5 min by co-condensing 1,4-bis(triethoxysilyl) benzene (BTEB) with TEOS.16

As discussed above, various research groups have reported the introduction of different organic moieties into the PMO networks.4–9 However, the introduction of phosphorus–nitrogen (P–N) units into the PMOs was not extensively studied.21,22 Barbosa et al. for the first time reported the organocyclotriphosphazenes encapsulated in a silica matrix which can be used for analytic purposes.22 However, silicon-phosphorus nanostructured materials show very low specific surface area as low as 3 to 3.2 m2 g−1.22 In this investigation, phosphonitrilic chloride trimer (PNC) was chosen as cyclophosphazene source. The cyclophosphazene derivatives have very interesting paddle wheel structures which could provide a rigid framework with permanent porosity. Recently, our group have demonstrated the substantial improvement of the textural properties by introducing the cyclophosphazene units into the frameworks.23 More over, the presence of six P–Cl sites in PNC provide broad range of functionalized dendrimers and macrocyclic compounds by nucleophilic substitution reactions of the chloro group. The phosphazene and cyclophosphazene-based materials have number of applications in various fields due to their excellent thermal properties, biocompatibility, and biodegradability.24,25

With the increase in the industrialization, there was a drastic increase in the pollutants in the ground water. Both synthetic organic dyes and heavy metals are major contributor for this ground water pollution, which is a big concern for the environment. The textile, printing, paper, coating and leather industries contain large amount of these pollutants. Even at very low concentration, these pollutants are highly toxic and have carcinogenic and mutagenic effect on both flora and fauna.26,27 Thus, the removal of these pollutants from industrial effluents have attracted the attention of the researchers. Photo-degradation, ion-exchange, sedimentation, solvent extraction, coagulation, flocculation, biological treatment, membrane separation and adsorption are the some of the recently investigated technologies.26–28 Among these, adsorption of these pollutants by solid porous adsorbents seems more feasible, versatile, efficient, economical and very importantly free from secondary pollutants.29,30

In this article, we report the sonochemical synthesis of cyclophosphazene bridged mesoporous organosilicas. These high surface area cyclophosphazene bridged mesoporous organosilicas (CPMOs) were then used for removal of organic dyes and Cr(VI) ions in aqueous solutions.

Experimental

Chemicals

PNC (99%, Sigma-Aldrich), APTES (98%, Alfa Aesar), TEOS (98%, Sigma-Aldrich), CTABr (Himedia), NaOH (Fisher Scientific), methanol (Rankem), HCl (Himedia), MO (Rankem), CR (Rankem), and K2Cr2O7 (Fisher Scientific) were used as they received without any further purification.

Synthesis of cyclophosphazene bridged mesoporous organosilicas (CPMOs)

For the synthesis of CPMOs, 2.62 g CTABr and 0.576 g NaOH were dissolved in 108 g distilled water in 125 ml polypropylene bottle. To the above solution, calculated amount of TEOS was added. A solution of APTES and PNC was added drop wise to the above solution. The molar ratios were kept at PNC[thin space (1/6-em)]:[thin space (1/6-em)]APTES[thin space (1/6-em)]:[thin space (1/6-em)]TEOS[thin space (1/6-em)]:[thin space (1/6-em)]CTABr[thin space (1/6-em)]:[thin space (1/6-em)]NaOH[thin space (1/6-em)]:[thin space (1/6-em)]H2O = 0.16[thin space (1/6-em)]:[thin space (1/6-em)]1[thin space (1/6-em)]:[thin space (1/6-em)]x[thin space (1/6-em)]:[thin space (1/6-em)]7.2[thin space (1/6-em)]:[thin space (1/6-em)]14.4[thin space (1/6-em)]:[thin space (1/6-em)]6000, where x is the amount of TEOS (x = 0, 2, 3, 4, 8). The resulting reaction mixture was sonicated with an ultrasonic bath (Sonica 2200 MH S3, Spincotech Pvt. Ltd, Italy) at the power of 300 W. The precipitation starts as early as in 15 min and the experiment was carried out for 1 h. The product was filtered out and dried at 60 °C. The samples were designated as CPMO-xS (x = 0, 2, 3, 4, 8), where x is the TEOS content. The template was removed by refluxing the as-synthesized sample in a solution of 100 ml methanol and 10 ml 2 M HCl. The extracted specimens were designated as CPMO-xSR (x = 0, 2, 3, 4, 8).

Batch adsorption experiment

The aqueous solutions of MO and CR at different concentrations (50–1500 mg L−1) were prepared by dissolving respective dyes in distilled H2O. Batch adsorption experiments were conducted in 25 ml glass tube with 10 mg CPMOs and 10 ml of dye solution. Temperature was maintained at 25 °C throughout the adsorption experiment. The adsorption starts as soon as the dye solution comes in contact with the adsorbent CPMOs kept in the glass tube. The suspension was collected at different time intervals and the adsorbent was separated by centrifugation. The supernatant was used to estimate the dye concentration using UV-Vis spectrophotometer at the respective λmax (460 nm and 497 nm for MO and CR, respectively). The calibration curves were plotted following the Beer–Lambert's law. Preliminary adsorption experiments indicate that equilibrium was achieved in 1 h. Thus, the contact time of 1 h was selected in the batch experiments. All the adsorption experiments were averaged out with three concurrent readings. The maximum standard deviation calculated was less than 5%. The highly concentrated dye solutions were diluted before absorbance measurement. The adsorption was studied at different dye concentrations of 50 to 1500 mg L−1. The effect of contact time on adsorption capacity was calculated by collecting the samples at 5, 10, 15, 20, 25, 30, 45 and 60 min. Furthermore, the effect of temperature was studied by carrying out the adsorption at different temperatures from 293 K to 353 K. Similar batch experiments were conducted for the adsorption of Cr(VI) by the CPMOs.

The adsorption capacity and the % removal of the dyes and Cr(VI) were calculated using eqn (1) and (2);

 
image file: c5ra11622h-t1.tif(1)
 
image file: c5ra11622h-t2.tif(2)
where, q is the adsorption capacity (mg g−1), Co and Ce are the initial and equilibrium concentration of adsorbate in the test solution (mg L−1), V is the volume of test solution (L) and W is the weight of adsorbent (g).

Characterization

The 31P, 13C and 29Si cross polarization magic angle spinning (CPMAS) NMR spectra were recorded on JEOL resonance JNM-ECX-400II at 161.83 MHz (31P), 100 MHz (13C) and 79.42 MHz (29Si) with sample spinning frequency of 6, 10 and 6 kHz, respectively. Total number of scans for 31P, 29Si and 13C were 512, 512 and 1810, respectively. The spectrum two FT-IR spectrophotometer (Perkin-Elmer) was used to record FT-IR spectra in the range of 450 to 4000 cm−1 using KBr pellet. Small angle X-ray scattering (SAXS) was measured from 0.2 to 5° in 2θ scale with a scanning speed of 0.25° per min using a Rigaku Ultima IV with Cu-Kα radiation source (λ = 0.15405 nm). The TGA/DTG analysis were performed on EXSTAR TG/DTA 6300 in which the temperature was raised from 25 to 1000 °C at heating rate of 10 °C min−1 under N2 atm. The gas sorption studies were performed using Autosorb-iQ2 (Quantachrome Instruments). The samples were degassed at 120 °C for 6 h prior to analysis. The specific surface area (SBET) was estimated by applying BET model within pressure range of 0.05–0.30 P/P0. The pore size distribution (PSD) was calculated by DFT method. The pore volume was calculated from the uptake at a relative pressure of 0.99 cm3 g−1. The concentrations of the adsorbents were measured using the Shimadzu UV-1800 UV-Vis spectrophotometer. The elemental analyses of the samples were carried out by CHNS/O (Thermo scientific, Flash 2000) and ICP-OES (Teledyne Leemans lab, prodigy SPEC).

Results and discussion

Characterization of adsorbent

Cyclophosphazene moieties were incorporated into the organosilica frameworks (Scheme 1) by condensing a reaction mixture of PNC and APTES with TEOS in the presence of CTABr under ultrasonic irradiations for 1 h. In order to study the effectiveness of the sonochemistry to synthesize CPMOs with the cyclophosphazene moieties in the frameworks, the textural properties and chemical environment of the specimens were investigated. As mentioned above, only 1 h sonication time was enough to synthesize the CPMOs with the desired physicochemical properties. Two representative specimens CPMO-0SR (without TEOS) and CPMO-4SR (with TEOS) were investigated by CPMAS NMR spectroscopy as shown in Fig. 1. In both the specimens the incorporation of cyclophosphazene moieties in the frameworks was confirmed from the 31P CPMAS NMR spectroscopy (Fig. 1a).
image file: c5ra11622h-s1.tif
Scheme 1 Reaction scheme for the synthesis of CPMOs using sonochemistry.

image file: c5ra11622h-f1.tif
Fig. 1 (a) 31P (b) 13C and (c) 29Si CPMAS NMR spectra of CPMO-0SR and CPMO-4SR (* rotational side bands, # CTABr signal).

The 31P CPMAS NMR spectra (Fig. 1a) of CPMO-0SR have sharp singlets at 12.7 ppm. Similarly CPMO-3SR, CPMO-4SR and CPMO-8SR (Fig. S2) have singlet around 2 to 2.7 ppm indicating that all the phosphorus atoms are in magnetically equivalent environment. CPMO-0SR and CPMO-3SR have sharp singlet whereas in CPMO-4SR and CPMO-8SR there was a slight broadening of the signal. This broadening and shift in signal position could be attributed to co-condensation in presence of the TEOS which resulted in a different chemical environment. Furthermore, it is worth mentioning that the cyclophosphazene ring remain intact in the organosilica framework, otherwise, signal around −17 ppm could have been observed for open phosphazene chains.31 The observation of three sharp signals at 43, 22 and 10 ppm in the 13C CPMAS NMR spectra as shown in Fig. 1b of the CPMO-0SR and CPMO-4SR specimens confirm the condensation of the propyl units in the CPMOs. The signal at δ of 10 ppm is due to carbon directly attached to silicone because it is most shielded, whereas, carbon that is directly attached to nitrogen shows signal at δ of 43 ppm as it is least shielded and the signal at δ of 22 ppm is attributed to the middle carbon.32

The 29Si CPMAS NMR spectra in Fig. 1c further corroborate the results obtained from the 31P and 13C CPMAS NMR studies. Spectrum of CPMO-0SR has signal only from T sites whereas, the CPMO-4SR has signals both from the T and Q sites. It was well known that the signals observed from the T and Q sites are corresponding to the organosilicas and inorganic silicas, respectively.18,32,33 The 29Si CPMAS NMR signals shown in Fig. 1c were deconvoluted and % of T and Q sites were calculated from the area under the peak. The % of T sites in the framework of organosilica was 28.5% whereas % of Q sites was 71.5% which further confirms the ratio with minor deviation. The detailed assignments and % of the T and Q signals were given in Table S2.

The incorporation of cyclophosphazene in the frameworks of organosilicas was further studied by FT-IR spectroscopy (Fig. S1). The observation of bands around 1418 and 1209 cm−1 attributed to the νas (P[double bond, length as m-dash]N–P), and stretching vibration of P[double bond, length as m-dash]N confirm the presence of the cyclophosphazene moieties in the specimens.23,34,35 Some of the bands of P–N were obscured in the strong Si–O–Si bands observed between 1237 to 1050 cm−1.36 Another band at 555 cm−1 was attributed to δ (P[double bond, length as m-dash]N–P) vibrations.34 Intensity of the bands attributed to P–N ring decreases on increasing TEOS content further confirm the cyclophosphazene incorporation whereas, intensity of Si–O–Si bands increases on going from CPMO-0SR to CPMO-8SR. The observed bands below 3000 cm−1 were assigned to the C–H stretching vibration of propyl groups.34 The detailed assignment of the bands are given in Table S1.

The CHN results are summarized in Table S3. Considering the complete condensed and hydrolyzed form, the theoretical C/N ratio for CPMOs would be 1.7. The experimental C/N ratios were in good agreement with minor deviations due to the unhydrolyzed ethoxy groups which was also observed by other research groups.37 The C/N ratio sequentially decreases with increasing TEOS content which indicates complete hydrolysis of ethoxy group.37 All these specimens lack long range pore ordering as studied by SAXS patterns in Fig. S3.

The FESEM images of the two representative samples (CPMO-0SR and CPMO-4SR) were shown in Fig. 2a and b, respectively. Spherically agglomerated particles of size in the range of 500 nm to 1 μm could be seen in both the samples. Further the TEM investigation revealed that the CPMO-0SR sample is some how less porous than the CPMO-4SR as shown in Fig. 2c and d. The TGA/DTG thermograms were used to confirm whether the extraction method adopted in this investigation was appropriate to remove the CTABr. Fig. S4 shows TGA and DTG thermograms of CPMO-0S, CPMO-0SR, CPMO-4S and CPMO-4SR. The mass loss between 200 to 300 °C in the as-synthesized samples could be attributed to the decomposition of the CTABr.34 The absence of this mass loss step in the extracted sample confirm that the extraction was adequate for removing the CTABr.


image file: c5ra11622h-f2.tif
Fig. 2 FE-SEM images of (a) CPMO-0SR (b) CPMO-4SR, and TEM images of (c) CPMO-0 (d) CPMO-4SR.

Fig. 3 and S6 shows the N2 sorption isotherms of CPMOs measured at 77 K. The N2 sorption isotherm of the CPMO-3SR indicate type I isotherm with rapid uptake at low pressure attributed to the presence of micropores which was further confirmed by pore size distribution as shown in Fig. S5. In CPMO-0SR, CPMO-2SR, CPMO-3SR and CPMO-8SR, sharp uptake with hysteresis confirms the type-IV isotherm and the presence of mesopores.


image file: c5ra11622h-f3.tif
Fig. 3 N2 sorption isotherm of CPMOs measured at 77 K.

The pore size distribution calculated from the density functional theory (DFT) model further confirm the presence of both microporosity and mesoporosity in these samples (Fig. S5) with the majority of the pores are centred between 1.4 to 3.7 nm. The CPMO-4SR has a SBET of 900 m2 g−1 with a pore volume of 0.85 cm3 g−1. The CPMO-8 has the highest SBET of 974 m2 g−1 among all these samples. In order to further understand the effect of the cyclophosphazene moieties in the overall textural properties of the synthesized PMOs, a representative sample was synthesized under the experimental conditions similar to the CPMO-4SR without using PNC. The sample was designated as PMO-4S. As shown in Fig. S7, there was a substantial decrease in the SBET from 900 m2 g−1 in the CPMO-4SR to 583 m2 g−1 in PMO-4S, although both were made almost in identical conditions. This was mainly attributed to the paddle wheel structure of cyclophosphazene derivatives.23 More details about the physicochemical properties are given in Table 1. As shown in Fig. S8, the CPMOs also show decent CO2 capture capacity of upto 1.3 mmoL g−1 at 273 K and 1 atm.

Table 1 Gas sorption data of CPMOs
Sample ID SBET (m2 g−1) Pore width (nm) Pore volume (cm3 g−1) CO2 uptake (mmol g−1) (273 K)
CPMO-0SR 58 3.2 0.23 1
CPMO-2SR 305 2.6 0.21 0.8
CPMO-3SR 326 1.4 0.29 1.08
CPMO-4SR 905 3 0.85 1.2
CPMO-8SR 974 3.7 0.82 1.3


Adsorption of organic dyes and Cr(VI) ions

The extracted CPMOs were employed for studying their efficacy to adsorb anionic organic dyes (MO and CR) and Cr(VI) ions in the aqueous solution (Fig. S9). We have also tested the PMO-4S for the adsorption of MO, CR and Cr(VI). The quantitative comparison of adsorption capacities of the CPMOs is summarized in Table S4. Among all the CPMOs, the CPMO-4SR has shown the best adsorption capacity although, CPMO-8SR has the highest surface area (∼8% extra specific surface area). This may be attributed to the extra amine groups present in CPMO-4SR (twice amine groups as compared to CPMO-8). Thus, CPMO-4 has been chosen as the model adsorbent for studying the kinetics, thermodynamics and adsorption isotherms.

Effect of initial dye concentration

The adsorption capacity of the CPMO-4 was highly dependent on the initial concentration of the adsorbates as shown in Fig. 4. This was due to the availability of extra active sites at higher concentrations in the adsorbent to accommodate the adsorbates so that there could be greater mass transfer at high concentrations. For the MO, the adsorption capacity linearly increases from 91 mg g−1 to 674 mg g−1 at the initial concentration of 94 mg L−1 to 1000 mg L−1, respectively. On further increasing the initial MO concentration, the adsorption capacity only increases slightly indicating the equilibrium condition has achieved. Similarly for CR and Cr(VI) ions, adsorption capacity increase linearly up to 370 mg g−1 at 1000 mg L−1 and 95 mg g−1 at 100 mg L−1 respectively, after that it become almost constant.
image file: c5ra11622h-f4.tif
Fig. 4 Variation of adsorption capacity of (a) organic dyes, and (b) Cr(VI) removal on CPMO-4SR with initial adsorbate concentration.

Effect of initial contact time

As can be seen in the Fig. 5a, within first 5 min the adsorption capacity for MO and CR reaches as high as 518 and 284 mg g−1 with C0 of 560 and 600 mg L−1, respectively. On further increasing the contact time, the adsorption capacity only increases nominally to 523 and 320 mg g−1 for MO and CR, respectively, and the equilibrium has achieved at 60 min. Similarly for Cr(VI), the adsorption capacity of 90 mg g−1 was achieved within 5 min at C0 of 100 mg L−1 as shown in Fig. 5b. On further increasing the contact time, the adsorption capacity becomes almost constant and equilibrium was achieved in 60 min. The comparison of the maximum adsorption capacities of Cr(VI), MO and CR with reported literature is summarized in Table S5–S7.38–49
image file: c5ra11622h-f5.tif
Fig. 5 Variation of adsorption capacity of (a) organic dyes, and (b) Cr(VI) removal on CPMO-4SR with time.

Effect of temperature

The effect of temperature on the adsorption capacity was investigated in the temperature range of 293 to 353 K for all the adsorbate. As shown in Fig. 6, there was a slight decrease in adsorption capacity both for MO and CR, however, the decrease was substantial for Cr(VI) ions (from 95 mg g−1 at 298 K to 30 mg g−1 at 353 K). In all the cases, the adsorption was exothermic in nature and maximum adsorption capacity was achieved at 298 K.
image file: c5ra11622h-f6.tif
Fig. 6 Effect of temperature on adsorption capacity of (a) organic dyes and (b) Cr(VI) removal.

Adsorption isotherms

The adsorption data were fitted with both the Langmuir and Freundlich isotherm models to understand the adsorption processes. The Langmuir model was based on the monolayer adsorption with the homogeneous binding sites whereas, the Freundlich isotherm assumes the multilayered adsorption on a heterogeneous adsorbent surface. The linear form of Langmuir and Freundlich isotherms can be represented by eqn (3) and (4), respectively;38
 
image file: c5ra11622h-t3.tif(3)
 
image file: c5ra11622h-t4.tif(4)
where, qmax (mg g−1) is the theoretical maximum adsorption capacity, b is the Langmuir constant (L mg−1) which is related to the energy of adsorption, kf (mg g−1) is Freundlich coefficient that is related to the adsorption affinity of the adsorbent and n is the adsorption intensity of the adsorbent (L mg−1).

The Langmuir and Freundlich isotherms for the MO and CR were plotted in Fig. 7a and b, respectively, and for Cr(VI), these were plotted in Fig. 8. The values of b, qmax, kf and n were calculated from these isotherms and listed in Table 2. Based on the correlation coefficient (R2), the Freundlich isotherm model have a better fit for the adsorption of CR and Cr(VI) ions whereas, the Langmuir isotherm fits better for MO. This indicates that the same adsorbent behaves differently for the adsorption of different dyes and metal ions. The best fit in the Freundlich model suggests the multilayered coverage with heterogeneous sites on the surface of CPMO-4SR for CR and Cr(VI) ions. The MO that fitted best for the Langmuir model indicates the monolayer adsorption with homogenous sites on CPMO-4SR.


image file: c5ra11622h-f7.tif
Fig. 7 (a) Langmuir and (b) Freundlich adsorption isotherm of organic dyes removal on CPMO-4SR.

image file: c5ra11622h-f8.tif
Fig. 8 (a) Langmuir and (b) Freundlich adsorption isotherm of Cr(VI) removal on CPMO-4SR.
Table 2 Estimated isotherm parameters of CPMO-4SR for organic dyes and Cr(VI) adsorption
Adsorbate Langmuir model Freundlich model
R2 qmax (mg g−1) b (L mg−1) R2 n (L mg−1) kf (mg g−1)
MO 0.998 699 0.0723 0.654 2.85 117.81
CR 0.976 364.96 0.0347 0.999 3.468 61.24
Cr(VI) 0.974 102 1.58 0.978 2.56 52.63


Moreover, the value of n between 2 to 10 in the Freundlich isotherm model represents an easy adsorption and a value of n between 1 to 2 represents a moderate adsorption, while a value of n < 1 represents a difficult adsorption.50,51 Thus, both for the CR and Cr(VI), the adsorption was easy as the value of n lies between 2 to 4. This further supports the observation of a high adsorption capacity that was achieved at a very early stage of 5 min only.

Kinetic study

The pseudo first order and pseudo second order kinetic models have been evaluated for kinetic studies of the adsorption processes and the results were verified by the linear equation analysis. The pseudo first order and pseudo second order equations can be expressed in eqn (5) and (6), respectively;
 
ln[thin space (1/6-em)](qeqt) = ln[thin space (1/6-em)]qek1t (5)
 
image file: c5ra11622h-t5.tif(6)
where, qe and qt are equilibrium adsorption capacity and adsorption capacity at time t, respectively. k1 and k2 are the pseudo first order and pseudo second order rate constants, respectively. Linear arrangement of these equations was commonly used to check the validity of these models and to obtain the model parameters.

The plots were obtained by plotting ln[thin space (1/6-em)](qeqt) versus t and t/qt versus t for pseudo first order and pseudo second order respectively.38 The values of R2 estimated from the pseudo second order plots in Fig. 9b and 10b were 1, 0.998 and 0.999 for MO, CR and Cr(VI), respectively. From the values of the R2, it was clear that all the adsorption processes follow the pseudo second order kinetics. All the kinetic parameters are summarized in Table 3.


image file: c5ra11622h-f9.tif
Fig. 9 (a) Pseudo first order and (b) pseudo second order kinetics for the adsorption of organic dyes.

image file: c5ra11622h-f10.tif
Fig. 10 (a) Pseudo-first-order and (b) pseudo-second-order kinetics for the adsorption of Cr(VI) ions.
Table 3 Kinetic parameters for the adsorption of organic dye and Cr(VI) by CPMO-4SR
Adsorbate Pseudo first-order Pseudo second-order
R2 qe (mg g−1) k1 (min−1) R2 qe (mg g−1) k2 (g mg−1 min−1)
MO 0.959 6.2 0.061 1 513.56 0.0248
CR 0.759 63 0.053 0.998 325.73 0.00184
Cr(VI) 0.830 11.89 0.01 0.999 95.15 0.01567


Thermodynamic studies

In order to further get more insight into the adsorption processes, the thermodynamic parameters, such as, changes in free energy (ΔG), entropy (ΔS) and enthalpy (ΔH) have been calculated by using the following equations;
 
image file: c5ra11622h-t6.tif(7)
 
ΔG = −RT ln(kd) (8)
 
image file: c5ra11622h-t7.tif(9)
where, R is the universal gas constant, T is the temperature (K) and kd is the distribution coefficient for the adsorption process. In eqn (7), the plot ln(kd) vs. 1/T (Fig. 11) would provide the values of the ΔH and ΔS from the slope and intercept, respectively. The values of all these thermodynamic parameters are given in Table S8 and S9.

image file: c5ra11622h-f11.tif
Fig. 11 Plot of ln(kd) vs. 1/T for (a) organic dyes and Cr(VI) ion removal over CPMO-4.

The negative values of ΔG for MO, CR and Cr(VI) ions indicate that the adsorption process is thermodynamically spontaneous in nature.52 The ΔH values calculated for the MO, CR and Cr(VI) were −1.377, −0.461 and −7.096 kJ mol−1, respectively. The observation of the negative ΔH values confirm the exothermic nature of the adsorption processes. The ΔS values were calculated to be 23, −0.498 and −172 J (mol K)−1 for MO, CR and Cr(VI), respectively.

Conclusion

A non-conventional synthetic approach, sonochemistry, has been adopted to synthesize mesoporous organosilica with cyclophosphazene functionality in the framework. The used method has produced the organosilicas with desired physicochemical properties although a substantially less experimental time of 1 h was used. Paddle wheel structure of cyclophosphazene derivatives induces a synergy effect in achieving high specific surface areas (974 m2 g−1). The materials show good adsorption properties against anionic dyes such as methyl orange and congo red. Further, these materials could remove heavy metal ions such as, Cr(VI), which is carcinogenic in nature, from the aqueous solution. The adsorption of both the synthetic organic dyes and the Cr(VI) was very fast and maximum adsorption capacity could be achieved in only 5 min. Further the adsorption processes were found to be thermodynamically favourable. This method could be generalized to synthesize many other mesoporous organosilicas with cyclophosphazene in the framework by choosing various other organosilica precursors.

Acknowledgements

The work is supported by DST, Govt. of India [Grant No. DST/IS-STAC/CO2-SR-132/12(G)]. PR acknowledges the UGC, Govt. of India for the SRF fellowship.

References

  1. T. Asefa, M. J. MacLachlan, N. Coombs and G. A. Ozin, Nature, 1999, 402, 867–871 CAS.
  2. S. Inagaki, S. Guan, Y. Fukushima, T. Ohsuna and O. Terasaki, J. Am. Chem. Soc., 1999, 121, 9611–9614 CrossRef CAS.
  3. B. J. Melde, B. T. Holland, C. F. Blanford and A. Stein, Chem. Mater., 1999, 11, 3302–3308 CrossRef CAS.
  4. S. S. Park, M. S. Moorthy and C. S. Ha, NPG Asia Mater., 2014, 6, 1–21 Search PubMed.
  5. P. V. D. Voort, D. Esquivel, E. D. Canck, F. Goethals, I. V. Driessche and F. J. Romero-Salguero, Chem. Soc. Rev., 2013, 42, 3913–3955 RSC.
  6. A. N. Prasad, B. M. Reddy, E. Y. Jeong and S. E. Park, RSC Adv., 2014, 4, 29772–29781 RSC.
  7. Z. Teng, X. Su, Y. Zheng, J. Zhang, Y. Liu, S. Wang, J. Wu, G. Chen, J. Wang, D. Zhao and G. Lu, J. Am. Chem. Soc., 2015, 137, 7935–7944 CrossRef CAS PubMed.
  8. Y. Maegawa, N. Mizoshita, T. Tani and S. Inagaki, J. Mater. Chem., 2010, 20, 4399–4403 RSC.
  9. M. Mandal and M. Kruk, J. Phys. Chem. C, 2010, 114, 20091–20099 CAS.
  10. G. Smeulders, V. Meynen, G. V. Baelen, M. Mertens, O. I. Lebedev, G. V. Tendeloo, B. U. W. Maes and P. Cool, J. Mater. Chem., 2009, 19, 3042–3048 RSC.
  11. B. E. Grabicka and M. Jaroniec, Microporous Mesoporous Mater., 2009, 119, 144–149 CrossRef CAS PubMed.
  12. E. B. Celer and M. Jaroniec, J. Am. Chem. Soc., 2006, 128, 14408–14414 CrossRef CAS PubMed.
  13. S. Vetrivel, C. T. Chen and H. M. Kao, New J. Chem., 2010, 34, 2109–2112 RSC.
  14. T. L. Sung, Y. C. Pan, L. Kumaresan, S. Vetrivel and H. M. Kao, Microporous Mesoporous Mater., 2012, 153, 79–87 CrossRef CAS PubMed.
  15. H. Y. Wu, S. Z. Huang, C. C. Ting, J. R. Deka and H. M. Kao, J. Chin. Chem. Soc., 2013, 60, 831–838 CrossRef CAS PubMed.
  16. J. R. Deka, S. Vetrivel, H. Y. Wu, Y. C. Pan, C. C. Ting, Y. L. Tsai and H. M. Kao, Ultrason. Sonochem., 2014, 21, 387–394 CrossRef CAS PubMed.
  17. S. Sun, S. Wang, P. Wang, Q. Wu and S. Fang, Ultrason. Sonochem., 2015, 23, 21–25 CrossRef CAS PubMed.
  18. P. Mohanty, N. M. K. Linn and K. Landskron, Langmuir, 2010, 26, 1147–1151 CrossRef CAS PubMed.
  19. K. S. Suslick and G. J. Price, Annu. Rev. Mater. Sci., 1999, 29, 295–326 CrossRef CAS.
  20. K. S. Suslick, Y. Didenko, M. M. Fang, T. Hyeon, K. J. Kolbeck, W. B. McNamara, M. M. Mdleleni and M. Wong, Philos. Trans. R. Soc., A, 1999, 357, 335–353 CrossRef CAS.
  21. C. Diaz, M. L. Valenzuela, D. Bravo, V. Lavayen and C. O'Dwyer, Inorg. Chem., 2008, 47, 11561–11569 CrossRef CAS PubMed.
  22. M. Barbosa, C. Diaz, M. I. Toral, J. Retuert and Y. Martinez, J. Mater. Chem., 2005, 15, 1360–1368 RSC.
  23. P. Rekha, U. Sahoo and P. Mohanty, RSC Adv., 2014, 4, 34860–34863 RSC.
  24. Y. J. Shin, Y. R. Ham, S. H. Kim, D. H. Lee, S. B. Kim, C. S. Park, Y. M. Yoo, J. G. Kim, S. H. Kwon and J. S. Shin, J. Ind. Eng. Chem., 2010, 16, 364–367 CrossRef CAS PubMed.
  25. H. Kawakami, S. Kanezaki, M. Sudo, M. Kanno, S. Nagaoka and S. Kubota, Artif. Organsa, 2002, 10, 883–890 CrossRef.
  26. B. Tanhaei, A. Ayati, M. Lahtinen and M. Sillanpaa, Chem. Eng. J., 2015, 259, 1–10 CrossRef CAS PubMed.
  27. N. Fellenz, P. Martin, S. Marchetti and F. Bengoa, J. Porous Mater., 2015, 22, 729–738 CrossRef CAS.
  28. W. S. W. Ngah, L. C. Teong and M. A. K. M. Hanafiah, Carbohydr. Polym., 2011, 83, 1446–1456 CrossRef PubMed.
  29. Y. Wu, M. Zhang, H. Zhao, S. Yang and A. Arkin, RSC Adv., 2014, 4, 61256–61267 RSC.
  30. S. Babel and T. A. Kurniawan, J. Hazard. Mater., 2003, 97, 219–243 CrossRef CAS.
  31. S. Borisov, P. Hazendonk and P. G. Hayes, J. Inorg. Organomet. Polym., 2010, 20, 395–398 CrossRef.
  32. M. R. Mello, D. Phanon, G. Q. Silveira, P. L. Llewellyn and C. M. Ronconi, Microporous Mesoporous Mater., 2011, 143, 174–179 CrossRef CAS PubMed.
  33. P. Mohanty and K. Landskron, Nanoscale Res. Lett., 2009, 4, 169–172 CrossRef CAS PubMed.
  34. P. Mohanty, L. D. Kull and K. Landskron, Nat. Commun., 2011, 2, 401–406 CrossRef PubMed.
  35. P. Mohanty and K. Landskron, J. Mater. Chem., 2009, 19, 2400–2406 RSC.
  36. S. Hao, H. Chang, Q. Xiao, Y. Zhong and W. Zhu, J. Phys. Chem. C, 2011, 115, 12873–12882 CAS.
  37. K. M. Parida and D. Rath, J. Mol. Catal. A: Chem., 2009, 310, 93–100 CrossRef CAS PubMed.
  38. M. Anbia, K. Kargosha and S. Khoshbooei, Chem. Eng. Res. Des., 2015, 93, 779–788 CrossRef CAS PubMed.
  39. T. Yokoi, Y. Kubota and T. Tatsumi, Appl. Catal., A, 2012, 421–422, 14–37 CrossRef CAS PubMed.
  40. S. A. Idris, K. M. Alotaibi, T. A. Peshkur, P. Anderson and M. Morris, Microporous Mesoporous Mater., 2013, 165, 99–105 CrossRef CAS PubMed.
  41. X. Li, C. Han, W. Zhu, W. Ma, Y. Luo, Y. Zhou, J. Yu and K. Wei, J. Chem., 2014, 2014, 1–10 CAS.
  42. J. Liu, S. Ma and L. Zang, Appl. Surf. Sci., 2013, 265, 393–398 CrossRef CAS PubMed.
  43. N. Mohammadi, H. Khani, V. K. Gupta, E. Amereh and S. Agarwal, J. Colloid Interface Sci., 2011, 362, 457–462 CrossRef CAS PubMed.
  44. J. Ma, F. Yu, L. Zhou, L. Jin, M. Yang, J. Luan, Y. Tang, H. Fan, Z. Yuan and J. Chen, ACS Appl. Mater. Interfaces, 2012, 4, 5749–5760 CAS.
  45. H. Mahmoodian, O. Moradi, B. Shariatzadeha, T. A. Salehf, I. Tyagi, A. Maity, M. Asif and V. K. Gupta, J. Mol. Liq., 2015, 202, 189–198 CrossRef CAS PubMed.
  46. S. Ghorai, A. K. Sarkar, A. B. Panda and S. Pal, Bioresour. Technol., 2013, 144, 485–491 CrossRef CAS PubMed.
  47. Q. Du, J. Sun, Y. Li, X. Yang, X. Wang, Z. Wang and L. Xia, Chem. Eng. J., 2014, 245, 99–106 CrossRef CAS PubMed.
  48. A. Afkhami and R. Moosavi, J. Hazard. Mater., 2010, 174, 398–403 CrossRef CAS PubMed.
  49. J. Hu, H. Yu, W. Dai, X. Yan, X. Hu and H. Huang, RSC Adv., 2014, 4, 35124–35130 RSC.
  50. X. Li, R. Zhao, B. Sun, X. Lu, C. Zhang, Z. Wang and C. Wang, RSC Adv., 2014, 4, 42376–42382 RSC.
  51. F. Mou, J. Guan, Z. Xiao, Z. Sun, W. Shi and X. Fan, J. Mater. Chem., 2011, 21, 5414–5421 RSC.
  52. T. Wang, K. Kailasam, P. Xiao, G. Chen, L. Chen, L. Wang, J. Li and J. Zhu, Microporous Mesoporous Mater., 2014, 187, 63–70 CrossRef CAS PubMed.

Footnote

Electronic supplementary information (ESI) available: FT-IR, SAXS, NMR data, CHN analysis, TGA-DTG, pore size distribution, CO2 sorption isotherms, adsorption isotherm of CPMOs, comparison of qmax with literature, thermodynamic parameters. See DOI: 10.1039/c5ra11622h

This journal is © The Royal Society of Chemistry 2015
Click here to see how this site uses Cookies. View our privacy policy here.