Broccoli glucosinolate degradation is reduced performing thermal treatment in binary systems with other food ingredients

E. Giambanellia, R. Verkerkb, V. Fogliano*b, E. Capuanob, L. F. D'Antuonoa and T. Olivierob
aDepartment of Agri-Food Science and Technology, Food Science University Campus, University of Bologna, Piazza Goidanich 60, 47521, Cesena, Italy
bFood Quality and Design Group, Wageningen University, Postbox 17, 6700 AA Wageningen, The Netherlands. E-mail: vincenzo.fogliano@wur.nl

Received 15th June 2015 , Accepted 24th July 2015

First published on 24th July 2015


Abstract

Glucosinolate (GL) stability has been widely studied in different Brassica species. However, the matrix effect determined by the presence of other ingredients occurred in many broccoli-based traditional recipes may affect GL thermal degradation. In this study, the matrix effect on GL thermal degradation was investigated by means of binary systems containing broccoli and another ingredient such as potato, corn starch, lentils protein or onion. Data showed that in binary systems the GL degradation was lower compared to the only-broccoli system, in particular in the broccoli/onion systems. The kinetics of GL degradation in broccoli/onion systems at different ratios showed that the higher the amount of onion, the higher the protective effect and that GL thermal degradation followed a second order model. Finally the possibility that the effect was related to the amount of flavonoids present in onions was ruled out by data obtained using broccoli/onion systems made with three onion varieties having different flavonoid content. This study shows for the first time that the presence of other food ingredients can efficiently reduce GL thermal degradation. The protective effect of onion, often present in the traditional recipes of broccoli soups in many countries, points out that the interaction of different ingredients may not only improve the taste of a dish, but also the healthiness.

Introduction

Vegetables of the Brassicaceae family such as broccoli, cabbage and Brussels sprouts are characterized by the presence of glucosinolates (GLs), a class of sulfur-containing bioactive compounds. Myrosinase (MYR) is the endogenous enzyme that catalyzes GL hydrolysis into isothiocyanates which have been extensively studied for their anticarcinogenic activities.1–3 Broccoli (Brassica oleracea L. var. italica) contains relatively high levels of glucoraphanin which is the precursor of sulphoraphane, an isothiocyanate known to have a positive effect in the mammalian detoxication (phase 2) enzyme activity.4,5

Cooking of Brassica vegetables, by steaming, stir-frying and microwaving, has been shown to differentially modulates GL retention.6–8 However all cooking procedures influence the final GL content by (i) inactivating MYR, (ii) changing the vegetable matrix (cell lysis) and forthcoming leaching in the cooking water, (iii) promoting the thermal degradation of GLs.

Previous works have investigated the factors affecting thermal degradation of GLs in broccoli and other Brassica's such as temperature, time and type of cooking, water activity (aw).8–11 Mathematical models have been developed to predict the kinetic of GL degradation upon cooking/processing.8,10,12,13 Dekker, Hennig, and Verkerk (2009)14 showed that thermal degradation rate constants of specific GLs may vary in different vegetables, whereas Hennig, de Vos, Maliepaard, Dekker, Verkerk, and Bonnema (2014)15 found differences in the glucoraphanin and glucobrassicin degradation rate constants even in different genetic lines of broccoli. Finally, Hanschen et al. (2012)9 carried out a very detailed study on the factors affecting allyl GL thermal degradation and concluded that the broccoli matrix decreases GL thermal stability compared to simplified aqueous model systems. The main outcome of these studies is that the physicochemical composition of the plant matrix can significantly contribute to the variability of GL thermal stability.

Brassica vegetables are normally consumed as part of a whole meal, in combination with other components. This means that other ingredients are used and mixed together with vegetables during food preparation. In this respect, the fate of GLs during preparation of Brassica vegetables, and specifically during cooking, may be affected by the overall meal composition.

The aim of this study was to evaluate the effect of added components on the kinetic of the GL thermal degradation in broccoli using specifically design binary model system. The effect of different macromolecules (starch and protein) as well as the presence of onions rich in polysaccharides and polyphenols was tested.

Results and discussion

MYR activity and GLs in the broccoli batch

No residual MYR activity was detected after the microwaving pre-treatment. Four GLs were identified and quantified: glucoraphanin (aliphatic GLs), glucobrassicin, 4-methoxyglucobrassicin and neo-glucobrassicin (indolic GLs). Glucoraphanin was the most abundant GL in the broccoli batch used for this study, in agreement with previous results.16,17 Average glucoraphanin content was 4.13 ± 0.78 μmol g−1 dry weight (dw), corresponding to 57.4% of total GLs. Among indolic GLs, neo-glucobrassicin was the most abundant compound (2.18 ± 0.45 μmol g−1), representing 30.3% of total GLs.

GL thermal degradation in binary model systems

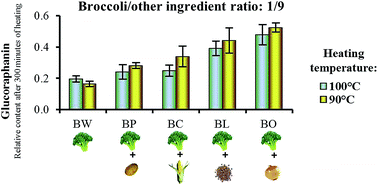
Four model systems, made of broccoli powder blended with other ingredient, were studied and compared with a control containing only broccoli powder. The second ingredient was chosen with the aim to formulate model systems that could mimic traditional domestic recipes. Two model systems included two starches different for their physical properties, namely from potato and corn.18 In the third broccoli were mixed with protein isolated from lentils, while in the fourth system a freeze-dried onion powder was used. The results of the thermal treatments on total GLs and specifically on glucoraphanin concentration are shown in the four panels of Fig. 1. The higher order interaction (temperature × ratio × mixture) had significant effect on relative total GLs and glucoraphanin patterns. Total GL content in the five model systems ranged between 5.82–7.28 μmol g−1 broccoli (dw) at beginning of the holding phase (time zero), and 0.20–2.53 μmol g−1 broccoli (dw) after 300 minutes of heating.
image file: c5ra11409h-f1.tif
Fig. 1 Total GL relative contents (with respect to initial content) after 300 minutes of heating, for different broccoli mixtures at 1/9 (top left panel) and 1/1 (top right panel) weight ratios. The two bottom panels showed the glucoraphanin relative contents with respect to initial values in the corresponding samples were reported. BW: broccoli, as control; BP: broccoli/potato starch; BC: broccoli/corn starch; BL: broccoli/lentil proteins; BO: broccoli/onion. Symbols above columns indicate level of significance of the effect of different model systems compared to the broccoli only control (BW), according the Dunnett test, within each combination of temperature and ratio. Significance: **: p ≤ 0.01; *: p ≤ 0.05; ns: non-significant.

The broccoli/added ingredients strongly affected the total GL retention. In the 1/1 mixtures, only onion, at 90 °C had positive effect on retention, compared to the control. All the other combinations did not show any differences, at 90 °C, or had lower retention, at 100 °C, compared to the control. At the 1/9 ratio, all the systems showed a trend of increased GL stability, significant for all mixtures at 90 °C, and for lentil and onion only at 100 °C.

The trend of glucoraphanin during heating was substantially similar to that of total GLs (Fig. 1 bottom panels). The main differences, with respect to total GLs, were the higher relative retention of glucoraphanin and the stronger protective effect of the 1/9 mixtures. As for total GLs, the strongest effect was found in the broccoli/onion mixture at 1/9 ratio, where approximately 45% and 53% of glucoraphanin could be recovered after heating treatment at 100 and 90 °C. Good protective effect was also observed with lentils proteins, while a lower protective effect was obtained in the broccoli/potato or broccoli/corn starch systems which was in any case a significantly higher effect than in the control samples. This suggest that the physicochemical structure of the matrix can play a significant role in determining the degradation rate of GLs and likely also of other small molecular weight phytochemicals.

GL thermal degradation in presence of different amount of onion

The main results of the previous experiment is that the other component of broccoli-based systems can significantly prevent GL degradation. Onions proved to be particularly efficient especially at the 1/9 ratio. To obtain more information about this protective effect three broccoli/onion model systems, differing for their relative amounts (1/9, 3/7, and 1/1), were prepared, heated at 100 °C and data were acquired between 0 and 300 minutes. Table 1 reports total GL and glucoraphanin contents, at the various heating times and for the different broccoli to onion ratios. Data showed that the higher the presence of onion the lower the GLs and glucoraphanin degradation with a substantial amount (up to 50%) of the total GLs still present after 1 hour of treatment with a 1[thin space (1/6-em)]:[thin space (1/6-em)]9 ratio. Also in this case, all the effects (heating time, broccoli to onion ratio and their interaction) were statistically significant and the data confirmed a second order kinetic relation, as represented in Fig. 2, for the 1/9 broccoli/onion ratio.
Table 1 Total GLs and glucoraphanin contents relative to time zero, as a function of broccoli/onion ratios
Time of heating at 100 °C (min) Broccoli/onion ratiosa
1/9 3/7 1/1 C 1/9 3/7 1/1 C
Total GLs (relative content)b ± SD Glucoraphanin (relative content)b ± SD
a Broccoli/onion ratio: 1/9, 3/7 and 1/1; broccoli only control: C.b Relative contents are referred to the correspondents initial contents, for each broccoli/onion system.c RCi: relative initial concentrations at time zero; k2: second order rate kinetic constant.
0 1.00 1.00 1.00 1.00 1.00 1.00 1.00 1.00
15 0.83 ± 0.11 0.72 ± 0.17 0.80 ± 0.13 0.55 ± 0.08 0.81 ± 0.16 0.74 ± 0.15 0.78 ± 0.16 0.59 ± 0.10
30 0.66 ± 0.14 0.59 ± 0.14 0.59 ± 0.07 0.40 ± 0.05 0.60 ± 0.12 0.62 ± 0.12 0.61 ± 0.07 0.48 ± 0.07
60 0.52 ± 0.05 0.38 ± 0.05 0.23 ± 0.05 0.25 ± 0.05 0.52 ± 0.10 0.39 ± 0.06 0.27 ± 0.06 0.29 ± 0.06
120 0.31 ± 0.05 0.35 ± 0.07 0.19 ± 0.02 0.15 ± 0.01 0.29 ± 0.06 0.37 ± 0.08 0.20 ± 0.03 0.19 ± 0.01
300 0.30 ± 0.08 0.15 ± 0.03 0.07 ± 0.02 0.05 ± 0.01 0.23 ± 0.04 0.16 ± 0.03 0.08 ± 0.02 0.08 ± 0.02
[thin space (1/6-em)]
Kinetic equation parametersc
RCi 1.01 ± 0.04 0.99 ± 0.05 1.05 ± 0.05 1.01 ± 0.02 0.98 ± 0.02 0.99 ± 0.02 1.04 ± 0.04 0.99 ± 0.04
k2 0.016 ± 0.002 0.021 ± 0.003 0.030 ± 0.003 0.038 ± 0.002 0.015 ± 0.002 0.020 ± 0.002 0.029 ± 0.003 0.038 ± 0.003


image file: c5ra11409h-f2.tif
Fig. 2 Example of data fitting by means of a second order kinetic equation: total GL content relative to initial time (RTGLS) as a function of heating time. Broccoli/onion model system at 1/9 ratio. ** Correlation coefficient statistically significant at p < 0.01.

The second order kinetic degradation rate parameters (k2) for total GLs and glucoraphanin are reported at the bottom lines of Table 1. The rate constant (k2) decreased as a function of onion content, demonstrating the protective effect of onion. The rate constants for total GLs and glucoraphanin degradation were not significantly different. This results was not in agreement with Hennig et al. (2012)10 who indicated that GL degradation followed a first order kinetics corresponding to a monomolecular degradation. This discrepancy suggests that the degradation of phytochemical components, particularly in the case of GLs in a mixed food matrix such as the one used in this study, can take place according to more complex patterns and are not only determined by the temperature/time combination.

GL thermal degradation in presence of different onion varieties

Onions are one of the richest sources of FLA19 and it may be that these compounds played a role in the GL degradation. Three model systems, in the ratio broccoli onion 1/9, were prepared using red onion, yellow onion, and white onion. FLA profiles of the three onion varieties are reported in Table 2. Red onions resulted the richest source of this class of bioactives, with a total FLA content more than double than yellow and white onions. Details of modifications of FLA composition along heating of the models systems are provided as ESI (Table 1S ESI). Results of the GL thermal degradation are reported in Table 3 and confirmed that the addition of onion powder to broccoli significantly decreased GL degradation rate respect to the broccoli control only. Despite the huge differences of FLA content, the trends of GL degradation were not affected by onion varieties. No significant differences were detected between onion varieties, nor was the onion variety × time interaction significant. The second order kinetic degradation rate parameters (k2), reported at the bottom of Table 3, confirm this finding. Interestingly, also FLA thermal stability was lower in the broccoli matrix compared to the onion matrix (Table 1S ESI).
Table 2 FLA content, expressed as mg kg−1 of onion dry weight ± SD, for the 3 onion varieties used in the third heating experiment
Compounda RT (min) Onion varietyb
YO WO RO
a Q-3,7,4ʹ-TGLC: quercetin-3,7,4ʹ-triglucoside; Q-7,4ʹ-DGLC: quercetin-7,4ʹ-diglucoside; Q-3,4ʹ-DGLC: quercetin-3,4ʹ-diglucoside; I-3,4ʹ-DGLC: isorhamnetin-3,4ʹ-diglucoside; Q-3-GLC: quercetin-3-glucoside; Q-4-GLC: quercetin-4-glucoside; I-4-GLC: isorhamnetin-4-glucoside; Q: quercetin aglycone; K: kaempferol; FLA: sum of all the flavonoids identified.b YO, yellow onion; WO, white onion; RO, red onion.
Q-3,7,4ʹ-TGLC 8.8 8.2 ± 1.7 5.5 ± 1.3 23.7 ± 4.6
Q-7,4ʹ-DGLC 11.4 52.0 ± 2.3 29.0 ± 4.3 81.5 ± 11.1
Q-3,4ʹ-DGLC 12.3 1068.3 ± 22.5 978.7 ± 74.6 2492.6 ± 4.4
I-3,4ʹ-DGLC 12.7 37.3 ± 1.6 32.0 ± 8.3 62.6 ± 5.4
Q-3-GLC 14.2 18.8 ± 0.2 46.6 ± 3.0 132.2 ± 4.0
Q-4-GLC 15.6 2125.8 ± 2.6 2163.0 ± 160.0 4818.6 ± 437.8
I-4-GLC 16.3 165.4 ± 3.6 255.1 ± 14.2 211.9 ± 0.8
Q 19.2 94.5 ± 0.1 131.1 ± 30.6 562.9 ± 103.6
K 22.1 2.1 ± 0.3 3.2 ± 0.7 9.3 ± 1.9
FLA 3572.3 ± 22.5 3644.2 ± 297.3 8395.3 ± 634.3


Table 3 Total GLs and glucoraphanin contents relative to time zero, as a function of onion variety at 1/9 broccoli/onion ratio
Time of heating (min) Model systems (broccoli/onion varieties)a
YO WO RO C YO WO RO C
Total GLs (relative content)b Glucoraphanin (relative content)b
a YO, broccoli/yellow onion; WO, broccoli/white onion; RO, broccoli/red onion; C, broccoli control.b Relative contents are referred to the correspondents initial contents, for each broccoli/onion system.c RCi: relative initial concentrations at time zero; k2: second order rate kinetic constant.
0 1.00 1.00 1.00 1.00 1.00 1.00 1.00 1.00
15 0.83 ± 0.11 0.73 ± 0.15 0.80 ± 0.05 0.55 ± 0.08 0.81 ± 0.16 0.87 ± 0.22 0.83 ± 0.11 0.59 ± 0.10
30 0.66 ± 0.14 0.58 ± 0.11 0.71 ± 0.12 0.40 ± 0.05 0.60 ± 0.12 0.71 ± 0.15 0.63 ± 0.08 0.48 ± 0.07
60 0.52 ± 0.05 0.46 ± 0.09 0.49 ± 0.10 0.25 ± 0.05 0.52 ± 0.10 0.55 ± 0.13 0.46 ± 0.09 0.29 ± 0.06
120 0.31 ± 0.05 0.20 ± 0.03 0.35 ± 0.03 0.15 ± 0.01 0.29 ± 0.06 0.24 ± 0.04 0.31 ± 0.05 0.19 ± 0.01
300 0.30 ± 0.08 0.17 ± 0.03 0.19 ± 0.01 0.05 ± 0.01 0.23 ± 0.04 0.19 ± 0.03 0.16 ± 0.01 0.08 ± 0.02
[thin space (1/6-em)]
Kinetic equation parametersc
RCi 1.01 ± 0.04 1.04 ± 0.08 0.98 ± 0.04 1.01 ± 0.02 0.98 ± 0.05 1.04 ± 0.09 1.01 ± 0.04 0.99 ± 0.03
k2 0.016 ± 0.002 0.016 ± 0.003 0.018 ± 0.002 0.038 ± 0.002 0.015 ± 0.002 0.015 ± 0.004 0.018 ± 0.002 0.038 ± 0.003


On the basis of this relation, the whole set of data was fitted by a generalized second order kinetic relation, in which the rate constant was expressed as a linear function of onion concentration. The overall data fitting was highly significant for both total GLs and glucoraphanin (see parameters of Table 2S ESI), whereas an example of surface response for total GLs is represented in Fig. 3. The variation of the rate equation (Dk) as a function of the added ingredient (onion in this case), although being ingredient specific, indicates this method as applicable to different combinations. The finding that onion FLA concentration do not affect GL degradation rate can have different explanations. It has been reported that the addition of broccoli powder to aqueous solutions decreases the thermal stability of aliphatic ITC in model systems.9 This fact has been explained by the synergistic effect exerted by broccoli vitamin C on Fe(II) catalyzed GL degradation, likely by recycling of Fe(III) to Fe(II). Vitamin C and iron content is lower in onion compared to broccoli20,21 which might have contributed to reduce the adverse effect of the vitamin C/iron system in broccoli/onion models. This would also explain why a lower GL degradation rate was observed in all the mixtures from experiment 1 at least at the ratio 1/9. Beside this effect, however, onion matrix provided extra protection to GL degradation through a variety of cell components. GLs were more stable in mixtures because of the dilution of the broccoli matrix rather than because of the presence of specific protective compounds in the onion matrix.


image file: c5ra11409h-f3.tif
Fig. 3 Surface response of total GL relative contents as a function of heating time (T = 100 °C) and relative onion content in the broccoli/onion model systems. Individual data points are not represented for a matter of clarity.

Materials and methods

Materials

A batch of broccoli (B. oleracea var. italica) fresh onions (Allium cepa L.), potato and corn starches were purchased from a local supermarket (C1000, Wageningen, The Netherlands). Lentil protein isolates (55%) were from AGT Foods, (Canada).

Standards for GL analysis: sinigrin hydrate (Fluka) and glucotropaeolin (Laboratory of Biochemistry, Plant Breeding and Acclimatization Institute at Radzikow, Błonie, Poland). For the quantification of MYR activity the calibration curve was done by using standard MYR enzyme (thioglucosidase from Sinapis Alba, Sigma-Aldrich). Standard for flavonoids (FLA) analysis: quercetin-3-glucoside and kaempferol (Fluka, UK).

Samples preparation

Onions were peeled, cut into smaller pieces, stored over night at −20 °C and subsequently freeze-dried (Christ Alpha 1-4 LD Freeze Dryer, SciQuip Ltd, Newton, United Kingdom). Broccoli batch was heated in a microwave oven at 900 W for 5 min to inactivate MYR.11 After cooling down on ice, the broccoli batch was frozen overnight at −20 °C and subsequently freeze dried.

Freeze-dried material was ground to a fine powder by using a Waring blender (model 34BL99, Dynamics Corp. of America, New Hartford, CT, USA). Then freeze-dried material was stored at −20 °C till further preparation.

Model mixtures were prepared by mixing appropriate amount of broccoli powder and other ingredient. Since aw is known to have an effect on GL degradation, as already discussed in a previous work by Oliviero et al. (2012),11 different volumes of water were added to each system in order to obtain the same value of water activity (aw, 0.99). aw of each system was measured at 25 °C using a LabMaster-aw (Novasina Lachen, Switzerland).

Myrosinase activity determination

MYR activity was determined by a coupled enzymatic procedure, as described by van Eylen, Oey, Hendrickx, and van Loey (2006).22 The MYR extraction was performed according to Oliviero, Verkerk, van Boekel, and Dekker (2014).23 Briefly, 0.05 g of freeze-dried broccoli were mixed with 140 mL of potassium phosphate buffer (50 mM, pH 7), at 15 °C overnight. The day after, upon centrifugation (2670 g for 10 min) the supernatants were filtered (folded filters Grade 595 1/2 – 4–7 μm, Whatman) to clarify the solution. Then the filtrated were concentrated by using filter tubes (Amicon Ultra-4 cut-off 30 kDa, Millipore). For the determination of the purified and concentrated enzyme a D-glucose enzyme kit (Enzyplus EZS 781+, Raisio Diagnostics, Finland) was used. MYR activity was determined by a spectrophotometer (Cary UV 50, Bergen op Zoom, The Netherlands) at 340 nm for 7 minutes.

Model systems heating

To test the effect of added ingredients on broccoli thermal degradation, four systems were prepared by adding to broccoli one of the following ingredients: potato starch, corn starch, lentil proteins, and freeze-dried onion. A system, containing only broccoli, was used as control. Two broccoli/other ingredient weight ratios were used, 1/9 and 1/1. Considering 2 g of model system:

✓ 2.3 mL of water were added to the broccoli and potato starch, corn starch, or lentil proteins systems, with a 1/9 weight ratio;

✓ 5 mL of water were added to the broccoli and potato starch, corn starch, or lentil proteins systems, with a 1/1 weight ratio;

✓ 4 mL of water were added to the broccoli/onion systems, with a 1/9 weight ratio;

✓ 7 mL of water were added to the broccoli/onion systems, with a 1/1 weight ratio;

✓ 8 mL of water were added to the broccoli control.

After mixing and adding water, each system was transferred into metal tubes with hermetic caps in which the temperature profile could be monitored with a thermocouple. The samples were heated in a heating block (Liebisch Labortechnik, England). Two temperatures were chosen for the heating studies, 90 °C and 100 °C.

The heating-up-time was around 4 min which was then considered as the starting time (time zero). Samples were collected after 0 and 300 min of heating. After heating, the samples were cooled in ice, extracted from the metallic tubes and frozen in liquid nitrogen. Once the samples were frozen, they were reduced to a fine powder using a mill (MM 400, Retsch, Germany), and analyzed for GL content.

To test the effect of onion amount, three model systems with different broccoli/onion ratios were used: 1/9, 3/7, and 1/1. Considering 2 g of model system:

✓ 4 mL of water were added to the 1/9 broccoli/onion weight ratio;

✓ 5.5 mL of water were added to the 3/7 broccoli/onion weight ratio;

✓ 7 mL of water were added to the 1/1 broccoli/onion weight ratio.

Again, the volume of water was chosen in order to obtain the same value of aw in all the model systems evaluated.

Broccoli/onion systems were heated at 100 °C (heating up time around 4 min). Samples were collected after heating, at different time between 0 and 300 min (0, 15, 30, 60, 120, and 300 min). After heating, the samples were treated as reported above and analyzed for GL and FLA contents.

Finally, three different onion varieties were tested; in particular yellow, white, and red onions were used to prepare model systems with broccoli, using only the 1/9 broccoli/onion weight ratio and addition of 4 mL of water. Temperature and times of heating were the same as reported in previous experiment. After heating, the samples were treated as reported above and analyzed for glucosinolate and flavonoid contents.

All the heating experiments were carried out in duplicate, and each duplicate consisted of two tubes, for a total of four replications for the same sample.

Glucosinolates extraction and analysis

The method already described by Oliviero et al. (2012)11 was used. Briefly, 1 g of sample was extracted using preheated methanol (incubated at 75 °C for at least 60 min). 200 μL of 3 mM glucotropaeolin solution were added as internal standard and the samples were incubated in a water bath at 75 °C for 20 min. After incubation, the samples were centrifuged, and the supernatants were collected and re-extracted twice with hot methanol (70%). The extracted GLs were desulphated and the separation was conducted using a LiChrospher® 100 RP-18 column 5 μm (250 × 4.6 mm). Elution from the HPLC column was performed by a gradient of water (A) and acetonitrile (B), as follows: from 0 to 2 min, 0% (B); from 2 to 7.5 min, 0–8% (B); from 7.5 to 14 min, 8–25% (B); from 14 to 18 min, 25% (B); from 18 to 20 min, 25–0% (B); from 20 to 25 min, 0% (B) as post-run. The flow rate was 1 mL min−1 and the injection volume was 20 μL. Detection was performed at ʎ = 229 nm.

GL recovery trials were carried out by spiking the binary model systems with different amounts of a standard GL not present in that broccoli batch. The glucosinolate sinigrin was used as spike and was added as soon as the ingredients were mixed and subsequent heated as described previously. Recovery evaluation was performed in triplicate and calculated as percentage, comparing the amount of sinigrin determined by HPLC and the known amount added before extraction. The internal standard for GL quantification was glucotropaeolin.

Recovery proofs were evaluated using two different amounts of sinigrin for each model system, in order to evaluate the possible effect of food matrix on GL extractability. Calculated recoveries ranged between 79 and 105%, with the lowest value obtained for the broccoli/onion model system.

Flavonoids extraction and analysis

FLA were analyzed using the same methanolic extract obtained from GL extraction. Previous works24,25 indicated that the extraction procedure with hot methanol was suitable for the extraction of both GLs and phenolics.

Separation was conducted using a Varian Polaris C18-A column 5 μm (150 × 4.6 mm), with a Varian Chromsep guard column SS 10 × 3.0 mm and a particle size of 5 μm. The elution was carried out by HPLC in a gradient mode of trifluoroacetic acid in water, pH = 2.5 (A) and acetonitrile (B), as follows: from 0 to 20 min, 0–42% (B), from 20 to 25 min, 42% (B); from 25 to 30 min, 0% (B). The flow rate was 1 mL min−1, and the injection volume was 20 μL. Each chromatogram was recorded at 370 nm, and absorption spectra were recorded between 200 and 500 nm. FLA were quantified by external standard mode, constructing calibration curves of two compounds, quercetin-3-glucoside and kaempferol. Stock solutions were prepared in methanol and concentrations of diluted solutions were included in the range 6.25–100 mg L−1.

The comparison with a more specific method applied to onions confirmed the adequacy of our approach.26

Statistics

The data of the three experiments have been initially processed by means of analysis of variance, taking into account the effects of the main factors and all their interactions. Methodological details of the statistical analysis are given as ESI. All the statistical analyses were carried out by means of the SYSTAT® package, p ≤ 0.05 was considered significant across the whole study, however in some cases also a p ≤ 0.01, as level of significance, has been found.

Conclusions

This study highlighted the importance of added ingredients on the thermal degradation behavior of GLs (in particular glucoraphanin) from broccoli. The employed model systems highlighted the potentiality of onions as broccoli-accompanying ingredients in all the experiments. On the other hand flavonoids may be degraded faster when onions were mixed with broccoli. Therefore, further studies are necessary to find the better trade off combinations and elucidate which components and which mechanisms are involved in thermal degradation of healthy phytochemical to deliver a clear message to consumers about the healthy cooking procedure and the ingredient combinations.

References

  1. D. A. Moreno, M. Carvajal, C. López-Berenguer and C. García-Viguera, J. Pharm. Biomed. Anal., 2006, 41, 1508–1522 CrossRef CAS PubMed.
  2. G. S. Stoewsand, Food Chem. Toxicol., 1995, 33, 537–543 CrossRef CAS.
  3. R. Verkerk, M. Schreiner, A. Krumbein, E. Ciska, B. Holst, I. Rowland, R. de Schrijver, M. Hansen, C. Gerhäuser, R. Mithen and M. Dekker, Mol. Nutr. Food Res., 2009, 53, S219–S265 Search PubMed.
  4. M. W. Farnham, P. E. Wilson, K. K. Stephenson and J. W. Fahey, Plant Breed., 2004, 123, 60–65 CrossRef CAS.
  5. H. Liang, L. Chunfang, Y. Qipeng and F. Vriesekoop, J. Agric. Food Chem., 2007, 55, 8047–8053 CrossRef CAS PubMed.
  6. R. B. Jones, C. L. Frisina, S. Winkler, M. Imsic and R. B. Tomkins, Food Chem., 2010, 123, 237–242 CrossRef CAS PubMed.
  7. M. Palermo, N. Pellegrini and V. Fogliano, J. Sci. Food Agric., 2013, 94, 1057–1070 CrossRef PubMed.
  8. I. Sarvan, R. Verkerk, M. A. J. S. van Boekel and M. Dekker, Innovative Food Sci. Emerging Technol, 2014, 25, 58–66 CrossRef CAS PubMed.
  9. F. S. Hanschen, S. Platz, I. Mewis, M. Schreiner, S. Rohn and L. W. Kroh, J. Agric. Food Chem., 2012, 60, 2231–2241 CrossRef CAS PubMed.
  10. K. Hennig, R. Verkerk, G. Bonnema and M. Dekker, J. Agric. Food Chem., 2012, 60, 7859–7865 CrossRef CAS PubMed.
  11. T. Oliviero, R. Verkerk and M. Dekker, Food Chem., 2012, 132, 2037–2045 CrossRef CAS PubMed.
  12. M. Dekker, R. Verkerk and W. M. F. Jongen, Trends Food Sci. Technol., 2000, 11, 174–181 CrossRef CAS.
  13. K. Oerlemans, D. M. Barrett, C. B. Suades, R. Verkerk and M. Dekker, Food Chem., 2006, 95, 19–29 CrossRef CAS PubMed.
  14. M. Dekker, K. Hennig and R. Verkerk, Czech J. Food Sci., 2009, 27, S85–S88 CAS.
  15. K. Hennig, R. C. H. de Vos, C. Maliepaard, M. Dekker, R. Verkerk and G. Bonnema, Food Chem., 2014, 155, 287–297 CrossRef CAS PubMed.
  16. J. A. Lewis, G. R. Fenwick and A. R. Gray, LWT - Food Sci. Technol., 1991, 24, 361–363 CAS.
  17. Q. Tian, R. A. Rosselot and S. J. Schwartz, Anal. Biochem., 2005, 343, 93–99 CrossRef CAS PubMed.
  18. N. Singh, J. Singh, L. Kaur, N. S. Sodhi and B. S. Gill, Food Chem., 2003, 81, 219–231 CrossRef CAS.
  19. R. Slimestad, T. Fossen and I. M. Vagen, J. Agric. Food Chem., 2007, 55, 10067–10080 CrossRef CAS PubMed.
  20. J. H. Cunningham, G. Milligan and L. Trevisan, Minerals in Australian fruits and vegetables – a comparison of levels between the 1980s and 2000, 2001, Canberra: Food Standards Australia, New Zealand Search PubMed.
  21. J. A. T. Pennington and R. A. Fisher, J. Food Compos. Anal., 2010, 23, 411–418 CrossRef CAS PubMed.
  22. D. van Eylen, I. Oey, M. Hendrickx and A. van Loey, Food Chem., 2006, 97, 263–271 CrossRef CAS PubMed.
  23. T. Oliviero, R. Verkerk, M. A. J. S. van Boekel and M. Dekker, Food Chem., 2014, 163, 197–201 CrossRef CAS PubMed.
  24. L. F. D'Antuono, S. Elementi and R. Neri, Phytochemicals, 2008, 69, 187–199 CrossRef PubMed.
  25. F. Ferioli, E. Giambanelli, L. F. D'Antuono, H. S. Costa, T. G. Albuquerque, A. S. Silva, O. Hayran and B. Koҁaouglu, J. Sci. Food Agric., 2013, 93, 3478–3489 CrossRef CAS PubMed.
  26. E. Riggi, G. Avola, L. Siracusa and G. Ruberto, Food Chem., 2013, 140, 810–816 CrossRef CAS PubMed.

Footnote

Electronic supplementary information (ESI) available. See DOI: 10.1039/c5ra11409h

This journal is © The Royal Society of Chemistry 2015
Click here to see how this site uses Cookies. View our privacy policy here.