Glutaraldehyde sandwiched amino functionalized polymer based aptasensor for the determination and quantification of chloramphenicol

Rosya, Rajendra N. Goyal*a and Yoon-Bo Shim*b
aDepartment of Chemistry, Indian Institute of Technology Roorkee, Roorkee – 247 667, India. E-mail: rngcyfcy@iitr.ac.in; Tel: +91-1332-285794
bDepartment of Chemistry and Institute of Bio-Physico Sensor Technology, Pusan National University, Busan 609-735, South Korea. E-mail: ybshim@pusan.ac.kr

Received 11th June 2015 , Accepted 6th August 2015

First published on 6th August 2015


Abstract

In the present work, the crosslinking property of glutaraldehyde (GA) is exploited to construct a 1,5-diaminonaphthalene (1,5-DAN) modified aptamer based sensor for the determination and quantification of chloramphenicol (CAP). The sensor was fabricated by electro-polymerizing 1,5-DAN on the edge plane pyrolytic graphite (EPPG) followed by immobilization of CAP selective aptamer on the amino functionalized polymer modified EPPG surface using GA, which resulted in covalent linkage with the –NH2 groups of the aptamer as well as those present on the polymerized electrode surface. Resulting GA sandwiched aptasensor leads to a tremendous improvement in the stability and sensitivity of the sensor in comparison to one fabricated without crosslinking. Characterization of the modification protocol was done using scanning electron microscopy (SEM), quartz crystal microbalance (QCM) analysis, and electrochemical impedance spectroscopy (EIS). Under optimized parameters, CAP was detected in a linear working range of 50–500 fM with the detection limit and sensitivity of 11 fM (n = 3, R.S.D = 0.15%) and 0.023 μA fM−1 respectively. The practical utility of the developed aptasensor has also been demonstrated by analysing CAP in complex matrix like urine, commercially available pharmaceutical samples and the Rosetta cells supernatant. The observed results suggests that the present electrochemical aptasensor is suitable for the detection of CAP in medicines, diagnosis of chloramphenicol resistant bacteria and virus, as well as for checking its adulteration in food and other dietary supplements.

1. Introduction

Chloramphenicol (CAP), a bacteriostatic, which acts as bactericidal at high concentrations,1 is effective against a wide variety of Gram positive and Gram negative bacteria. It was originally isolated from bacterium Streptomyces venezuelae in 1947.2 This broad spectrum antibiotic was included in clinical practice for the treatment of typhus fever and trade named as Chloromycetin in 1949. The CAP was widely prescribed for the treatment of serious infections, including typhoid fever and other forms of salmonellosis. It was used basically against the three main bacteria responsible for meningitis: Neisseria meningitidis, Streptococcus pneumoniae and Haemophilus influenza.3 Like any other antibiotic, bacterial strains resistant to the drug came into the picture just after 2 years of its execution into clinical practice, but still the effectiveness of the drug was claimed as satisfactory till 1989, when cases of multidrug resistant Salmonella enterica serovar Typhi were witnessed.1,4 Due to easy synthesis, low cost, and tremendous efficiency against infections, it also figures out a way into veterinary medicine. It was widely used for the prevention and treatment of several diseases and for promoting the growth of food-producing animals.5 Due to hemotoxic nature of CAP in humans, which is attributed to its effect on the mitochondrial synthesis of proteins,6 European Union (EU) defined a “maximum residue limit” (MRL) of CAP as 0.3 μg kg−1 for the detection of its residues in food products like milk, egg, honey etc.7,8 Hence, it is considered desirable to develop a sensor capable of detecting the lowest possible level of CAP in pharmaceutical and real sample.

Various methods like liquid chromatography-tandem mass spectrometry,9 gas chromatography-mass spectrometry,10 high pressure liquid chromatography-UV detection,11 chemiluminescence immunoassay,12 capillary electrophoresis with amperometric detection13 and a myriad of electrochemical sensors8,14–16 have been used for the detection of CAP. Since, electrochemical methods offer an easy, robust, cost effective and fast way for analysis; these are commonly used in comparison to other frequently used techniques such as HPLC, which are although accurate and sensitive, but there operation for analysis requires long time and prior multistep fabrication of the sample which resulted in their limited applicability.

Aptamer are oligonucleic acids, which are created specifically for a target molecule, and bears high affinity for it. The affinity is attributed to the capability of these molecules to undergo a variety of conformational changes due to their propensity to form single-stranded loops and helices, explaining their diversity in binding to various targets.8 Aptamers are seeking immense attention in the analytical field because of their high stability, cost effectiveness and astonishing selectivity. Various biosensors exploiting aptamers as recognition material has been reported in the literature in recent years.8,17 Recently, our group has also fabricated a polymer modified aptamer based sensor for CAP detection.17 However, in the previously reported sensor17 the immobilization of the aptamer was based on sheer adsorption without involving any crosslinking between the aptamer and the polymer. Owing to the absence of cross linking, the modification was less stable as a result of which strenuous surface cleaning and very frequent modifications was required and thus, low stability as well as sensitivity was noticed. Hence, in order to overcome the drawbacks of the previous sensor, another sensor is fabricated exploiting the covalent linkage between the aptamer and other components of modification. In the present sensor, the aptamer was immobilized onto the electro-polymerized surface, by exploiting the cross linking properties of glutaraldehyde (GA). GA which is a bifunctional compound, is mainly used to immobilize proteins and polymers containing free amino acids by covalently linking to the –NH2 group.18 The cross linking reinforces the modification and results in chemically and thermally stable sensor.19 1,5-diaminonapthalene (1,5-DAN) is chosen because of two –NH2 groups present in it which are expected to bridge with –CHO groups of the GA, moreover the high conductivity and quite prominent redox couple obtained during electro-polymerization which allows easy characterization of the polymer, are the other factors responsible for its selection.

In the present work, it was intended to increase the stability of the aptasensor to enhance the sensing ability of the target (CAP) molecules. To achieve this goal the amino functionalized polymer was used in order to produce cross linking with GA in place of adsorption which was witnessed in the previous sensor fabricated by our research group.17 Therefore, 1,5-DAN was electro-polymerized onto the EPPG surface and the free –NH2 groups were activated using GA on which aptamer is then immobilized. The sensor, thus fabricated has been used for the quantification of CAP in pharmaceutical and urine samples.

2. Experimental

2.1 Instrumentation

Cyclic voltammetry (CV) and square wave voltammetry (SWV) were performed using a BAS (West Lafayette, USA) CV-50W voltammetric analyzer. Conventional three electrode cell configuration was used for performing the electrochemical experiments. Aptamer immobilized polymer modified EPPG (edge plane pyrolytic graphite) sensor was used as working electrode. Ag/AgCl (3 M NaCl) (model BAS MF-2050 RB-5B) and a platinum wire were used as reference and counter electrode respectively.

Nano-scale topographic images were obtained using Field Emission Scanning Electron Microscopy (FE-SEM, Zeiss ultra plus 55). Electrochemical Impedance Spectroscopy (EIS) measurements were performed on galvanostat (Versastat 3, PAR). A Quartz Crystal Microbalance (QCM) experiments were carried out using a SEIKO EG&G model QCA 917 and a PAR Model 263A potentiostat/galvanostat. An Au-coated working electrode (area: 0.196 cm2; 9 MHz; AT-cut quartz crystal) was utilized for the QCM experiment.

2.2 Chemicals and reagents

The aptamer sequence used for CAP binding was procured from Bioneer Corporation, South Korea, and had the sequence:17

(5′–NH2–ACTTCAGTGAGTTGTCCCACGGTCGGCGAGTCGGTGGTAG-3′)

CAP and 1,5-DAN were purchased from Sigma-Aldrich Inc., USA and used as received. Aqueous solution of GA (25%) and HClO4 were obtained from Loba Chemie Pvt. Ltd, and Thermo Fischer Scientific Pvt. Ltd, India respectively. For the preparation of control sensor, herring sperm DNA was purchased from Sisco research laboratories, Mumbai. All other chemicals used were of analytical grade. Phosphate buffers (μ = 1.0 M) were prepared using earlier reported method.20 Double distilled water was used for all the preparations required throughout the experiment.

2.3 Fabrication of the modified sensor

Prior to modification, EPPG surface was mechanically scratched using an emery paper (P-400) followed by rinsing with double distilled water and then it was dried. The electrochemical polymerization of 1,5-DAN was achieved using cyclic voltammetry in 10 mM 1,5-DAN solution prepared in 1 M HClO4. The cyclic voltammograms were recorded by scanning potentials between −100 mV to +1000 mV at 100 mV s−1 scan rate for 19 scans (number of scans were optimized in the range of 2–50 scans and it was found that the maximum current was obtained after 19 cycles of polymerization).21 After polymerization, the sensor was rinsed with double distilled water in order to eliminate any adsorbed monomer of 1,5-DAN and was kept overnight at room temperature.

The polymer modified sensor was dipped in a 25% aqueous solution of GA for 1 hour, after which the sensor was removed, rinsed with double distilled water and kept in the air for 15–20 min. After that, 6 μL of the 0.1 μM aptamer solution was drop casted onto the sensor surface and was allowed to get adsorbed and cross linked with the glutaraldehyde. After rinsing with double distilled water the final sensing surface was obtained and used for further analysis.

The incubation time for GA and the volume of the aptamer casted on the sensor surface were also optimized in the range of 1 to 30 min and 1–20 μL respectively. The optimal volume of aptamer immobilized onto the surface was found to be 6 μL, at which maximum current for CAP (200 fM) was witnessed in SWV analyses. It was thus concluded that less volume of the aptamer may result in inefficient response, whereas, high volume might block the electrode surface leading to difficult access to CAP resulting in poor current signal.

2.4 Voltammetric procedure

The stock solution of CAP (1 μM, 25 mL) was prepared by dissolving the required amount of CAP in double distilled water. This solution was then used to prepare standards of different concentrations for further electrochemical studies. For quantification, modified sensor was incubated in CAP solution of desired concentration for time ranging from 1–30 min. After the incubation period gets over, the sensor was taken out rinsed gently with double distilled water and then transferred to voltammetric cell holding a 1[thin space (1/6-em)]:[thin space (1/6-em)]1 solution of deoxygenated phosphate buffer (pH 7.2, 1.0 M) and double distilled water. Voltammograms were then recorded under optimized parameters. The optimized SWV parameters executed were: initial (E): −500 mV, final (E): −1200 mV, square wave amplitude (ESW): 25 mV, potential step (E): 4 mV, square wave frequency (f): 15 Hz. From the voltammograms it was found that the maximum peak current corresponding to CAP reduction was obtained when the sensor was incubated for 5 min after which no significant change in peak current with increasing incubation time was observed. Hence, 5 min was considered as the optimum incubation time and used throughout the experiment. After every run the biosensor was cleaned by scanning the potential window −500 to −1200 mV in the buffer solution in order to carry out the reduction of any adsorbed CAP (if left). The sensor was then rinsed with double distilled water and kept at room temperature for 30 min before recording the next voltammogram.

2.5 Preparation of pharmaceutical and urine sample

In order to analyze the practical applicability of the fabricated sensor, two commercial medicinal samples containing CAP were examined. The CAP containing commercial medicinal formulations like mycin (Syntho Pharmaceuticals Pvt. Ltd, Lucknow, India) and paraxin-250 (Piramal Healthcare Ltd Baddi, Himachal Pradesh) were purchased from the local market of Roorkee. As per the labeled amount (5 mg mL−1) stock solution of mycin was prepared just by dissolving the required volume of formulation in double distilled water. Similarly the tablet containing 250 mg CAP was grounded into a fine powder and then was completely dissolved in double distilled water to prepare 1 L of 0.77 mM solution. Both the stock solution was then further diluted to prepare sample having concentration in the linear working range (500 fM). 2 mL of which was then transferred to a voltammetric cell already having 2 mL of phosphate buffer (pH 7.2) in order to prepare the final test solution.

To evaluate the performance of the aptasensor in a complex matrix, CAP was evaluated in urine samples. Inspite of our best efforts we couldn't find urine samples of patients undergoing treatment with CAP. So, urine samples from 3 healthy volunteers, 2 male (age: 23 and 26 years respectively) and 1 female (24 years old) were collected and diluted 5 times with phosphate buffer (pH 7.2) in order to reduce the matrix complexity. The urine samples having different CAP concentrations were prepared by two methods: one where diluted urine samples were spiked with a known amount of CAP solution whereas in second, the urine samples were first spiked with fixed amount of CAP and then it was diluted to bring the samples in calibration range. Voltammograms were then recorded under optimized conditions for both types of samples. In both the cases practically similar results of the recovery was observed. Hence, it was decided to use the first method for the recovery experiments. Thus, first method of sample preparation was opted for analysis.

3. Results and discussion

3.1 Mechanism behind aptasensing of CAP

In the present work, biosensor was developed using aptamer as a main recognition element, immobilized using glutaraldehyde over polymer modified EPPG surface. Enormous specificity and excellent affinity of the aptamer towards the target molecule explains its growing use in a myriad of sensing techniques.

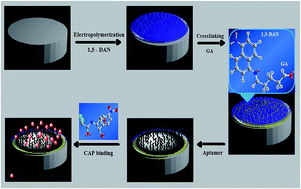
Different structural studies have shown that aptamer recognizes the target by undergoing considerable topological changes attributed to the complementary DNA base pairing, which creates secondary structures like single stranded loops and helical arms, that facilitates aptamer interaction with the target via a number of forces like H-binding, van der Waals forces, electrostatic binding etc.22–24 In the present studies, capturing of the CAP by the aptamer was concluded on the basis of reduction peak observed after the sensor was brought in contact with the target, i.e. CAP, whereas, there was no observable peak before CAP-binding. Thus, it was interpreted that the change in the electrochemical response before and after the aptamer-target binding confirmed the selective recognition of the CAP by the aptamer which was also confirmed using EIS (discussed in following section). The detailed pathway of immobilization and sensing process is outlined in Fig. 1.


image file: c5ra11131e-f1.tif
Fig. 1 Graphical representation of the scheme used for the fabrication of aptasensor.

3.2 Characterization of the biosensor

3.2.1 Characterization of the polymer film using CV. The electropolymerized 1,5-DAN film fabricated on the sensor, was characterized using CV. Fig. 2(A) shows consecutive scans observed during potentiodynamic growth of poly(1,5-DAN) film on the EPPGE surface. In the first scan, a well-defined peak at 0.64 V was observed corresponding to the cationic radical resulted on the oxidation of monomer which was suppressed in the subsequent potential cycles. The suppressed response is known to occur due to the electrocatalytic nature of the oxidized polymer, which pulls electrons away from the monomer and makes the polymer growth feasible.25 During the early stages of polymer growth, two new anodic peaks at ∼0.43 V and ∼0.36 V along with monomer oxidation peak at 0.64 V were witnessed and the peak current of the new anodic peaks thus formed increases with the increasing scans. In the later stages of polymerization, eventually the two anodic peaks merge into one at ∼0.48 V resulting in well-defined anodic and cathodic peaks at ∼0.48 V and ∼0.43 V respectively.
image file: c5ra11131e-f2.tif
Fig. 2 (A) Cyclic voltammograms observed during electropolymerization of 10 mM 1,5-DAN in 1 mM HClO4. SEM image of (B) bare EPPG sensor (C) poly(1,5-DAN) modified EPPG sensor (D) aptamer/GA/poly(1,5-DAN)/EPPG.

The polymer film thus fabricated on the EPPG surface was also characterized using EQCM (electrochemical QCM) and FE-SEM.

3.2.2 Characterization of the biosensor using QCM, FE-SEM. To further check the existence of the modification on the fabricated biosensor, FE-SEM images were taken after every step of fabrication. From Fig. 2(B–D), it can be clearly seen that significant changes occurred on the surface of the sensor after electropolymerization of 1,5-DAN, GA activation and aptamer casting. It was thus concluded that the sensor surface was successfully modified with poly(1,5-DAN), GA and aptamer.

EQCM studies were also performed to determine the amount of 1,5-DAN grown on the sensor after 19 cycles from −0.1 to 1.0 V (Ag/Ag/Cl) at a scan rate of 100 mV s−1. Fig. 3 shows the frequency change recorded during the electropolymerization in a 1.0 M HClO4 solution containing 10.0 mM 1,5-DAN. As the time passed, a decrease in frequency was observed, which was due to the growth of the poly(1,5-DAN) layer on the sensor surface. The frequency change (Δf) was found to be 0.76 kHz. Using the equation reported previously,26 the mass change (Δm) of poly(1,5-DAN) grown after electropolymerization was found to be 0.84 μg. In this case, the surface coverage of the poly(1,5-DAN) was calculated to be 2.7 × 10⁻⁸ mol cm−2.


image file: c5ra11131e-f3.tif
Fig. 3 Frequency changes observed in EQCM while immobilization of aptamer on GA/p-DAN. Inset is the frequency change observed during electropolymerization of 10 mM 1,5-DAN in 1 mM HClO4 on EPPGE.

After polymerization, the poly(1,5-DAN) sensor was immersed into a 25% aqueous solution of GA for 1 h to activate the amine groups of the poly(1,5-DAN). Then, the poly(1,5-DAN)-modified sensor was immersed in the QCM cell containing aptamer solution in order to calculate the maximum amount of aptamer that can be immobilized on the modified surface. The frequency change during the progress of the reaction, indicated immobilization of aptamer onto the poly(1,5-DAN)-GA modified sensor surface. The steady-state frequency change was reached after approximately 40 min with the overall frequency change of 0.32 kHz. In this reaction, mass change observed after immobilization of the aptamer onto the poly(1,5-DAN) was found to be 0.35 μg, where the surface coverage by the aptamer was calculated to be 1.41 × 10⁻¹⁰ mol cm−2 (data not shown). When the optimized volume of 0.1 μM aptamer i.e. 6 μL was casted on the surface, mass change observed was found to be 7.54 ng (Fig. 3).

3.3 Analytical performance of the aptasensor

3.3.1 Electrochemical impedance spectroscopy. EIS was employed to investigate the morphological changes occurring at the surface of the sensor, as the variation in the impedance signal after and before the modification can provide the information about the sensor/solution interface, charge transfer resistance (RCT) etc. Fig. 4 shows the impedance plot recorded over the frequency range of 0.001–105 Hz with an amplitude of 100 μA RMS at 10 points per decade in 5 mM solution of K3[Fe(CN)6] for all the stages that occurred in between modified and unmodified sensor. From the figure, it can be seen that after electro-polymerization of 1,5-DAN, there is a substantial decrease in RCT, which can be attributed to the increased number of functional groups (–NH2) on the electrode surface which facilitate the charge transfer. An abrupt decrease in the RCT was witnessed on the activation of free –NH2 groups via GA. However, after casting aptamer the RCT increases to 3539 Ω from 934 Ω corresponding to GA activated polymer modified sensor. This increase in RCT can be assigned to the repulsion of [Fe(CN)6]4−/3− anions by the negative charges residing on the phosphate backbones of aptamer. However, as soon as the specific target (CAP) is brought in contact with the aptasensor a sharp decrease in RCT is observed. From the results it can be concluded that the aptasensor shows affinity for the specific target and facilitate the electron transfer for its redox processes. From the EIS study it can be seen that RCT for bare EPPG is maximum which may be attributed to the ambiguous properties of the modification which facilitated the charge transfer at the surface of the sensor few among which are good electrical conductivity, high surface area, etc. From the EIS it can be seen that it is the crosslinking via GA which resulted in lowest RCT and is the main reason behind the superior analytical response and since the crosslinking was absent in the previous sensor it showed weak analytical properties.17 The approach of sensor fabrication can be described as follows
image file: c5ra11131e-t1.tif

EPPG–NH2 + OHC–(CH2)3–CHO → EPPG–N[double bond, length as m-dash]CH–(CH2)3–CHO

EPPG–N[double bond, length as m-dash]CH–(CH2)3–CHO + Apta–NH2 → EPPG–N[double bond, length as m-dash]CH–(CH2)3–CH[double bond, length as m-dash]N–Apta

image file: c5ra11131e-f4.tif
Fig. 4 EIS spectra in 5 mM K3[Fe(CN)6] and 1 M KCl showing variation in response corresponding to different steps of fabrication.
3.3.2 Cyclic voltammetry. The cyclic voltammetric response of the aptamer/GA/poly(1,5-DAN)/EPPG biosensor was recorded in a cell holding a 1[thin space (1/6-em)]:[thin space (1/6-em)]1 solution of deoxygenated phosphate buffer (pH 7.2, 1.0 M) and double distilled water. No oxidation reduction peak was observed before CAP–aptamer binding. After incubating the sensor in 500 nM CAP solution, two peaks at −723 mV (Peak I) and + 257 mV (Peak II) were observed when the potential was scanned from −1500 mV to +1500 mV. On further scanning the second sweep in the same solution and at the same sensor, the cathodic peak current was found to decrease with each scan, which was attributed to the reduction of CAP into hydroxylamine derivative (I) whereas, the anodic peak current increases because of increased concentration of hydroxylamine derivative (I).27 Same observation was made in the third scan as shown in Fig. 5 The cathodic peak observed at −723 mV was attributed to the reduction of nitro group present in CAP leading to the formation of hydroxylamine (I), which further oxidized to a nitroso derivative (II)27 as shown by the following equations
R–NO2 + 4H+ + 4e → R–NHOH (I) + H2O

R–NHOH → R–NO (II) + 2H+ + 2e

image file: c5ra11131e-f5.tif
Fig. 5 Repetitive cyclic voltammograms recorded in 500 nM CAP at modified and unmodified sensor in phosphate buffer (pH 7.2, 1.0 M) at a scan rate of 100 mV s−1.
3.3.3 Square wave voltammetry. To quantitatively analyze the detection limit and the performance of the fabricated aptasensor in the working range, SWV was exploited. The increased sensitivity at aptamer/GA/poly(1,5-DAN)/EPPG was manifested by the comparison of square-wave voltammograms of CAP recorded at bare, aptamer/poly(1,5-DAN)/EPPG and aptamer/GA/poly(1,5-DAN)/EPPG as showed in Fig. 6. Aptamer/GA/poly(1,5-DAN)/EPPG shows a sharp and intense cathodic peak at −0.823 V which is attributed to the reduction of –NO2 group of CAP into hydroxylamine group. Under similar environment, aptamer/poly(1,5-DAN)/EPPG exhibits a very feeble CAP reduction peak at slightly higher potential. The substantial increase in the peak current and slight decrease in the peak potential (∼10 mV) observed for aptamer/GA/poly(1,5-DAN)/EPPG demonstrates that after cross linking with GA, the aptasensor exhibits increased sensitivity as well as the efficient electron transfer. To prove the specific binding of aptamer towards CAP, voltammogram was recorded at DNA/GA/poly(1,5-DAN)/EPPG, in which aptamer was replaced by DNA. A very feeble peak for CAP reduction at −853 mV with a peak current of 0.69 μA was obtained when the sensor was scanned in a test solution of 20 μM CAP, while no peak was obtained when the sensor was first dipped in the CAP solution and then scanned in the blank solution (data not shown). No reduction peak corresponding to CAP at DNA/GA/poly(1,5-DAN)/EPPG indicated the specific binding affinity of the aptamer for its target (CAP). This proves that the aptamer binds to CAP selectively and other DNA modification neither provides the similar kind of selectivity nor the sensitivity. Thus, aptamer/GA/poly(1,5-DAN)/EPPG is used for further analysis. Effect of concentration on the peak current of aptasensor was investigated by incubating the sensor in different concentrations of CAP for 5 min and thereafter, recording the voltammogram in a 1[thin space (1/6-em)]:[thin space (1/6-em)]1 solution of buffer (pH 7.2, 1.0 M) and double distilled water (Fig. 7). The calibration plot (inset of Fig. 7) was observed over a linear concentration range of 50 fM to 500 fM with a linear regression equation: Ip (μA) = 0.023CCAP (fM) + 0.760 (R2 = 0.996). Limit of detection equal to 11 fM (n = 3, R.S.D = 0.15%) was calculated using the expression 3s/b, where ‘s’ stands for the standard deviation of the voltammograms recorded in blank solution and b is the slope of the calibration plot. Voltammograms of 200 fM CAP were recorded in pH ranging from 2–10. A slope of ∼58 mV per pH observed for Ep versus pH plot indicates involvement of the equal proton equal electron transfer (data not shown).
image file: c5ra11131e-f6.tif
Fig. 6 Comparison of the square wave voltammograms of 2 nM CAP at (a) bare EPPG, (b) aptamer/poly(1,5-DAN)/EPPG and (c) aptamer/GA poly(1,5-DAN)/EPPG recorded at 15 mV s−1 in phosphate buffer (pH 7.2, 1.0 M).

image file: c5ra11131e-f7.tif
Fig. 7 Square wave voltammograms observed for background phosphate buffer (…) and on increasing the concentration of CAP. Curves were recorded using aptamer/p-AHNSA/EPPG at (a) 50, (b) 75, (c) 150, (d) 200, (e) 250, (f) 300, (g) 400 and (h) 500 fM concentrations. Inset is the calibration plot.

Detection limit (LOD) in fM range indicates a tremendously high change in the sensitivity upon covalent immobilization and is ∼7.5 × 10⁵ times lower in comparison to the previous work based on adsorption of aptamer done by different research groups.17,28 The substantial increase in sensitivity can be assigned to the covalent immobilization of the aptamer as the immobilization directly influences the binding affinity of the target. It is well reported in literature, that immobilization exploiting covalent interaction results in higher surface concentration of the protein and thus leads to increased binding. Moreover, covalent immobilization of aptamer also gives rise to changes in surface characteristics and alters the conformation of binding sites which ultimately affect the binding properties of the sensor.29 Increased sensitivity witnessed on covalent immobilization of aptamer using GA can also be explained on the bases of much reduced RCT in comparison to the RCT observed for the sensor where no crosslinking was used, as it is verified using EIS that the sensor where aptamer was casted in absence of GA crosslinking, RCT of the order of 5000 Ω was observed. This symbolizes that the covalent bonding of GA with the free –NH2 groups of the poly(1,5-DAN) film and immobilization of aptamer resulted in a drastic increase in CAP binding by the aptasensor. This type of GA sandwiched aptasensor leads to a tremendous increase in the stability and sensitivity of the sensor in comparison to one fabricated without crosslinking.

Table 1 clearly indicates that the present sensor is much more sensitive in comparison to the other sensors developed in recent years for the CAP determination.

Table 1 Comparison of the present sensor with recently reported sensors for detection of CAP
Reference Nature of sensor LOD/M
14 MIP/c-MWNTs-AuNPs/GCE 7.43 × 10⁻⁸
15 Pretreated GCE 6.00 × 10⁻⁹
16 Au/Ppy/glutaraldehyde 0.62 × 10⁻⁹
8 Au/thiolated-aptamer 1.60 × 10⁻⁹
27 Boron doped diamond electrode 0.03 × 10⁻⁶
17 EPPGE/p-AHNSA/aptamer 0.02 × 10⁻⁹
31 Electrochemically activated carbon fiber microelectrodes 4.70 × 10⁻⁸
32 Capillary zone electrophoresis following end-column amperometric detection at a carbon fiber micro disc electrode 9.10 × 10⁻⁷
Present work EPPGE/p(1,5-DAN)/aptamer 11.0 × 10⁻¹⁵


3.3.4 Real and pharmaceutical samples. The practical applicability of the fabricated aptasensor was also evaluated by using it for the CAP determination in the Rosetta cells supernatant. Rosetta strains carry a chloramphenicol resistant plasmid, thus was grown in CAP (34 mg mL−1)30 containing media by keeping the strain overnight at 37 °C on stirring at 200 rpm. The cell growth was observed and the culture was centrifuged. CAP was then analysed in the supernatant obtained. CAP concentration was found to be constant with time variation since the cells were resistant to the CAP and thus no uptake or decrease in concentration was observed. Since the concentration used for the culture was 100 mM, hence, to bring it in the working range the supernatant was diluted with phosphate buffer (pH 7.2, 1.0 M). The aptasensor was incubated in the diluted supernatant and voltammogram was recorded. The peak current was used to calculate the concentration of CAP in the supernatant via linear regression equation obtained from the calibration plot and an error of 1.1% was witnessed.

To investigate the performance of the sensor, two pharmaceutical formulations containing CAP were also examined. The results are tabulated in Table 2, and it can be seen that the detected content is in close agreement with the stated values with an error of less than ±1%. The practical application of the sensor in the complex matrix was also investigated by recording SWV in the urine sample of healthy volunteers. Urine samples were prepared as discussed in Section 2.5. Under the optimized conditions, CAP was quantified in the similar dynamic range as in the blank buffer. The linear regression equation for CAP detection in urine can be expressed as follows: Ip (μA) = 0.019CCAP (fM) + 0.739 with a correlation coefficient of 0.994. The results obtained were in favor of the sensor as recovery in all the cases were more than 95.4% with R.S.D < 2%. The validation characteristics for the determination of CAP in urine samples using aptamer/GA/poly(1,5-DAN)/EPPG are tabulated in Table 3. No foreign peak was observed in any of the investigation and thus clearly indicate that sensor was suitable for the selective quantification of CAP. Thus, it can be concluded that the present approach can be successfully employed for the reliable CAP determination.

Table 2 Investigation of CAP in Rosetta cell supernatant and pharmaceutical sample using modified sensor
Investigation Nature of sensor Stated Analyseda Error%
a R.S.D for the analysis was <2% (n = 3).
In vitro Rosetta cell supernatant 89 fM 87.82 fM 1.32
Drug Mycin 5 mg mL−1 4.94 mg mL−1 1.20
Drug Paraxin-250 250 mg 248.3 mg 0.68


Table 3 The validation characteristics for the determination of CAP in urine sample using aptamer/GA/poly(1,5-DAN)/EPPG
Validation parameters Values
Concentration range (fM) 50–500
Correlation coefficient (R2) 0.994
Detection limit (fM) 14.32
Limit of quantification (fM) 47.73
Bias% of peak current 0.385
Sensitivity (μA fM−1) 0.019
Standard error of slope (α, 0.05) ±0.0019
Standard error of intercept (α, 0.05) ±0.5277
Accuracy in linearity (α, 0.05) 145.3 fM ± 0.0524


3.3.5 Specificity. In order to check the extent of specificity of the developed aptasensor, interference study was carried out by analysing the SWV response of the fabricated sensor in a solution containing 100 fM CAP, kanamycin and tetracycline. On comparison of the peak current (Fig. 8), it was found that only CAP responded substantially and negligible or no deviation was observed because of the interferents. This result describes the ability of the developed aptasensor to discriminate between CAP and other biomolecules. The selectivity of the sensor is due to the difference in potential, since the interferent molecules do not show any electrochemical properties in the working range used in the present investigation.
image file: c5ra11131e-f8.tif
Fig. 8 Influence of similar compounds on the peak current of CAP in phosphate buffer (pH 7.2, 1.0 M) under optimal experimental conditions in (A) 100 × 10−15 mol L−1 CAP; (B) 50 × 10−6 mol L−1 tetracycline + (A); (C) 50 × 10−6 mol L−1 kanamycin + (A). Error bars represented standard deviation (n = 3).
3.3.6 Stability and reproducibility. The practical applicability of the biosensor is limited by virtue of low stability; hence, the stability of the present biosensor was analyzed by daily recording SW voltammograms in blank solution for 30 consecutive days. The sensor showed a minimal decrease in current and retains ∼98% of its initial current indicating thereby, that the aptasensor is quite stable and bears a long life. The sensor based on adsorption required frequent cleaning of the surface to remove adsorbed material,17 whereas, the present sensor did not require any such cleaning of the surface and was sufficiently stable.

The reproducibility of the fabricated sensor was also investigated by measuring the intraday current response by recording 5 consecutive voltammograms and also by monitoring sensor to sensor variation. The results obtained were encouraging as the sensor showed a deviation of about 1.88% on the same sensor and that of 3.25% within different sensors modified with the same approach. Hence, the present approach of the biosensor results in a stable sensor which is attributed to the covalent linking of the aptamer with GA and activation of the free amino groups of poly(1,5-DAN) film by Schiff base interaction via –CHO groups of GA.31

4. Conclusion

In the present approach, an aptasensor for CAP determination was fabricated exploiting the cross linking properties of GA with the amino groups of the poly(1,5-DAN), which resulted in highly stable, sensitive and efficient sensor. The use of amino functionalized monomer for the modification and the crosslinking of –NH2 groups with the aldehyde groups of GA lead to a tremendous enhancement in stability and sensitivity which makes the present sensor an efficient candidate for the practical utility. The study demonstrates the applicability of the proposed sensor in complex matrices like analysis of CAP in the Rosetta cell supernatant and commercially available pharmaceutical samples with substantial sensitivity and reproducibility. The detection limit for the proposed sensor is found to be in femto molar range (11 fM), which is lowest witnessed amongst literature within the limits of our knowledge. It was found that the crosslinking with GA resulted in 750k folds increased sensitivity and similar selectivity as compared to the previously fabricated sensor which exploited the polymer modified aptasensor for analysis.17 This approach thus offers a simple, rapid, and a low cost technique for the detection of CAP for various purposes such as diagnosis of drug resistant bacteria and virus or for checking its adulteration in food and other dietary supplements as well as medicines.

Acknowledgements

One of the authors (Rosy) is thankful to the Ministry of Human Resources, New Delhi for awarding Senior Research Fellowship. Thanks are due to the Korean Federation of Science and Technology, South Korea for awarding Brain Pool Fellowship to RNG. Financial assistance for this work was provided by the Council of Science and Technology, New Delhi vide grant no. 01/2419/10-EMR-II. The research is also partially supported by Basic Science Research Program through National Research Foundation of Korea (Grant number: 20100029128).

References

  1. P. Khandeparkar, J. Assoc. Physicians India, 2010, 58, 45–46 Search PubMed .
  2. J. Ehrlich, Q. R. Bartz, R. M. Smith, D. A. Joslyn and P. R. Burkholder, Science, 1947, 417 CAS .
  3. J. A. Turton, A. C. Havard, S. Robinson, D. E. Holt, C. M. Andrews, R. Fagg and T. C. Williams, Food Chem. Toxicol., 2000, 38, 925–938 CrossRef CAS .
  4. R. H. Enting, L. Spanjaard, D. van de Beek, E. F. Hensen, J. de Gans and J. Dankert, J. Antimicrob. Chemother., 1996, 38, 777–786 CrossRef CAS PubMed .
  5. J. C. Hanekampa and A. Bast, Environ. Toxicol. Pharmacol., 2015, 39, 213–220 CrossRef PubMed .
  6. N. E. Raz, A. Lador, Y. L. Weissman, M. Elbaz, M. Paul and L. Leibovici, J. Antimicrob. Chemother., 2015, 70, 979–996 Search PubMed .
  7. EU MRPLs 2003/181/EC, dated 3/13/2003.
  8. S. Pilehvar, J. Mehta, F. Dardenne, J. Robbens, R. Blust and K. D. Wael, Anal. Chem., 2012, 84, 6753–6758 CrossRef CAS PubMed .
  9. A. Gantverga, I. Shishania and M. Hoffman, Anal. Chim. Acta, 2003, 483, 125–135 CrossRef .
  10. P. Li, Y. Qiu, H. Cai, Y. Kong, Y. Tang, D. Wang and M. Xie, Chin. J. Chromatogr., 2006, 24, 14–18 CrossRef CAS .
  11. H. Y. Shen and H. L. Jiang, Anal. Chim. Acta, 2005, 535, 33–41 CrossRef CAS PubMed .
  12. S. Lin, S. Han, Y. Liu, W. Xu and G. Guan, Anal. Bioanal. Chem., 2005, 382, 1250–1255 CrossRef CAS PubMed .
  13. A. Wang, L. Zhang and Y. Fang, Anal. Chim. Acta, 1999, 394, 309–316 CrossRef CAS .
  14. H. Zhao, Y. Chen, J. Tian, H. Yu and X. Quan, J. Electrochem. Soc., 2012, 159, J231–J236 CrossRef CAS PubMed .
  15. H. Alemu and L. Hlalele, Bull. Chem. Soc. Ethiop., 2007, 21, 1–12 CrossRef CAS .
  16. N. A. Karaseva and T. N. Ermolaeva, Talanta, 2012, 93, 44–48 CrossRef CAS PubMed .
  17. S. K. Yadav, B. Agrawal, P. Chandra and R. N. Goyal, Biosens. Bioelectron., 2014, 55, 337–342 CrossRef CAS PubMed .
  18. R. Pauliukaite, M. E. Ghica, O. F-Filho and C. M. A. Bret, Anal. Chem., 2009, 81, 5364–5372 CrossRef CAS PubMed .
  19. C. J. S. M. Silva, F. Sousa, G. Gübitz and A. C-Paulo, Food Technol. Biotechnol., 2004, 42, 51–56 CAS .
  20. G. D. Christian and W. C. Purdy, J. Electroanal. Chem., 1962, 3, 363–367 CAS .
  21. S. K. Yadav, B. Agrawal and R. N. Goyal, Talanta, 2013, 108, 30–37 CrossRef CAS PubMed .
  22. M. Famulok and G. Mayer, Acc. Chem. Res., 2011, 44, 1349–1358 CrossRef CAS PubMed .
  23. D. H. Burke, D. C. Hoffmanll, A. Brown, M. Hansen, A. Pardi and L. Gold, Chem. Biol., 1997, 4, 833–843 CrossRef CAS .
  24. J. Mehta, B. V. Dorsta, E. R-Martin, W. Herrebout, M.-L. Scippo, R. Blust and J. Robbens, J. Biotechnol., 2011, 155, 361–369 CrossRef CAS PubMed .
  25. S.-Y. Hong and S.-M. Park, J. Electrochem. Soc., 2003, 150, E360–E365 CrossRef CAS PubMed .
  26. T.-Y. Lee and Y.-B. Shim, Anal. Chem., 2001, 73, 5629–5632 CrossRef CAS .
  27. S. Chuanuwatanakul, O. Chailapakul and S. Motomizu, Anal. Sci., 2008, 24, 493–498 CrossRef CAS .
  28. I. R. Olmsted, A. Kussrow and D. J. Bornhop, Anal. Chem., 2012, 84, 10817–10822 CrossRef CAS PubMed .
  29. B. Zhu, O. A. Alsager, S. Kumar, J. M. Hodgkiss and J. T. Sejdic, Biosens. Bioelectron., 2015, 70, 398–403 CrossRef CAS PubMed .
  30. D. Narasaiah, Biosens. Bioelectron., 1994, 9, 415–422 CrossRef CAS .
  31. M. L. Mena, L. Agüí, P. Martinez-Ruiz, P. Yáñez-Sedeño, A. J. Reviejo and J. M. Pingarrón, Anal. Bioanal. Chem., 2003, 376, 18–25 CAS .
  32. W. Jin, X. Ye, D. Yu and Q. Dong, J. Chromatogr. B: Biomed. Sci. Appl., 2000, 741, 155–162 CrossRef CAS .

This journal is © The Royal Society of Chemistry 2015