DOI:
10.1039/C5RA10981G
(Paper)
RSC Adv., 2015,
5, 59522-59532
Ultrasound-assisted removal of Al3+ ions and Alizarin red S by activated carbon engrafted with Ag nanoparticles: central composite design and genetic algorithm optimization
Received
9th June 2015
, Accepted 23rd June 2015
First published on 24th June 2015
Abstract
In this study, activated carbon engrafted with Ag nanoparticles (Ag-NPs–AC) was prepared and applied for ultrasonic assisted simultaneous removal of aluminum (Al3+) ions and Alizarin red S (ARS) dye from an aqueous medium. The physicochemical properties of Ag-NPs–AC were determined by different techniques such as SEM and FTIR. The effects of various operating parameters on the extent of adsorption were investigated. Optimum conditions were determined in order to achieve maximum removal percentage from the binary mixture. It was observed that the maximum performance for both the species was achieved at a pH of 6. The influence of different variables, such as the concentration of initial Al3+ (mg L−1) ions, ARS (mg L−1), adsorbent mass (mg) and sonication time (s), were studied using central composite design (CCD) combined with a desirability function approach (DFA) and genetic algorithm (GA). The isotherm models for the adsorption process were evaluated and the equilibrium data were accurately described by the Langmuir model with the maximum monolayer adsorption capacity for Al3+ ions and ARS as 222.2 and 232.6 mg g−1, respectively.
1. Introduction
Aluminum (Al3+) ions are one of the most abundant toxic compounds and have a wide application in various industries; moreover, they exist in high concentrations in the earth's crust in various mineral forms. This element and its compounds have long duration stability as environmental contaminants. Accumulation of aluminum in the hypothalamic region of the brain causes Alzheimer's disease.1–3 Alizarin Red S (anthraquinone dye) is extensively applied in various fields for textile and wool coloring and also in the finishing process of woven fabrics.4–7 The simultaneous presence of ARS and Al3+ ions in wastewater leads to carcinogenic, mutagenic, and allergenic diseases and also disturbs the aquatic life. The presence of these two compounds in food materials causes resistance to natural biological degradation.8–10 These hazards and problems have encouraged researchers to design safe and clean procedures for their efficient removal before arriving to aqueous media. Coagulation, chemical oxidation, adsorption and electrochemical methods are conventional approaches applied by researchers to achieve such aims.11–13 In addition, adsorption has more applicability in removing pollutants from different sources.14,15 The lower initial cost, flexibility and simplicity of design, ease of operation and sensitivity to toxic pollutants are good criteria that rationalized such wide application of these methods.13,16 The selection of an appropriate adsorbent is a key factor for the adsorption process, and high surface area, porous structure and faster adsorption kinetics are factors that render carbon-based materials (granular or powder) as potential candidates for adsorption processes. Furthermore, these materials are loaded with various nanoparticles in order to increase their surface area and efficiency.17–20 The improvement in performance of adsorption procedure following the combined application of ultrasonic waves with nano-structure adsorbents is due to the high-pressure shake waves and high-speed micro jets during the violent collapse of cavitation bubbles.10,21 Multivariate optimization tools such as a response surface methodology (RSM) provides an empirical mathematical model that correlates experimental removal percentage with various effective parameters that give useful information about the numerical value of each factor and also the magnitude of the variables interaction. Central composite design (CCD)22,23 combined with desirability function (DF) gives information about real optimization without localized doubtful optimum point confusion.24,25 Recently, some studies have attempted to provide a new approach for experimental optimization. They suggested using coupling CCD with genetic algorithms (GAs) to sweep a region of interest and select the optimal (or near optimal) settings for a process. GA is a global optimization algorithm, and the objective function does not need to be differentiable. This allows the algorithm to be used in solving difficult problems, such as multimodal, discontinuous or noisy systems.26–29
In this study, activated carbon engrafted with Ag nanoparticles (Ag-NP–AC) was prepared and used for simultaneous ultrasonic assisted removal of Al3+ ions and ARS. Central composite design (CCD) was used for the optimization and estimation of the influence of important variables (sonication time, initial dye and Al3+ ions concentration and amount of adsorbent) in a batch mode. The importance of the model and the effect of magnitude of each individual variable or variable interactions were evaluated by analysis of variance (ANOVA) as well as results obtained of CCD coupling with the DF and GA method.
2. Experimental
2.1. Materials and apparatus
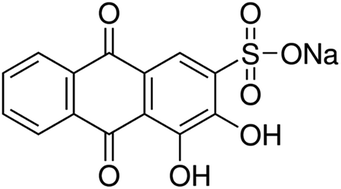
All the chemicals were used as received without further purification from Merck. The equipment was used according to the manufacturer's recommendation corresponding to previous publications.17–20 The structure of the dye is shown in Fig. 1. Al3+ ion concentration was determined by an atomic absorption spectrophotometer Varian model AA 220 at λ = 396 nm.
 |
| Fig. 1 Chemical structure of Alizarin Red S. | |
2.2. Preparation of activated carbon engrafted with Ag nanoparticles
A typical experiment for the synthesis of Ag nanoparticles was conducted as follows: 0.148 g of silver nitrate (AgNO3) was dissolved in 100 mL of doubly distilled water and subsequently refluxed under stirring at 95 °C for 40 min. Tri-sodium citrate solution (40 mL of aqueous solution containing 2 g sodium citrate) acting as both a reducing and stabilizing agent was added dropwise, causing the formation of Ag NP. Then, 100 mL of AC suspension was added to generate silver ion grafted on activated carbons (AC–COO−Ag+). During the process, solutions were mixed vigorously and refluxed for 12 h. The mechanism of the reaction can be expressed as follows:30,31
4Ag+ + C6H5O7Na3 + 2H2O → 4Ag + C6H5O7H3 +3Na+ + H+ + O2↑ |
The solid product (Ag-NP–AC) was then separated by filtration, washed with doubly distilled water and dried at 80 °C for 12 h.
2.3. Response surface design
Response surface methodology (RSM) with minimum number of experimental runs is able to evaluate the interaction effects of variables without preliminary screening tests.32 In this study, a small composite design permits optimization with a lower magnitude of adsorbents in a short time and it is known as minimal-point designs. The abovementioned model is based on a five-level small CCD to study the dependency of ultrasonic assisted removal efficiency on variables and predict their real behavior (Table 1). The design matrix and their respective responses (Table 2) give useful information about the applicability of the proposed method. The Al3+ ion concentration determination in a binary solution was carried out spectrophotometrically and re-calibrated by atomic absorption spectrophotometry. Details of the CCD performance and its combination with desirability function have been extensively discussed in our previous publications.4–7 The present study has four main effects (four two-factor curvature effects) that significantly influence the removal percentage. The significance levels of each variable are judged according to their p-value and F-value following analysis of variance (ANOVA). The multiple correlation coefficient R2 (the adjusted R2 and predicted R2 values), F-value, “Adeq Precision,” representation of graphical interpretation of the interactions of variable, determination of the best operating conditions of a process and the three-dimensional (3D) plots are highly recommended.22,33
Table 1 Experimental factors and levels in the central composite design
Factors |
Unit |
Surface factors |
Levels |
Star point α = 2 |
(Low) |
(Central) |
(High) |
−α |
+α |
−1 |
0 |
+1 |
(x1) ARS dye concentration |
mg L−1 |
9 |
15 |
21 |
5 |
25 |
(x2) Al3+ ions concentration |
mg L−1 |
9 |
15 |
21 |
5 |
25 |
(x3) Adsorbent dosage |
mg |
7 |
10 |
13 |
5 |
15 |
(x4) Sonication time |
s |
75 |
140 |
205 |
30 |
250 |
Table 2 The design matrix and the responses
Runs |
Block |
X1 |
X2 |
X3 |
X4 |
R1 % |
R2 % |
Standard method for determination of Al3+ ions concentration |
1 |
1 |
15 |
15 |
10 |
140 |
89.4 |
89.1 |
87.23 |
2 |
1 |
21 |
21 |
7 |
75 |
53 |
51 |
49.5 |
3 |
1 |
15 |
15 |
15 |
140 |
100 |
100 |
98.7 |
4 |
1 |
9 |
21 |
13 |
205 |
95 |
79 |
80.3 |
5 |
1 |
15 |
5 |
10 |
140 |
90 |
100 |
97.9 |
6 |
1 |
15 |
15 |
5 |
140 |
80 |
65 |
66.7 |
7 |
1 |
21 |
9 |
13 |
205 |
81 |
89 |
88 |
8 |
1 |
15 |
25 |
10 |
140 |
89 |
59 |
61.1 |
9 |
1 |
21 |
9 |
7 |
205 |
75 |
81 |
80.2 |
10 |
1 |
9 |
21 |
7 |
205 |
88 |
65 |
63.8 |
11 |
1 |
15 |
15 |
10 |
140 |
91.8 |
84.1 |
82.9 |
12 |
1 |
5 |
15 |
10 |
140 |
100 |
63 |
64.8 |
13 |
2 |
15 |
15 |
10 |
140 |
92 |
84.2 |
82.3 |
14 |
2 |
9 |
9 |
13 |
74 |
97 |
95 |
93.6 |
15 |
2 |
9 |
9 |
7 |
75 |
85 |
81 |
83 |
16 |
2 |
25 |
15 |
10 |
140 |
55 |
88 |
86.3 |
17 |
2 |
15 |
15 |
10 |
30 |
73 |
68 |
70.3 |
18 |
2 |
15 |
15 |
10 |
140 |
92 |
88.9 |
84.1 |
19 |
2 |
15 |
15 |
10 |
250 |
95 |
93 |
91.2 |
20 |
2 |
15 |
15 |
10 |
140 |
89.5 |
89 |
85.4 |
21 |
2 |
21 |
21 |
13 |
75 |
67 |
61 |
63.5 |
The main advantage of desirability functions is the ability to obtain qualitative and quantitative responses by a simple, rapid transformation and an easily understandable signal.34,35
2.4. Principle of genetic algorithm
Genetic algorithms (GAs) are computerized searches and optimization algorithms based on the mechanics of natural genetics and natural selection36 with various mapping techniques, and the appropriate measurements of fitness can be tailored to evolve a solution for many types of problems, including function optimization in order of a sequence37 based on Darwinian's theory of survival of the fittest.38 The start of genetic algorithms operation is based on the solutions represented by chromosomes (population). Each population analysis leads to generation of new ones that must be better than the previous ones. Furthermore, solutions are selected according to their fitness to form new solutions known as offsprings. The abovementioned process is repeated until some condition is satisfied. A flowchart of the working principles of a GA is shown in Fig. 2.
 |
| Fig. 2 Flow chart of a conventional GA optimization procedure. | |
In the GA flowchart, the crossover operator is mostly responsible for the progress of the search. It swaps the parent strings, partially causing offsprings to be generated. In this case, a crossover site along the length of the string is selected randomly, and the portions of the strings beyond the crossover site are swapped. A mutation operator is the occasional random alteration (with a small probability) of the value of a string position. This simply means changing 0 to 1. Selection is responsible for the choice of which individual and how many copies of it will be passed to the next generation.26–29
3. Results and discussion
3.1. Characterization of adsorbent
The scanning electron microscopy (SEM) images of silver nanoparticles deposited on activated carbon at different magnifications (Fig. 3a and b) reveal the successful loading of Ag nanoparticles on activated carbon as well-dispersed spherical nanoparticles with some aggregation, and they are relatively uniform in shape and size distribution (40–70 nm).39 The FT-IR spectrum of Ag-NPs-loaded AC (Fig. 3c) did not show peaks corresponding to impurities such as AgO and AgOH, thus confirming its high purity (Fig. 3c). The peak at 320 cm−1 is due to the Ag vibration mode of the Ag-NPs. The broad absorption peak in the range of 3300–600 cm−1 is attributed to H–O–H bending and the vibration mode of H2O arises from the presence of a trace amount of adsorbed water on the surface of Ag–NPs–AC. The peak around 1100 cm−1 corresponds to the vibration mode of H–O–H around 1600 cm−1 and is assigned to H–O–H bending.39
 |
| Fig. 3 SEM images (a) and (b) and FT-IR spectrum (c) of the Ag-NPs–AC. | |
3.2. Spectral characteristics
Absorbance spectra of single solutions of ARS (15 mg L−1) and binary solutions of ARS and Al3+ ions at different concentrations (Fig. 4) indicate one maximum at 430 nm. Addition of different concentrations of Al3+ ions to the ARS solutions leads to the formation of a complex among them, which causes a change in maximum absorbance and appearance of new peaks at 430 and 505–540 nm as well as presence of isosbestic point a sign of complex formation. The appropriate wavelength for the measurement of Al3+ ion concentration in a binary solution was examined by drawing a calibration curve for Al3+ ion (1–24 mg L−1) in a binary solution at two wavelengths of 510 nm and 520 nm (Fig. 5a and b). The ΔA (Fig. 5) (the difference between the absorbance of the ARS dye alone and the absorbance of the Al3+–ARS complex) was plotted against Al3+ ion concentration to depict the calibration curve. The correlation coefficient (R2) for wavelengths of 510 nm and 520 nm was 0.991 and 0.994, respectively. According to these values, a wavelength of 520 nm was selected as the best wavelength for the further studies of Al3+ ions monitoring in a binary solution. The wavelength of 430 nm has a higher sensitivity for the analytical measurement of ARS content in a binary solution.
 |
| Fig. 4 Change in UV-Vis spectra on addition of 5–15 mg L−1 Al3+ ions to 15 mg L−1 ARS at pH 6. | |
 |
| Fig. 5 Calibration curve for Al3+ ions in the range of 1–24 mg L−1 in a binary solution at pH 6 at 510 nm (a) and 520 nm (b). | |
Fig. 6 shows the absorption spectrum corresponding to 15 mg L−1 of ARS and Al3+ ions before and after removal during 150 s at pH 6 using different amounts of adsorbent (5–11 mg). It was seen that for the two wavelengths specified above, increasing the adsorbent dose led to a significant decrease in absorbance (enhancement in removal percentage).
 |
| Fig. 6 Absorption spectrum of 15 mg L−1 ARS and 15 mg L−1 Al3+ ions at pH 6 in different adsorbent dosages (0–11 mg). | |
3.3. Effect of pH
The effects of initial solution pH on the simultaneous adsorption of ARS and Al3+ ions over the Ag-NPs–AC surface were investigated and the results are shown in Fig. 7. The results reveal that the simultaneous removal of ARS and Al3+ ions accelerates and increases on increasing the pH from 2 to 6 and the maximum value is assigned to a pH of 6. Their removal percentage decreases thereafter with increasing pH. The nature of adsorption of Al3+ ions and ARS dye onto the Ag-NPs–AC surface is a combination of various mechanisms and binding pathways such as hydrogen bonding, electrostatic, soft–soft and dipole–ion interactions. The dye adsorption beyond pH 6 was reduced due to the inter-ionic repulsion of negative charge adsorbent surface with adsorbent molecules. At acidic pH, both adsorbent and adsorbate became positive, which further reduces the complexation of Al3+ ions and ARS and leads to a subsequent reduction in their removal percentages.
 |
| Fig. 7 Effect of pH on the removal of binary solution of (ARS (7 mg L−1)) (a) and (Al3+ ions (15 mg L−1)) in the pH range of 2–9. | |
3.4. Analysis of central composite design
Central composite design was used for the optimization of the variables, including the removal percentage of the Al3+ (R1) and ARS (R2), and the respective results are shown in Table 2. The statistical significance of the quadratic model was predicted by ANOVA based on R1 and R2 as the response (Table 3). The result revealed that the F-value of the model for Al3+ ions and ARS removal is 16.7 and 50.4, respectively. A very low p-value (<0.0001) proves the ability and suitability of the model for good and practical prediction of the behavior of Al3+ ions and ARS adsorption. The “lack of fit F-value” of this model for the simultaneous removal of Al3+ ions and ARS dye is 5.3 and 6, respectively, thus confirming it is not relatively significant to the pure error. The value of the determination coefficient R2 (0.975 and 0.991) and the adjusted R2 (0.917 and 0.971) for the simultaneous removal of Al3+ ions and ARS, respectively, indicates that the response surface quadratic model is the most appropriate for predicting the performance of simultaneous adsorption of Al3+ ions and ARS onto Ag-NPs–AC. “Adeq Precision” ratio of this model for simultaneous removal of Al3+ ions and ARS is 14.2 and 24, respectively. Both the values are greater than 4.0 (acceptable level), indicating that the signal is sufficient to model and support the data analysis. This gives a semi-empirical expression (R%) for the simultaneous removal of Al3+ ions and ARS dye. |
R1 = 42.62 + 4.683897X3 + 0.31346X4 − 0.15186X12 − 0.00072X42 + 0.01048X1X4
| (1) |
|
R2 = 55.963 − 5.87557X2 − 0.122491X12 − 0.08249X22 + 0.03132X2X4
| (2) |
Table 3 The results of ANOVA for the response surface quadratic model for R1 and R2
Source variation |
R1 |
R2 |
SSa |
DFb |
MSc |
F-value |
p-value |
SS |
DF |
MS |
F-value |
p-value |
Sum of square. Degree freedom. Mean square. |
X1 |
1012.500 |
1 |
1012.500 |
544.9408 |
0.000020 |
312.500 |
1 |
312.5000 |
44.2447 |
0.002653 |
X12 |
431.344 |
1 |
431.344 |
232.1552 |
0.000108 |
281.210 |
1 |
281.2100 |
39.8145 |
0.003226 |
X2 |
0.500 |
1 |
0.500 |
0.2691 |
0.631309 |
840.500 |
1 |
840.5000 |
119.0004 |
0.000401 |
X22 |
19.078 |
1 |
19.078 |
10.2679 |
0.032764 |
127.742 |
1 |
127.7422 |
18.0861 |
0.013129 |
X3 |
386.324 |
1 |
386.324 |
207.9245 |
0.000134 |
805.178 |
1 |
805.1778 |
113.9994 |
0.000436 |
X32 |
13.575 |
1 |
13.575 |
7.3063 |
0.053926 |
51.870 |
1 |
51.8696 |
7.3438 |
0.053540 |
X4 |
242.000 |
1 |
242.000 |
130.2476 |
0.000336 |
312.500 |
1 |
312.5000 |
44.2447 |
0.002653 |
X42 |
141.252 |
1 |
141.252 |
76.0237 |
0.000953 |
98.715 |
1 |
98.7153 |
13.9764 |
0.020147 |
X1X2 |
12.160 |
1 |
12.160 |
6.5448 |
0.062752 |
57.969 |
1 |
57.9690 |
8.2074 |
0.045705 |
X1X3 |
0.125 |
1 |
0.125 |
0.0673 |
0.808146 |
12.500 |
1 |
12.5000 |
1.7698 |
0.254187 |
X1X4 |
55.099 |
1 |
55.099 |
29.6551 |
0.005522 |
2.924 |
1 |
2.9241 |
0.4140 |
0.554979 |
X2X3 |
1.125 |
1 |
1.125 |
0.6055 |
0.479950 |
0.500 |
1 |
0.5000 |
0.0708 |
0.803339 |
X2X4 |
16.829 |
1 |
16.829 |
9.0576 |
0.039566 |
491.802 |
1 |
491.8020 |
69.6308 |
0.001127 |
X3X4 |
21.125 |
1 |
21.125 |
11.3698 |
0.027994 |
0.500 |
1 |
0.5000 |
0.0708 |
0.803339 |
Lack of fit |
22.522 |
2 |
11.261 |
6.0607 |
0.061562 |
74.879 |
2 |
37.4394 |
5.3008 |
0.075045 |
Pure error |
7.432 |
4 |
1.858 |
|
|
28.252 |
4 |
7.0630 |
|
|
Total SS |
3558.312 |
20 |
|
|
|
4143.332 |
20 |
|
|
|
Another convenient expression of this model is expressed using comparing the experimental and model predicted data. Fig. 8a and b show the normal probability plots of the predicted values versus observed values to check the normality of residuals for the simultaneous removal of Al3+ ions and ARS, respectively. The good fitting corresponds to the plots of experimental values of removal % versus calculated value, which shows the high efficiency of the model for the prediction of the behavior of adsorption system.
 |
| Fig. 8 Experimental data versus the predicted data of normalized simultaneous removal of ARS (a) and Al3+ ions (b). | |
3.5. Optimization of CCD by DF for the simultaneous removal of Al3+ ions and ARS
The desirable profile response for each dependent variable (removal percentage) by assigning predicted values is shown in Fig. 9. The scale used is in the range from 0.0 (undesirable) to 1.0 (very desirable) in order to obtain a global function that should be maximized after the accurate and repeatable optimization of experimental variables. Results of the CCD matrix (Table 2) reveal that at various applied conditions, the removal percentage of Al3+ ions and ARS are maximum (100% and 100%), minimum (51% and 53%) and middle (75.5% and 76.5%). DFA settings for each dependent variable are shown on the right side of Fig. 9 and the individual desirability scores are illustrated on the left side of Fig. 9 (bottom). Since desirability 1.0 was selected as the target value, the overall response obtained from these plots with the current level of each variable in the model is depicted at the top (left) of Fig. 9. These calculations have a possible desirability score of 0.85 at optimum conditions set as 140 s of sonication time, 10 mg of adsorbent, 15 mg L−1 of Al3+ ions and ARS concentration at pH 5 that is associated with maximum recovery of 87.28% and 91.5%, respectively.
 |
| Fig. 9 Profile for predicated values and desirability function for simultaneous removal percentage of ARS and Al3+ ions. | |
3.6. Optimization of CCD by GA for the removal Al3+ ions and ARS
The GA technique was applied to optimize the input fitness functions formulated in eqn (1) and (2) of the central composite design model for all parameters. For maximizing the efficiency of the present method, the following conditions were applied to the GA program using the MATLAB software: initial population size considered while running the GA is 20 and values of 0.60 and 0.001 were selected as the optimum conditions for crossover and mutation operator, respectively. Total generation for the GA program in this case was considered to be 60. Moreover, the optimum functions for crossover, selection, mutation and migration were single point, roulette, Gaussian and direction forward, respectively. All results obtained from the GA program are shown in Fig. 10 and 11.
 |
| Fig. 10 Converged (best individual) values of parameters for the simultaneous removal of ARS (a) and Al3+ ions (b). | |
 |
| Fig. 11 GA predicted plot for minimum overcut for simultaneous removal of ARS (a) and Al3+ ions (b). | |
Fig. 10a and b illustrate the GA optimized conditions for the simultaneous removal of ARS dye and Al3+ ions, respectively. From Fig. 10a, the optimum values of initial concentration of Al3+ (15.004 mg L−1), initial concentration of ARS dye (15.004 mg L−1), adsorbent dosage (10.498 mg) and sonication time (14.99 s) were obtained. Considering Fig. 10b, the optimum values of initial concentration of Al3+ (14.01 mg L−1), initial concentration of ARS dye (15.006 mg L−1), adsorbent dose (10.269 mg), and sonication time (140.99 s) were obtained. These results were cross validated by carrying out the batch method study at the aforesaid GA-specified optimum conditions. The simultaneous removal of Al3+ ions and ARS dye achieved during experimental conditions was 91.3 and 87.5, respectively, which was in close agreement with the predicted value through the hybrid CCD-GA technique.
Fig. 11a and b represent the best fitness plot achieved during the iterations of GA over 60 generations and describe the gradual convergence of results toward the optimal solution for simultaneous the removal of ARS dye and Al3+ ions, respectively. The predicted optimum simultaneous removal of Al3+ ions and ARS dye conditions by DFA and GA are further compared with experimental results for the same set of parameters (Table 4). According to Table 4, it may be seen that results obtained from DFA and GA-based optimization are in good agreement with experimental observations.
Table 4 Comparison of optimum removal percentage from DFA and GA for Al3+ ions and ARS dye
Factors |
R2 |
R1 |
DFA |
GA |
DFA |
GA |
ARS concentration (mg L−1) |
15 |
15.006 |
45 |
15.004 |
Al3+ ions concentration (mg L−1) |
15 |
15.01 |
15 |
15.004 |
Adsorbent dose (mg) |
10 |
10.269 |
10 |
10.498 |
Sonication time (s) |
140 |
140.299 |
140 |
140.99 |
Response (R%) |
87.2 |
87.5 |
91.5 |
91.3 |
3.7. Response surface plots
The response surfaces method was applied for the depicted the response surface plots of removal percentage (R%) of Al3+ ions and ARS versus significant variables (Fig. 12) while their curvatures are a strong indication of the existence of interaction. The influence of initial ARS and Al3+ ions concentration on its removal percentage was investigated and the results are shown in Fig. 12a–e. A significant reduction in target compounds removal percentage is observed after increasing their initial concentration. This behavior is related to the increase in the ratio of target compounds to adsorbent surface area and reactive sites that follow a strong reduction in mass transfer.
 |
| Fig. 12 Response plots of X2X4 for the removal of ARS (a), X2X4 for the removal of Al3+ ions (b), X1X4 for the removal of ARS (C), X3X4 for the removal of ARS (d) and X1X2 for the removal of Al3+ ions (e). | |
The variation in ARS and Al3+ ion removal percentage with contact time (Fig. 12a–d) indicates that the occurrence of the maximum amount of adsorbed species is within initial 200 s (equilibrium) and proves the very fast adsorption rate. This observation was due to the rapid uptake and quick establishment of equilibrium in the presence of ultrasound power.
The effect of adsorbent mass on the compounds removal percentage (Fig. 12d) reveal high and enhancement removal percentage with adsorbent mass till 14 mg and subsequently increase with very slow slope. This fact can be attributed to greater surface area and availability of more adsorption sites. After this critical dose, the extent of adsorption increasingly slows down due to the fact that although there is an increasing number of active sites, there is a shortage of the dye in the solution.
3.8. Adsorption equilibrium study
Adsorption isotherms provide fundamental knowledge about the adsorption process. The experimental equilibrium data in this study for species adsorption onto Ag-NPs–AC correspond to the conventional Langmuir, Freundlich, Temkin and Dubinin–Radushkevich methods.4,40,41 Based on their traditional equation (Table 5), the applicability and suitability of the these models for the prediction of real behavior of adsorption process were calculated. All the model constants and other parameters were evaluated from the slopes and intercepts of the respective model equations (Table 5) and are summarized below.
Table 5 Isotherm constant parameters and correlation coefficients calculated for the adsorption of ARS dye and Al3+ions on Ag-NPs–AC
Isotherm |
Equation |
Parameters |
Value of parameters for ARS |
Value of parameters for AL3+ |
Langmuir |
qe = qmbCe/(1 + bCe) |
Qm (mg g−1) |
232.6 |
222.2 |
Ka (L mg−1) |
143.3 |
163.7 |
R2 |
99.43 |
99.73 |
Freundlich |
ln qe = ln KF + (1/n) ln Ce |
1/n |
0.18 |
0.266 |
KF (L mg−1) |
6.75 |
6.75 |
R2 |
91.16 |
79.5 |
Temkin |
qe = B1 ln KT + B1 ln Ce |
B1 |
27.3 |
49.5 |
KT (L mg−1) |
736.8 |
755.7 |
R2 |
82.79 |
73.4 |
Dubinin–Radushkevich (DR) |
ln qe = ln Qs − Bε2 |
Qs (mg g−1) |
221.4 |
257.2 |
B |
−3 × 10⁻⁹ |
−1 × 10⁻⁸ |
E (kJ mol−1) |
18181.8 |
7092.2 |
R2 |
85.4 |
79.63 |
Langmuir adsorption isotherm assumes that monolayer adsorption occurs at the binding sites of uniform surface of the adsorbent.42 In this model, values of KL (the Langmuir adsorption constant, L mg−1) and Qm (theoretical maximum adsorption capacity, mg g−1) were obtained from the intercept and slope of the plot of Ce/Qe versus Ce, respectively (Table 5). The Freundlich isotherm model is empirical in nature and describes the adsorption characteristics for the heterogeneous adsorbent surface.43 In this model, n (the capacity and intensity of the adsorption) and KF (indicator of adsorption capacity ((mg g −1)/(mg L−1))1/n) were calculated from the slope and intercept of the linear plot of ln
Qe versus ln
Ce, respectively. The Temkin isotherm model contains a factor corresponding to adsorbent–adsorbate interactions. In this model, B is the Temkin constant related to heat of adsorption (J mol−1), T is the absolute temperature (K), R is the universal gas constant (8.314 J mol−1 k−1) and KT is the equilibrium binding constant (L mg−1). In the D–R isotherm model, K (mol2 kJ−2) is a constant related to the adsorption energy, Qm (mg g−1) is the theoretical saturation capacity, and ε is the Polanyi potential. The slope of the plot of ln
qe versus ε2 gives K and the intercept yields the Qm value. Fitting the experimental data in these isotherm models and considering the higher values of correlation coefficients (R2 ∼ 1), it is concluded that the Langmuir isotherm model is the best model to explain the ARS dye and Al3+ ion adsorption over Ag-NPs–AC.
3.9. Comparison of this adsorbent and method with other literature
The comparative analysis of ARS dye and Al3+ ions adsorption capacity via different adsorbents given in Table 6 confirms the superiority of the present adsorbent with respect to other adsorbents in terms of adsorption capacity and adsorption rate. The contact time considered in this study is also reported in Table 6 and is compared with various methods for the removal of Al3+ ions and ARS. From the results, it can be concluded that ultrasound assisted removal is a potentially superior method for ARS dye and Al3+ ion removal.
Table 6 Comparison of the simultaneous removal of ARS dye and Al3+ by Ag-NPs–AC with other methods and adsorbents
|
Adsorbate |
Contact time (min) |
Adsorption capacity (mg g−1) |
References |
Ag-NPs–AC |
ARS |
140 s |
232.6 |
This work |
Ag-NPs–AC |
Al3+ |
140 s |
222.2 |
This work |
Au-NPs–AC |
ARS |
5 |
123.15 |
7 |
Active carbon |
ARS |
20 |
20 |
5 |
Magnetic chitosan |
ARS |
50 |
40.12 |
44 |
Fe3O4-NPs coated with polypyrrole |
ARS |
50 |
116.3 |
6 |
TiO2-NPs coated with CTAB |
ARS |
40 |
144.92 |
23 |
Multivalued carbon nanotubes |
ARS |
10 |
166.6 |
4 |
Lantana camara |
ARS |
80 |
1.165 |
45 |
Date-pit activated carbon |
Al3+ |
20 |
5.831 |
1 |
BDH activated carbon |
Al3+ |
20 |
6.562 |
1 |
Chemically treated African beech sawdust |
Al3+ |
150 |
0.854 |
3 |
Raw African beech sawdust |
Al3+ |
120 |
1.913 |
3 |
4. Conclusion
In this study, activated carbon engrafted with Ag nanoparticles was prepared and used as an adsorbent for the simultaneous removal of Al3+ and ARS from aqueous media while the adsorption rate was accelerated via ultrasound. The prepared adsorbent was characterized using FT-IR and SEM analysis. The influence of various experimental parameters on the Al3+ and ARS removal percentage was investigated by experimental design methodology. CCD combined with DF and GA methods was adopted and the parameters were optimized. Isotherm models such as Langmuir, Freundlich, and Temkin for the adsorption process were evaluated and the equilibrium data were best described by the Langmuir model. Compared to the recent state of work and their limitations, this adsorbent has shown very good applicability for Al3+ ions and ARS removal with high removal percentage (87.28% and 91.5%), high adsorption capacity (222.2 and 232.6 mg g−1) using a small amount of adsorbent (10 mg) in a short time (140 s) over mild conditions, respectively.
Acknowledgements
Authors are grateful for the financial support from the Research Council of the University of Yasouj.
References
- S. A. Al-Muhtaseb, M. H. El-Naas and S. Abdallah, J. Hazard. Mater., 2008, 158, 300–307 CrossRef CAS PubMed.
- Y. Tan, S. Ren, S. Shi, S. Wen, D. Jiang, W. Dong, M. Ji and S. Sun, Vacuum, 2014, 99, 272–276 CrossRef CAS PubMed.
- N. T. Abdel-Ghani, G. A. El-Chaghaby and F. S. Helal, Desalin. Water Treat., 2013, 51, 3558–3575 CrossRef CAS PubMed.
- M. Ghaedi, A. Hassanzadeh and S. N. Kokhdan, J. Chem. Eng. Data, 2011, 56, 2511–2520 CrossRef CAS.
- M. Ghaedi, A. Najibi, H. Hossainian, A. Shokrollahi and M. Soylak, Toxicol. Environ. Chem., 2012, 94, 40–48 CrossRef CAS PubMed.
- M. B. Gholivand, Y. Yamini, M. Dayeni, S. Seidi and E. Tahmasebi, J. Environ. Chem. Eng., 2015, 3, 529–540 CrossRef CAS PubMed.
- M. Roosta, M. Ghaedi and M. Mohammadi, Powder Technol., 2014, 267, 134–144 CrossRef CAS PubMed.
- S. Khattri and M. Singh, J. Hazard. Mater., 2009, 167, 1089–1094 CrossRef CAS PubMed.
- L. Ai, H. Huang, Z. Chen, X. Wei and J. Jiang, Chem. Eng. J., 2010, 156, 243–249 CrossRef CAS PubMed.
- M. Roosta, M. Ghaedi, N. Shokri, A. Daneshfar, R. Sahraei and A. Asghari, Spectrochim. Acta, Part A, 2014, 118, 55–65 CrossRef CAS PubMed.
- S. Meriç, D. Kaptan and T. Ölmez, Chemosphere, 2004, 54, 435–441 CrossRef PubMed.
- T. A. Khan, R. Rahman, I. Ali, E. A. Khan and A. A. Mukhlif, Toxicol. Environ. Chem., 2014, 96, 569–578 CrossRef CAS PubMed.
- I. D. Mall, V. C. Srivastava, N. K. Agarwal and I. M. Mishra, Colloids Surf., A, 2005, 264, 17–28 CrossRef CAS PubMed.
- J. Aguado, J. M. Arsuaga, A. Arencibia, M. Lindo and V. Gascón, J. Hazard. Mater., 2009, 163, 213–221 CrossRef CAS PubMed.
- J. M. Arsuaga, J. Aguado, A. Arencibia and M. S. López-Gutiérrez, Adsorption, 2014, 20, 311–319 CrossRef CAS.
- M. A. Ahmad, N. Ahmad and O. S. Bello, Water, Air, Soil Pollut., 2014, 225, 1–18 CrossRef CAS.
- C. Namasivayam and D. Kavitha, Dyes Pigm., 2002, 54, 47–58 CrossRef CAS.
- V. Gupta, B. Gupta, A. Rastogi, S. Agarwal and A. Nayak, Water Res., 2011, 45, 4047–4055 CrossRef CAS PubMed.
- M. Gonçalves, M. C. Guerreiro, L. C. A. de Oliveira and C. S. de Castro, J. Environ. Manage., 2013, 127, 206–211 CrossRef PubMed.
- M. Ghaedi, H. A. Larki, S. N. Kokhdan, F. Marahel, R. Sahraei, A. Daneshfar and M. Purkait, Environ. Prog. Sustainable Energy, 2013, 32, 535–542 CrossRef CAS PubMed.
- M. Roosta, M. Ghaedi, A. Daneshfar, R. Sahraei and A. Asghari, Ultrason. Sonochem., 2014, 21, 242–252 CrossRef CAS PubMed.
- M. Asadollahzadeh, H. Tavakoli, M. Torab-Mostaedi, G. Hosseini and A. Hemmati, Talanta, 2014, 123, 25–31 CrossRef CAS PubMed.
- J. Zolgharnein, M. Bagtash and N. Asanjarani, J. Environ. Chem. Eng., 2014, 2, 988–1000 CrossRef CAS PubMed.
- T.-H. Hou, C.-H. Su and W.-L. Liu, Powder Technol., 2007, 173, 153–162 CrossRef CAS PubMed.
- M. Ghaedi, N. Zeinali, A. Ghaedi, M. Teimuori and J. Tashkhourian, Spectrochim. Acta, Part A, 2014, 125, 264–277 CrossRef CAS PubMed.
- D. S. Correia and C. V. Gonçalves, J. Mater. Process. Technol., 2005, 160, 70–76 CrossRef PubMed.
- M. Khajeh and M. Gharan, J. Chemom., 2014, 28, 539–547 CrossRef CAS PubMed.
- T. Nazghelichi, M. Aghbashlo and M. H. Kianmehr, Comput. Electron. Agr., 2011, 75, 84–91 CrossRef PubMed.
- M. S. Bhatti, D. Kapoor, R. K. Kalia, A. S. Reddy and A. K. Thukral, Desalination, 2011, 274, 74–80 CrossRef CAS PubMed.
- P. Kouvaris, A. Delimitis, V. Zaspalis, D. Papadopoulos, S. A. Tsipas and N. Michailidis, Mater. Lett., 2012, 76, 18–20 CrossRef CAS PubMed.
- S. Ponarulselvam, C. Panneerselvam, K. Murugan, N. Aarthi, K. Kalimuthu and S. Thangamani, Asian Pac. J. Trop. Biomed., 2012, 2, 574–580 CrossRef CAS.
- Y. He, C. Ding, X. Wang, H. Wang and Y. Suo, J. Liq. Chromatogr. Relat. Technol., 2015, 38, 29–35 CrossRef CAS PubMed.
- C. Kütahyalı, Ş. Sert, B. Çetinkaya, E. Yalçıntaş and M. B. Acar, Wood Sci. Technol., 2012, 46, 721–736 CrossRef PubMed.
- K. Yetilmezsoy and S. A. Abdul-Wahab, Desalination, 2014, 344, 171–180 CrossRef CAS PubMed.
- S. Khodadoust and M. Hadjmohammadi, Anal. Chim. Acta, 2011, 699, 113–119 CrossRef CAS PubMed.
- M. Ghaedi, A. Ghaedi, F. Abdi, M. Roosta, A. Vafaei and A. Asghari, Ecotoxicol. Environ. Saf., 2013, 96, 110–117 CrossRef CAS PubMed.
- H. Kurtaran and T. Erzurumlu, Int. J. Adv. Manuf. Tech., 2006, 27, 468–472 CrossRef PubMed.
- T. J. Shankar, S. Sokhansanj, S. Bandyopadhyay and A. Bawa, Food Bioprocess Technol., 2010, 3, 498–510 CrossRef.
- A. Goudarzi, A. D. Namghi and C.-S. Ha, RSC Adv., 2014, 4, 59764–59771 RSC.
- M. Ghaedi, B. Sadeghian, A. A. Pebdani, R. Sahraei, A. Daneshfar and C. Duran, Chem. Eng. J., 2012, 187, 133–141 CrossRef CAS PubMed.
- M. Toor and B. Jin, Chem. Eng. J., 2012, 187, 79–88 CrossRef CAS PubMed.
- Y.-S. Ho, Pol. J. Environ. Stud., 2006, 15, 81–86 CAS.
- G. P. Jeppu and T. P. Clement, J. Contam. Hydrol., 2012, 129, 46–53 CrossRef PubMed.
- L. Fan, Y. Zhang, X. Li, C. Luo, F. Lu and H. Qiu, Colloids Surf., B, 2012, 91, 250–257 CrossRef CAS PubMed.
- R. K. Gautam, P. K. Gautam, M. Chattopadhyaya and J. Pandey, Proc. Natl. Acad. Sci., India, Sect. A, 2014, 84, 495–504 CrossRef CAS.
|
This journal is © The Royal Society of Chemistry 2015 |
Click here to see how this site uses Cookies. View our privacy policy here.