Energy transfer and color tuning in the Ba9Sc2Si6O24:Ce3+,Eu2+,Mn2+ phosphor
Abstract
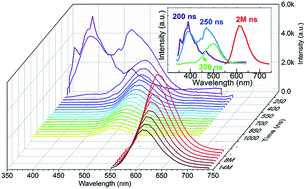
A series of single phase Ba9−x−ySc2−zSi6O24:xCe,yEu,zMn phosphors was synthesized by high-temperature solid-state reactions. The luminescent properties of single-doped, co-doped and tri-doped Ce3+/Eu2+/Mn2+ in the host Ba9Sc2Si6O24 were studied on the basis of the photoluminescence excitation/emission spectra, photoluminescence decay behaviors and time resolved emission spectra. Two types of luminescent centers of Eu(1)/Eu(2,3) as well as Ce(1)/Ce(2,3) occupying different crystallography sites were confirmed, and the sensitizing effects of Ce3+ → Eu2+, Ce2+ → Mn2+ and Eu2+ → Mn2+ were clearly observed. In the tri-doped samples, Eu2+ competed with Mn2+ for the energy transferred from Ce3+ and also transferred its observed energy to Mn2+. Furthermore, the tri-doped Ba9Sc2Si6O24 phosphors emitting white light with various correlated color temperatures were obtained by adjusting the relative content of Ce3+, Eu2+ and Mn2+.
 Please wait while we load your content...

