Effect of pre-imidization on the structures and properties of polyimide fibers
Jingjing Changa,
Qiyan Gea,
Mengying Zhanga,
Weiwei Liua,
Li Caoa,
Hongqing Niu*b,
Gang Suib and
Dezhen Wu*a
aState Key Laboratory of Chemical Resource Engineering, College of Materials Science and Engineering, Beijing University of Chemical Technology, Beijing 100029, China. E-mail: wdz@mail.buct.edu.cn; Fax: +86 10 6442 1693; Tel: +86 10 6442 1693
bKey Laboratory of Carbon Fiber and Functional Polymers, Ministry of Education, Beijing University of Chemical Technology, Beijing 100029, China. E-mail: niuhq@mail.buct.edu.cn; Fax: +86 10 6442 4654; Tel: +86 10 6442 4654
First published on 10th August 2015
Abstract
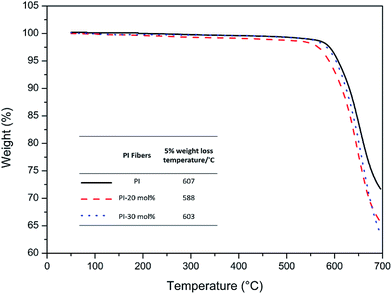
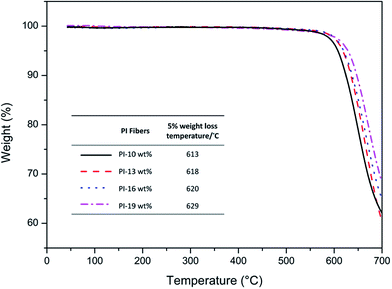
A series of polyimide (PI) fibers derived from 3,3′,4,4′-biphenyltetracarboxylic dianhydride (BPDA), 4,4′-oxydiphthalic anhydride (ODPA) and p-phenylenediamine (p-PDA) were successfully prepared through a partially pre-imidization process, and the effects of different amount of dehydration reagents and initial poly(amic acid) (PAA) concentrations on the structure–property relationship of the resultant PI fibers were systematically investigated. The results showed that both the increased amount of dehydration reagents and PAA concentration could result in the ordered molecular packing arrangement of the polymer chains and gradually formed homogeneous structures in the fibers, which are proposed to be essentially dominated for the effectively enhancement in the mechanical properties of PI fibers. Moreover, the PI fibers obtained through the pre-imidization process still exhibited excellent thermal-oxidative stabilities, although the 5% weight loss temperature of the PI fibers was slightly decreased compared with that of the pure PI fibers as a result of the residual dehydration reagents in the fibers. Consequently, the present work provided a new approach in preparing high-performance PI fibers through a partially pre-imidization process.
1 Introduction
As one of the most promising materials in the class of high-performance polymeric fibers, aromatic polyimide (PI) fibers have drawn much attention due to the excellent mechanical properties, outstanding thermal-oxidative stabilities, superior chemical and irradiation resistance as well as good dielectric performances.1–4 In this regard, they have been extensively applied into widespread areas such as microelectronics, engineering and aerospace industry.5–8 Although the development of high-performance PI fibers have made significant progresses in the past decades, the properties of the resultant PI fibers are still in need of further improvement when employed in severer circumstances or being the substitution for the other products.9,10 Therefore, lots of research works were carried out with the aim of obtaining PI fibers with outstanding performances.Recently, a typical two-step method is mainly adopted in preparing PI fibers, in which poly(amic acid) (PAA) fibers are obtained by extruding PAA solution into coagulation bath and subsequently converted into corresponding PI fibers through thermal or chemical imidization process.11,12 Taking advantage of the extensive amount of monomers to be copolymerized, much efforts have been paid to incorporate the monomers with specific groups into the polymer backbone in order to combine the advantages of individual group.13–15 For example, Niu et al. have introduced the monomer 2-(4-aminophenyl)-6-amino-4(3H)-quinazolinone (AAQ) into the 3,3′,4,4′-biphenyltetracarboxylic dianhydride (BPDA)/p-phenylenediamine (p-PDA) backbone to obtain the PI fibers with the tensile strength and initial modulus up to 2.8 and 115.2 GPa, respectively.10 The incorporation of rigid-rod heterocyclic units containing both –NH– and ![[double bond, length as m-dash]](https://www.rsc.org/images/entities/char_e001.gif) N– has enhanced the intermolecular associations, which was proposed to affect the mechanical properties of PI fibers. However, as for two-step wet-spinning method, some defects such as microvoids could be generated during dual-diffusion and thermal imidization process.16–19 It was reported that the incorporated 4,4′-oxydiphthalic anhydride (ODPA) moieties into the BPDA/p-PDA polymer backbone resulted in the reduced size of the microvoids in the fibers, which was the main reason for the dramatically enhancement in the mechanical properties of the fibers.20 Therefore, controlling the size of microvoids is especially essential in determining the final performance of the PI fibers. Moreover, it is found that the problem could be solved if the PAA solutions are pre-imidized before spinning into as-spun PAA fibers and consequently, the presence of the removal of micromolecules will be reduced during thermal imidization process. On the other hand, on the basis of the works related to pre-imidization of PI films, it can be speculated that the pre-imidized rigid PI units will proceed molecular ordering with external drawing to form regular molecular arrangement, resulting in the enhancement in the properties of PI fibers.21–23 In summary, the previous works were mainly focused on changing the chemical structures of PI fibers to modify the chemical structure of the PI fibers, while the reports related to the effect of pre-imidization of PAA solutions on the final performances of the PI fibers have been involved little.
N– has enhanced the intermolecular associations, which was proposed to affect the mechanical properties of PI fibers. However, as for two-step wet-spinning method, some defects such as microvoids could be generated during dual-diffusion and thermal imidization process.16–19 It was reported that the incorporated 4,4′-oxydiphthalic anhydride (ODPA) moieties into the BPDA/p-PDA polymer backbone resulted in the reduced size of the microvoids in the fibers, which was the main reason for the dramatically enhancement in the mechanical properties of the fibers.20 Therefore, controlling the size of microvoids is especially essential in determining the final performance of the PI fibers. Moreover, it is found that the problem could be solved if the PAA solutions are pre-imidized before spinning into as-spun PAA fibers and consequently, the presence of the removal of micromolecules will be reduced during thermal imidization process. On the other hand, on the basis of the works related to pre-imidization of PI films, it can be speculated that the pre-imidized rigid PI units will proceed molecular ordering with external drawing to form regular molecular arrangement, resulting in the enhancement in the properties of PI fibers.21–23 In summary, the previous works were mainly focused on changing the chemical structures of PI fibers to modify the chemical structure of the PI fibers, while the reports related to the effect of pre-imidization of PAA solutions on the final performances of the PI fibers have been involved little.
In the present work, we proposed an approach in preparing BPDA/ODPA/p-PDA copolyimide fibers via a two-step wet-spinning method, that was, the partially pre-imidization process of PAA solutions by a chemical imidization method. The PAA solutions were partially pre-imidized by the introduction of dehydration reagents (the mixture of acetic anhydride and pyridine) to obtain PAA-PI precursors. After spinning into PAA-PI fibers, the fibers were converted into corresponding PI fibers through thermal imidization process. Herein, the effects of different amount of dehydration reagents and different PAA concentrations on the structures and properties of the final PI fibers are systematically investigated.
2 Experimental
2.1 Materials
The monomers BPDA and ODPA were supplied by Shi Jiazhuang Hai Li Chemical Company, and purified by sublimation prior to use. The monomer p-PDA was obtained from Shangyu Li Xing Chemical Company and purified by recrystallization. The reagents dimethylacetamide (DMAc), acetic anhydride and pyridine (analytical pure) were purchased from Tianjin Fu Chen Chemicals Reagent Factory and used without further treatment. The deionized water used in the experiment was prepared by the Laboratory Water Purification System.2.2 Preparation of PAA-PI solutions with different amount of dehydration reagents
In a three-necked flask equipped with a mechanical stirrer, the mixture of the dianhydrides BPDA and ODPA were added in several portions to a solution of p-PDA in DMAc solvent at room temperature (the molar ratio of BPDA/ODPA/p-PDA is 7/3/10). After stirring for 5 h, the viscous spinning solution containing 12 wt% solid content was obtained. The PAA solution was divided equally into three portions, and then different amount (0, 20 and 30 mol% relative to the original amino groups) of dehydration reagents were added into the PAA solutions. The reaction mixtures were stirred for 3 h at room temperature to yield homogeneous PAA-PI solutions with different imidization degrees (IDs).2.3 Preparation of PAA-PI solutions with different PAA concentrations
Using the same procedure as described above, the PAA solution derived from BPDA, ODPA and p-PDA (the molar ratio of BPDA/ODPA/p-PDA is 7/3/10) with initial concentration of 20 wt% was obtained. Then the PAA solution was diluted to different concentrations (10, 13, 16 and 19 wt%) before use. Another 1 h later with stirring, 20 mol% dehydration reagents were added into the PAA solutions. Accordingly, the reaction mixtures were stirred for 3 h at room temperature to yield partially imidized PAA-PI solutions with different PAA concentrations.2.4 Preparation of PI fibers
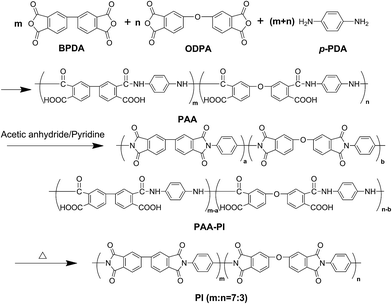
The PI fibers were prepared by the two-step wet-spinning method according to the following procedures. The PAA solution, filtrated and degassed prior to use, was extruded into the coagulation bath through a spinneret (120 holes, 70 μm in diameter) to get as-spun PAA fibers under the pressure of nitrogen. After washed by deionized water to remove the residual solvents in the fibers, the PAA fibers were dried with the oven at the temperature of 80 °C, and then were delivered into ovens with the temperatures ranging from 280 to 500 °C with concomitant drawing on the spinning rollers. The mechanical properties of PI fibers were improved extensively through the thermal imidization process. The synthetic route is illustrated in Scheme 1.The synthesized PI(PAA) fibers with different amount of dehydration reagents of 0, 20 and 30 mol% were abbreviated as PI(PAA), PI(PAA)-20 mol% and PI(PAA)-30 mol%, respectively. The PI(PAA) fibers with different concentration of 10, 13, 16 and 19 wt% were abbreviated as PI(PAA)-10 wt%, PI(PAA)-13 wt%, PI(PAA)-16 wt% and PI(PAA)-19 wt%, respectively.
2.5 Characterization
The Fourier transform infrared (FT-IR) measurements were carried out on Nexus 670 made by Nicolet Company with the scanning wavenumber ranging from 4000 to 400 cm−1 and average 32 scans. The samples were prepared by grinding the fibers with KBr in the mortar, and the measurements were conducted in the ambient atmosphere. Generally, the band at 1364 cm−1 (C–N–C stretching) is selected for quantifying the ID of the fibers, and the aromatic band at 1510 cm−1 (C–C stretching of the p-substituted benzene backbone) is selected as the internal standard. Thus, the ID can be calculated using the equation:
 | (1) |
The intrinsic viscosities of the PAA solutions were measured using a Germany SCHOTT 52510 Ubbelohde viscometer at 35 °C.
The mechanical properties of PI fibers were conducted on the Instron 3344 instrument with a gauge length and extension speed of 250 mm and 125 mm min−1, respectively. For each group of fibers, at least 15 filaments were tested and the average value was used as the representative.
Wide angle X-ray diffraction (WAXD) was performed using a Bruker AXS D8 ADVANCE X-ray diffractometer (Karlsruhe, Germany) in the 5–40° at a scanning rate of 10° min−1. X-ray diffraction measurements were taken at room temperature using Ni-filtered Cu Kα (λ = 0.154 nm) radiation operated at 40 kV and 40 mA. The order degree X of macromolecule can be confirmed by the equation:
 | (2) |
 | (3) |
Two-dimensional small angle X-ray scattering (2D SAXS) was performed on NanoSTAR-U (BRUKER AXS INC) using an HI-STAR detector. The generator was operated at 40 kV and 650 μA with Cu Kα radiation. The distance between the sample and the detector was LSD = 1074 mm. The effective scattering vector q (q = 4π![[thin space (1/6-em)]](https://www.rsc.org/images/entities/char_2009.gif) sin
sin![[thin space (1/6-em)]](https://www.rsc.org/images/entities/char_2009.gif) θ/λ, where 2θ is the scattering angle) at this distance ranging from 0.044 to 2.0 nm−1.
θ/λ, where 2θ is the scattering angle) at this distance ranging from 0.044 to 2.0 nm−1.
As for wet-spinning process, the needle-shaped microvoids along the fiber axial direction were characterized by SAXS. The radius of the microvoids can be described by Guinier functions as follows:
 | (4) |
| R = ∑RiWi (i = 1, 2, 3…) | (5) |
 | (6) |
![[thin space (1/6-em)]](https://www.rsc.org/images/entities/char_2009.gif) sin
sin![[thin space (1/6-em)]](https://www.rsc.org/images/entities/char_2009.gif) θ/λ).
θ/λ).
Thermo gravimetric analysis (TGA) was performed with a TGA Q50 instrument at a heating rate of 10 °C min−1 from 50 to 700 °C. The samples weighing about 5.0 mg were tested in nitrogen.
3 Results and discussion
3.1 Effect of different amount of dehydration reagents on the structures and properties of polyimide fibers
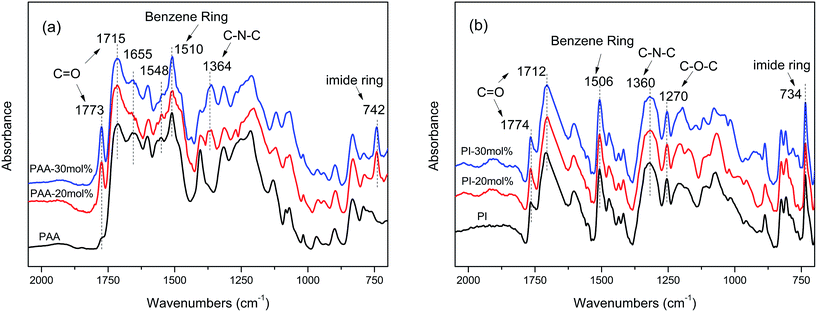
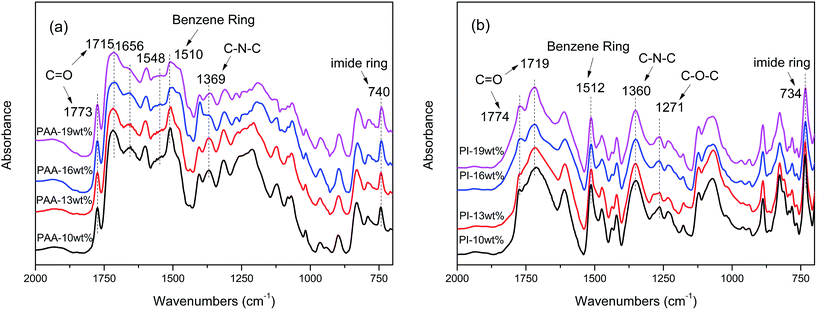
![[double bond, length as m-dash]](https://www.rsc.org/images/entities/char_e001.gif) O asymmetrical stretching, 1715 cm−1 for C
O asymmetrical stretching, 1715 cm−1 for C![[double bond, length as m-dash]](https://www.rsc.org/images/entities/char_e001.gif) O symmetrical stretching, 1364 cm−1 for C–N stretching and 734 cm−1 for C
O symmetrical stretching, 1364 cm−1 for C–N stretching and 734 cm−1 for C![[double bond, length as m-dash]](https://www.rsc.org/images/entities/char_e001.gif) O bending of imide ring) increases obviously, indicating that the PAA fibers were pre-imidized.28 Moreover, the characteristic absorption band of isoimide groups at 1800 cm−1 is not detected in the spectra, suggesting that the main product prepared in the present work is PAA-PI precursor, and the isoimide could be ignored.21 As for PI fibers presented in Fig. 1(b), all the fibers exhibit the same absorption bands, indicating the same chemical structures of final PI fibers.
O bending of imide ring) increases obviously, indicating that the PAA fibers were pre-imidized.28 Moreover, the characteristic absorption band of isoimide groups at 1800 cm−1 is not detected in the spectra, suggesting that the main product prepared in the present work is PAA-PI precursor, and the isoimide could be ignored.21 As for PI fibers presented in Fig. 1(b), all the fibers exhibit the same absorption bands, indicating the same chemical structures of final PI fibers.
Based on the equation given in eqn (1), the IDs of the PAA and final PI fibers were calculated as summarized in Table 1. The experimental IDs of PAA fibers are close to the theoretical ones, suggesting that the IDs could be controlled by adding appropriate amount of dehydration reagents, which is favorable to obtain partially imidized PAA fibers. For PI fibers, the resulting PI fibers exhibit high imidization degrees which are all almost 100%, promising the prepared PI fibers with excellent mechanical performances.
| Type of PAA solution | ID of PAA fibers (%) | ID of PI fibers (%) | Intrinsic viscosity (dL g−1) | Linear densitya (dtex) | Mechanical properties of the PI fibers | ||
|---|---|---|---|---|---|---|---|
| Tensile strength (GPa) | Initial modulus (GPa) | Elongation (%) | |||||
a Linear density: the weight of a bundle of fibers with the length of 10![[thin space (1/6-em)]](https://www.rsc.org/images/entities/char_2009.gif) 000 m. 000 m. |
|||||||
| PAA | 0 | 100 | 2.86 | 176.0 | 1.39 ± 0.08 | 90.5 ± 1.2 | 1.64 ± 0.11 |
| PAA+20 mol% dehydration reagents | 18.5 | 97.8 | 1.91 | 125.0 | 1.57 ± 0.13 | 101.9 ± 2.7 | 1.60 ± 0.15 |
| PAA+30 mol% dehydration reagents | 25.3 | 98.4 | 2.04 | 165.0 | 1.61 ± 0.06 | 106.2 ± 2.2 | 1.55 ± 0.05 |
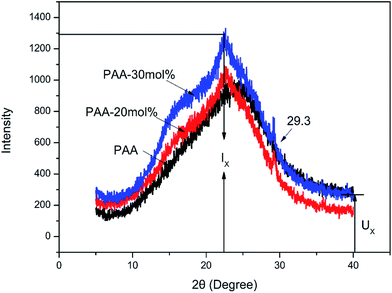
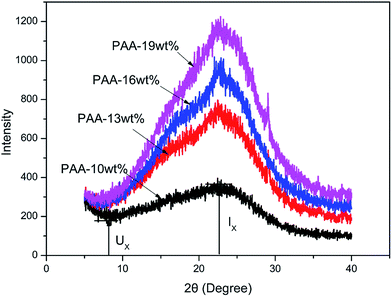
For PI fibers, substantial changes are also observed as shown in Fig. 3. All the PI fibers exhibit strong diffraction peaks in the range of 5–40°, indicating the different crystallization behavior through thermal imidization process. To further examine and interpret the crystallization behavior, the curve-fitting deconvolution of WAXD profiles was performed to separate the crystallization and amorphous contributions. Followed by the eqn (3), the crystallinity of all the samples was determined to be 35.7, 37.2 and 42.0% for PI, PI-20 mol% and PI-30 mol% fibers, respectively. It can be explained as that with the increased amount of dehydration reagents, more rigid PI chains are generated in the PAA-PI precursors, which gradually limit the mobility of the polymer chains. Meanwhile, the pre-imidized PI chains will be preserved to induce the formation of more oriented structures with the contribution of thermal imidization process. Consequently, the suppressed mobility of the polymer chains and initially oriented structures together are responsible for the ordered molecular packing structures in the fibers. Hence the PI fibers prepared with the pre-imidization process have better molecular arrangement, which is helpful to improve the mechanical properties of PI fibers.
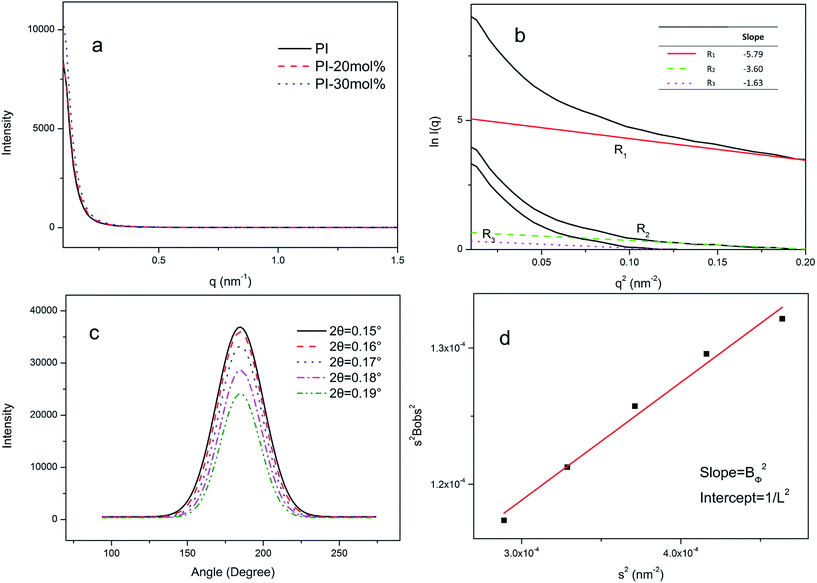
Moreover, it is well known that the microvoids generated in a typical two-step wet-spinning method will greatly affect the final performances of the PI fibers. Therefore, with the purpose of obtaining high-performance PI fibers, the pre-imidization process was adopted to diminish the unexpected phenomenon and the structural evolution in the fibers was investigated by SAXS. Also, the parameters of microvoids such as average radius R, length L and misorientation BΦ could be evaluated. From the 2D SAXS patterns of the PI fibers with different amount of dehydration reagents in Fig. 5, it can be observed that all the fibers exhibit sharp and elongated scattering streaks, demonstrating the presence of microvoids in the fibers. Meanwhile, the needle-shaped microvoids are distributed approximately parallel to the fiber axis.20,29
 | ||
| Fig. 5 2D SAXS patterns of the PI fibers with different amount of dehydration reagents. (a) PI; (b) PI-20 mol%; (c) PI-30 mol%. | ||
The SAXS profiles of the PI fibers with different amount of dehydration reagents are shown in Fig. 6(a). The strong scattering near the beamstop indicates the existence of nanoscale structures in the fibers. As reported by Jiang et al., the radius of the microvoids can be determined by Guinier function as shown in eqn (4).30,31 The radius Ri (i = 1,2,3) and corresponding volume percentage Wi (i = 1,2,3) to different size of microvoids can be confirmed by Fankuchen successive tangent method.32 Accordingly, the average radius R of microvoids can be calculated according to eqn (5), and the results are listed in Table 2. The Guinier plot of the scattered intensities of PI-20 mol% fibers along the meridian direction by Fankuchen successive tangent method is also displayed in Fig. 6(b). Besides, it can be noted the scattering intensity of the microvoids decreases as a function of scattering angles, implying that the length of microvoids is not constant, that is, both the size distribution and misorientation of microvoids have contributed to the streak profiles.33 The average fibril length L and misorientation BΦ could be calculated by eqn (6) proposed by Ruland, while the length L is obtained from the intercept of the s2Bobs2 vs. s2 plot and misorientation BΦ from the slope of the plot.34,35 The intensity profiles corresponding to azimuthal scans at different scattering vectors and Ruland plot of the PI-20 mol% fibers are shown in Fig. 6(c) and (d), respectively. From the results in Table 2, there is no doubt that the addition of dehydration reagents leads to the reduced radius, length and misorientation of microvoids in the fibers, since some pre-imidized PI units are obtained before wet-spinning process. As a result, the gradually formed homogeneous structures promote the enhancement in the mechanical properties of PI fibers.
| PI fibers | Ri | R (nm) | L (nm) | BΦ (°) | |||||
|---|---|---|---|---|---|---|---|---|---|
| R1 (nm) | W1 | R2 (nm) | W2 | R3 (nm) | W3 | ||||
| PI | 1.84 | 1.00 | 1.80 | 0.19 | 1.33 | 0.15 | 2.38 | 104.52 | 17.79 |
| PI-20 mol% | 1.63 | 1.00 | 2.06 | 0.12 | 1.09 | 0.15 | 2.03 | 103.75 | 17.03 |
| PI-30 mol% | 0.95 | 1.00 | 2.37 | 0.02 | 0.90 | 0.07 | 1.06 | 103.42 | 16.85 |
3.2 Effect of different PAA concentrations on the structures and properties of polyimide fibers
![[double bond, length as m-dash]](https://www.rsc.org/images/entities/char_e001.gif) O asymmetrical stretching, C
O asymmetrical stretching, C![[double bond, length as m-dash]](https://www.rsc.org/images/entities/char_e001.gif) O symmetrical stretching, C–N stretching and C
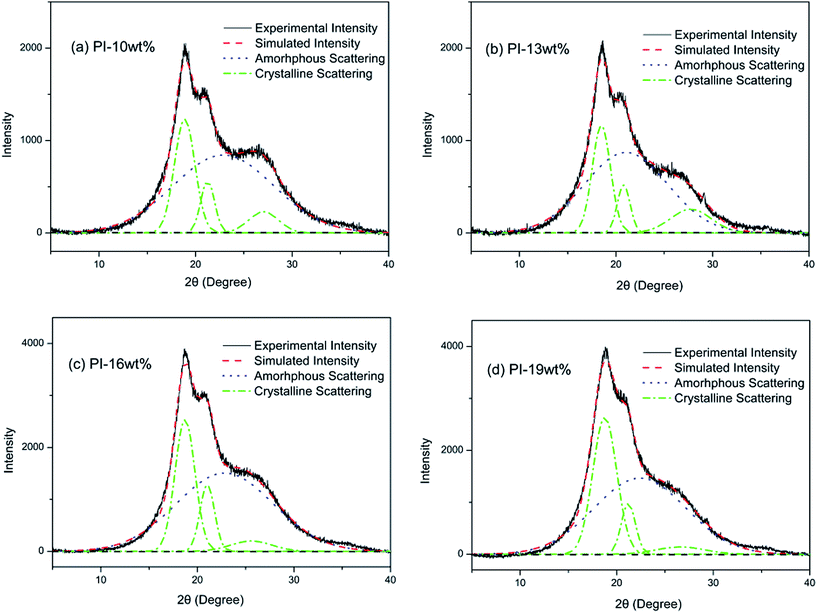
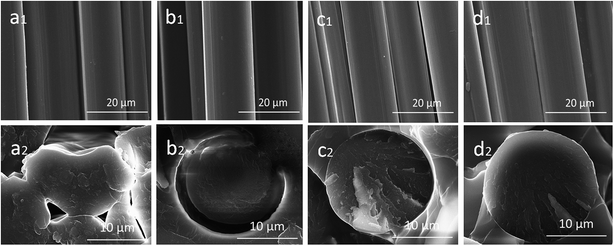
O symmetrical stretching, C–N stretching and C![[double bond, length as m-dash]](https://www.rsc.org/images/entities/char_e001.gif) O bending of imide ring, respectively. For PI fibers displayed in Fig. 8(b), the fibers exhibit same absorption bands, indicating that the PI fibers derived from different concentrations of PAA solutions possess the same chemical structures. Additionally, it should be noted that high PAA concentration will accelerate the pre-imidization process, and therefore, the IDs of the PAA and PI fibers should be evaluated. Based on eqn (1), the IDs were calculated as summarized in Table 3. The PAA fibers prepared with high PAA concentration exhibit relatively high ID, indicating that high concentration facilitates the pre-imidization process, which is in well accordance with our expectations. Meanwhile, the ID of PI fibers also increases with the increased PAA concentrations, which is beneficial to improve the mechanical performances of the resulting PI fibers.
O bending of imide ring, respectively. For PI fibers displayed in Fig. 8(b), the fibers exhibit same absorption bands, indicating that the PI fibers derived from different concentrations of PAA solutions possess the same chemical structures. Additionally, it should be noted that high PAA concentration will accelerate the pre-imidization process, and therefore, the IDs of the PAA and PI fibers should be evaluated. Based on eqn (1), the IDs were calculated as summarized in Table 3. The PAA fibers prepared with high PAA concentration exhibit relatively high ID, indicating that high concentration facilitates the pre-imidization process, which is in well accordance with our expectations. Meanwhile, the ID of PI fibers also increases with the increased PAA concentrations, which is beneficial to improve the mechanical performances of the resulting PI fibers.
| PAA concentration (wt%) | ID of PAA fibers (%) | ID of PI fibers (%) | Intrinsic viscosity (dL g−1) | Linear density (dtex) | Mechanical properties of the PI fibers | ||
|---|---|---|---|---|---|---|---|
| Tensile strength (GPa) | Initial modulus (GPa) | Elongation (%) | |||||
| 10 | 12.8 | 92.5 | 1.10 | 241.0 | 0.72 ± 0.05 | 42.2 ± 2.6 | 1.89 ± 0.12 |
| 13 | 14.3 | 96.2 | 1.21 | 259.5 | 1.04 ± 0.03 | 63.7 ± 1.9 | 1.72 ± 0.05 |
| 16 | 16.8 | 97.4 | 1.51 | 271.0 | 1.15 ± 0.01 | 89.6 ± 1.9 | 1.40 ± 0.07 |
| 19 | 18.2 | 100 | 1.57 | 289.5 | 1.21 ± 0.04 | 99.9 ± 1.7 | 1.25 ± 0.01 |
The 2D SAXS patterns of PI fibers with different PAA concentrations are obtained in Fig. 12. The intense scattering along the meridian directions is mainly attributed to the existence of microvoids in the fibers, since there is no detectable microfibrillar scattering in the SAXS patterns.33 Moreover, substantial changes have occurred on the parameters of microvoids such as average radius R, length L and misorientation BΦ with different PAA concentrations, which are of great significance to the mechanical properties of PI fibers.
 | ||
| Fig. 12 2D SAXS patterns of the PI fibers with different PAA concentrations. (a) PI-10 wt%; (b) PI-13 wt%; (c) PI-16 wt%; (d) PI-19 wt%. | ||
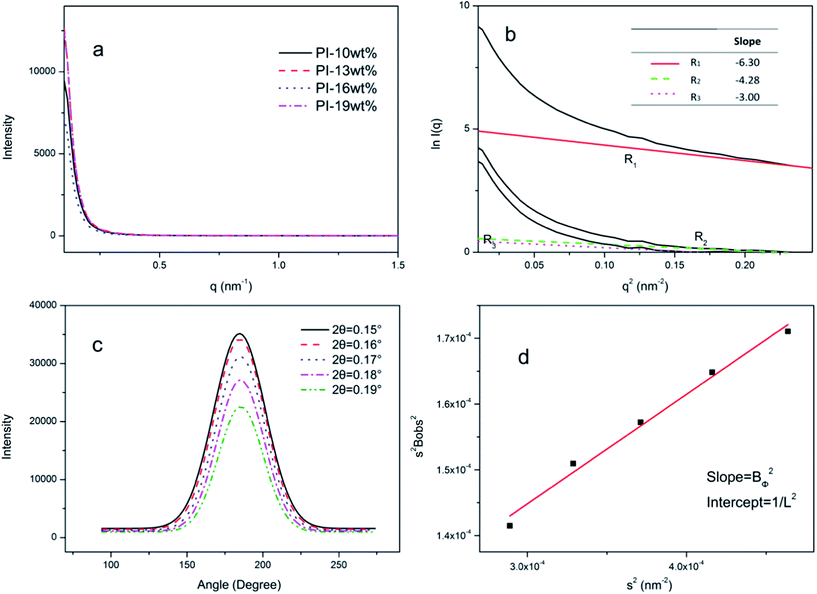
The strong scattering of the PI fibers with different PAA concentrations, as depicted in Fig. 13(a), giving evidence of the presence of microvoids with nanoscale structures. In the same manner, the radius of the microvoids can be calculated followed by the Guinier functions, and the Guinier plot of PI-10 wt% fibers is presented in Fig. 13(b) as the representative. Also, the length and misorientation of the microvoids are determined according to Ruland, and the corresponding plots of PI-10 wt% fibers are shown in Fig. 13(c) and (d). From the results listed in Table 4, the size of the microvoids is evidently decreased with the increased PAA concentrations, and the smallest volume of microvoids is obtained for PI-19 wt% fibers. The varied size of the microvoids is ascribed to the difference in dual-diffusion process. During the process, the solvent diffuses into the coagulation bath and the coagulant diffuses into the fibers. Nevertheless, the fibers prepared with low PAA concentration contain too much solvent, which facilitates the mass transfer process and therefore, resulting in large size of microvoids in the fibers. Above all, with the increased PAA concentration, the homogeneous structures are gradually formed, which should be responsible for the improved mechanical properties of PI fibers.
| PI fibers | Ri | R (nm) | L (nm) | BΦ (°) | |||||
|---|---|---|---|---|---|---|---|---|---|
| R1 (nm) | W1 | R2 (nm) | W2 | R3 (nm) | W3 | ||||
| PI-10 wt% | 2.15 | 1.00 | 1.48 | 0.29 | 1.77 | 0.12 | 2.81 | 110.77 | 23.39 |
| PI-13 wt% | 2.09 | 1.00 | 1.59 | 0.22 | 0.92 | 0.30 | 2.71 | 105.47 | 19.41 |
| PI-16 wt% | 2.12 | 1.00 | 1.66 | 0.24 | 1.53 | 0.10 | 2.67 | 102.71 | 19.19 |
| PI-19 wt% | 2.04 | 1.00 | 1.40 | 0.27 | 1.25 | 0.19 | 2.66 | 102.54 | 18.04 |
4 Conclusion
A series of PI fibers were prepared from the combination of BPDA, ODPA and p-PDA via the pre-imidization process and a typical two-step wet-spinning method. Both the different amount of dehydration reagents and PAA concentrations were adopted to examine the structures and properties of the final PI fibers. The results showed that both the increased amount of dehydration reagents and PAA concentrations led to the effectively enhancement in the mechanical properties of PI fibers. The PI fibers prepared with 30 mol% dehydration reagents exhibited the tensile strength of 1.61 GPa and initial modulus of 106.2 GPa, while the fibers obtained with 19 wt% PAA concentration possessed the tensile strength of 1.21 GPa and initial modulus of 99.9 GPa. Similarly, the pre-imidization process resulted in the ordered molecular arrangement of the polymer chains and gradually formed homogeneous structures in the fibers, which were deduced to be the main reasons for the improved mechanical properties of PI fibers. On the other hand, the fibers prepared with the pre-imidization process possessed excellent thermal stabilities, although the 5% weight loss temperature was slightly reduced as compared with that of the pure PI fibers as a result of the residual dehydration reagents in the fibers. In conclusion, the present work provided a new approach in obtaining high-performance PI fibers through the pre-imidization process.Acknowledgements
The authors greatly thank the financial support from the National Natural Science Foundation of China (NSFC, Project No. 51373008), National Key Basic Research Program of China (973 Program, No. 2014CB643606), Higher School Specialized Research Fund for Doctoral Priority Areas of Development Project (No. 20130010130001) and Fundamental Research Funds for the Central Universities of China (Project No. ZY1408).Notes and references
- W. E. Dorogy and A. K. St Clair, J. Appl. Polym. Sci., 1991, 43, 501–519 CrossRef CAS PubMed.
- W. E. Dorogy and A. K. S. Clair, J. Appl. Polym. Sci., 1993, 49, 501–510 CrossRef PubMed.
- M. Hasegawa and K. Horie, Prog. Polym. Sci., 2001, 26, 259–335 CrossRef CAS.
- R. Dine-Hart and W. Wright, J. Appl. Polym. Sci., 1967, 11, 609–627 CrossRef CAS PubMed.
- M. Ding, 21st Century SP's Series in Chemistry, 2006, pp. 571–588 Search PubMed.
- M. Bessonov, Polyimides–thermally stable polymers, Consultants Bureau, 1987 Search PubMed.
- D. Wilson, H. Stenzenberger and P. Hergenrother, Polyimides, Glasgow and London, 1990 Search PubMed.
- M. Ghosh, Polyimides: fundamentals and applications, CRC Press, 1996 Search PubMed.
- H. Niu, S. Qi, E. Han, G. Tian, X. Wang and D. Wu, Mater. Lett., 2012, 89, 63–65 CrossRef CAS PubMed.
- H. Niu, M. Huang, S. Qi, E. Han, G. Tian, X. Wang and D. Wu, Polymer, 2013, 54, 1700–1708 CrossRef CAS PubMed.
- S. Z. Cheng, Z. Wu and E. Mark, Polymer, 1991, 32, 1803–1810 CrossRef CAS.
- M. Eashoo, D. Shen, Z. Wu, C. J. Lee, F. W. Harris and S. Z. Cheng, Polymer, 1993, 34, 3209–3215 CrossRef CAS.
- J. Dong, C. Yin, Z. Zhang, X. Wang, H. Li and Q. Zhang, Macromol. Mater. Eng., 2014, 299, 1170–1179 CrossRef CAS PubMed.
- S. Huang, Z. Jiang, X. Ma, X. Qiu, Y. Men, L. Gao and M. Ding, Plast., Rubber Compos., 2013, 42, 407–415 CrossRef CAS PubMed.
- C. Yin, J. Dong, Z. Zhang, Q. Zhang and J. Lin, J. Polym. Sci., Part B: Polym. Phys., 2015, 53, 183–191 CrossRef CAS PubMed.
- J. Dong, C. Yin, J. Lin, D. Zhang and Q. Zhang, RSC Adv., 2014, 4, 44666–44673 RSC.
- L. Luo, J. Yao, X. Wang, K. Li, J. Huang, B. Li, H. Wang and X. Liu, Polymer, 2014, 55, 4258–4269 CrossRef CAS PubMed.
- T. Kaneda, T. Katsura, K. Nakagawa, H. Makino and M. Horio, J. Appl. Polym. Sci., 1986, 32, 3133–3149 CrossRef CAS PubMed.
- T. Kaneda, T. Katsura, K. Nakagawa, H. Makino and M. Horio, J. Appl. Polym. Sci., 1986, 32, 3151–3176 CrossRef CAS PubMed.
- J. Chang, H. Niu, M. Zhang, Q. Ge, Y. Li and D. Wu, J. Mater. Sci., 2015, 50, 4104–4114 CrossRef CAS.
- Y. Wang, Y. Yang, Z. Jia, J. Qin and Y. Gu, Polymer, 2012, 53, 4157–4163 CrossRef CAS PubMed.
- V. Smirnova, I. Gofman, V. Lavrent'Ev and V. Sklizkova, Polym. Sci., Ser. A, 2007, 49, 1114–1119 CrossRef.
- Y. Zhai, Q. Yang, R. Zhu and Y. Gu, J. Mater. Sci., 2008, 43, 338–344 CrossRef CAS.
- M. Marek, P. Schmidt, B. Schneider, B. Bednář and J. Králíček, Macromol. Chem., 1990, 191, 2631–2637 CrossRef CAS PubMed.
- Y. Zhuang, X. Liu and Y. Gu, Polym. Chem., 2012, 3, 1517–1525 RSC.
- X. Liu, G. Gao, L. Dong, G. Ye and Y. Gu, Polym. Adv. Technol., 2009, 20, 362–366 CrossRef CAS PubMed.
- R. Sengupta, V. Tikku, A. K. Somani, T. K. Chaki and A. K. Bhowmick, Radiat. Phys. Chem., 2005, 72, 625–633 CrossRef CAS PubMed.
- R. Snyder, B. Thomson, B. Bartges, D. Czerniawski and P. Painter, Macromolecules, 1989, 22, 4166–4172 CrossRef CAS.
- X. Chen, C. Burger, F. Wan, J. Zhang, L. Rong, B. S. Hsiao, B. Chu, J. Cai and L. Zhang, Biomacromolecules, 2007, 8, 1918–1926 CrossRef CAS PubMed.
- G. Jiang, W. Huang, L. Li, X. Wang, F. Pang, Y. Zhang and H. Wang, Carbohydr. Polym., 2012, 87, 2012–2018 CrossRef CAS PubMed.
- G. Jiang, Y. Yuan, B. Wang, X. Yin, K. S. Mukuze, W. Huang, Y. Zhang and H. Wang, Cellulose, 2012, 19, 1075–1083 CrossRef CAS.
- M. H. Jellinek, E. Soloman and I. Fankuchen, Ind. Eng. Chem., Anal. Ed., 1946, 18, 172–175 CrossRef CAS.
- S. Ran, D. Fang, X. Zong, B. Hsiao, B. Chu and P. Cunniff, Polymer, 2001, 42, 1601–1612 CrossRef CAS.
- W. Ruland, J. Appl. Phys., 1967, 38, 3585–3589 CrossRef CAS PubMed.
- R. Perret and W. Ruland, J. Appl. Crystallogr., 1970, 3, 525–532 CrossRef CAS.
| This journal is © The Royal Society of Chemistry 2015 |

