Luqiong Yanga,
Shilin Huangac,
Feng Wua,
Shaodi Zhenga,
Wei Yangab,
Zhengying Liu*a and
Mingbo Yangab
aCollege of Polymer Science and Engineering, Sichuan University, Chengdu 610065, Sichuan, People’s Republic of China. E-mail: liuzhying@scu.edu.cn; Tel: +86-28-8540-5324
bState Key Laboratory of Polymer Materials Engineering, Sichuan University, Chengdu 610065, Sichuan, People’s Republic of China
cMax Planck Institute for Polymer Research, 55128 Mainz, Germany
First published on 23rd July 2015
The elastic properties and multi-level relaxation behavior of a filler network in isotactic polypropylene/carbon black (iPP/CB) nanocomposites were systematically investigated, which was instructive for the development and application of viscoelastic materials. Based on a two-phase model, master curves of the elastic modulus of composites with different CB concentrations were built to describe the elastic feature of CB networks in the composites. From the elasticity of the networks, it was found that the critical volume of particle for the formation of the elastic network is 2.4 vol% and that the value of critical exponents is 5.1 ± 0.3, indicating that the particle–particle interaction in the network is strong. Based on semi-dilute fractal theory, the value obtained for the fractal dimension of the filler network was df = 2.0 ± 0.1, which was in agreement with the reaction limited aggregation mechanism, namely that CB particles must overcome a great barrier to form a cluster. The relaxation behavior of the filler network was also studied. For composites with a CB content of 2.0 vol% (slightly lower than the elastic percolation threshold of 2.4 vol%), the relaxation behavior became slower with the extension of the annealing time. Furthermore, the CB particles aggregated to form a denser network or backbone and the distribution of relaxation units became narrower, leading to an increase of the relaxation modulus. For composites with a CB content of 13.6 vol%, 0.5 h annealing treatment brought a wider distribution of relaxation units, due to the formation of “short chains” of particles, while both relaxation time and relaxation modulus of the network increased. Further annealing treatment (>0.5 h) made no difference to the distribution of relaxation units and relaxation modulus of the network, but relaxation time of the networks kept increasing. The CB concentration dependence of the relaxation behavior of the network revealed that as CB content increased, the relaxation modulus of the filler network increased monotonously. However, both relaxation time and distribution of relaxation units decreased to a minimum value when CB content increased to 6.4 vol%, and then increased with CB content.
Most researchers studied the rheology properties, especially the relaxation behavior of the composite as a whole system. Tian Tang used a micromechanics model to calculate the effective stress relaxation stiffness of the linear viscoelasticity of the composite.22 Hanna J. Maria studied stress relaxation behavior of organically modified montmorillonite filled natural rubber/nitrile rubber nanocomposites to predict the performance of a material over long periods of time.23 In their study, the research objects are both composites rather than filler networks, which mainly determine the function of the materials. In suspensions with soft particles, as the concentration of colloid particles increase, the particles packing together experience a jamming transition and a colloid network appears. This colloid network could relax in a shorter time range.24–26 For filled polymer composites, filler networks belong to the scope of the colloid as well, so it can be predicted that filler networks in the nanocomposites are not the ideal Hooke solid, they possess the properties of viscoelasticity.27,28 A frequency range of 10−2 to 102 rad s−1 has been accepted in the dynamic frequency sweep by extensive researches to investigate the viscoelasticity of nanocomposite melt.29,30 However, in the conventional investigation range (10−2 to 102 rad s−1), the relaxation behavior of the colloid particle network in the polymer matrix can hardly be detected. Therefore, the test time is expanded to 103 s, guaranteeing that most of the relaxation behavior of the filler network could be detected. (We used a cyclic stress relaxation test, and for each sample eight cycles were carried out. Thus, a longer test time for each circle may lead to an extremely long test time for a sample, which can even lead to degradation of the samples. We therefore think that 103 s is the most suitable time scale for our test.) Compared to what has been reported in the literature, we try to describe the elasticity and multi-level relaxation of the filler network separately, rather than the whole system of the nanocomposite. For this purpose, a two-phase model put forward by Filippone31–34 is proposed to account for the linear dynamic rheology behavior of nanofilled polymer melts and to describe the elastic properties of a filler network separated from the composite melt. Based on the fractal concept raised by Piau,35 the micro-rheological structure of the filler network is disclosed. Furthermore, according to the relaxation behavior of the network, we tried to analyze the structure evolution of the filler or filler network during the whole test domain.
Strain sweep was carried out at a fixed frequency of 0.5 rad s−1 and the strain from 0.01% to 50% was used to investigate the nonlinear viscoelastic behavior of the annealed composites. At the same time, a Keithley 6517B was used to synchronously monitor the electrical resistivity of the samples with the copper electrodes making contact with the geometry, and a voltage of 0.1 V. To prevent ] thermal degradation of the matrix, all the rheological experiments were conducted in a nitrogen atmosphere.
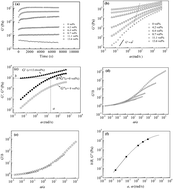
In the iPP/CB composite melt, the CB clusters are inclined to reassemble into bigger structures due to inter-particle attraction.36,38,39 From Fig. 1a, we can see that the elastic modulus of the composite increases during the earlier stage, then it reaches a steady value, meaning that the flocculation of the filler particles leads to an enhancement effect on the composite melt. It is assumed that an equilibrium structure of the composite melt can be obtained after a 2 h melt annealing treatment.39 The frequency-dependent storage modulus of the iPP/CB composite melt based on the equilibrium state is shown in Fig. 1b. It is obvious that CB nanospheres have a dramatic effect on the relaxation behavior of the composite. As the particle loading increases, the elastic modulus G′ increases and the linear viscoelastic data indicates a transition to a solid-like response (a second plateau) at low oscillation frequencies for the composite with particle volume fractions of 8.7 vol% (Fig. 1b). The two-phase model holds the concept that the appearance of the low frequency plateau was contributed to the formation of the filler network, and the value of the plateau modulus reflects the strength of filler network elasticity.31,33,34,37
More details are illuminated by the two-phase model proposed by Filippone.31,33,34 An empirical amplifying factor B(c) (B(c) = G*(c)/G*(c = 0), where G*(c) and G*(c = 0) are the complex shear modulus of the filled sample and neat matrix in the high-frequency region) is applied to account for the increased gap available to the fluid because of the presence of the particles. Once amplified by B(c), the loss modulus G′′(ω) of the neat polymer crosses the cluster network elasticity, b(c) = G′n(c), where G′n(c) is a low-frequency plateau of the storage modulus, and b(c) and G′n(c) are both concentration dependent. A characteristic frequency a(c) is obtained simultaneously, which sets the transition from the domain governed by the filler (ω < a(c)) to that dominated by the matrix (ω > a(c)) (Fig. 1c).32 However, for samples without storage plateau scaling, the G′ curves onto the master curve is not allowed in obedience to the two-phase model which facilitates the identification of the percolation threshold as well. Thus, for these samples we assume that the plateau would occur at a lower frequency, and set a series of the b(c)and a(c) with different values, choosing the appropriate value to obtain the master curve. (The correctness of the choosing of b(c) and a(c) is shown in Fig. 1f, it is obvious that data b/B vs. a(c) is right in the curve of G′′ vs. ω.) Then a precise track in the plane of G′(c)/b(c)–ω/a(c) is established,32 and it is not difficult to find that when excluding the high-frequency domain, the collapse of the G′ data sets on the corresponding master curves is perfect for all samples shown in Fig. 1d. Filippone pointed out that viscosity of composites is dominated by the polymer matrix without any contribution from filler particles at a high frequency, so therefore the data of G′(c)/b(c) vs. ω/a(c) in the high frequency domain can be ignored (Fig. 1e).
From the master curve, the elasticity modulus of the filler network (G′n = b) in the composite melt can be obtained, as shown in Fig. 2d. Furthermore, the storage modulus of the CB network as a function of CB concentration follows the power law:34
G′n ∝ (c − cp)t | (1) |
![]() | ||
Fig. 2 Storage modulus of the CB network as a function of CB concentration. The solid line and the inset represent the result of the fit according to eqn (1). |
By plotting G′n vs. CB loading and fitting it to function (1), the critical particle volume for the formation of the elastic network in composite (cp) is 2.4 vol% and the value of critical exponents is 5.1 ± 0.3 (Fig. 2 and the inset in Fig. 2). According to the percolation power law theory, as long as the filler concentration is above critical threshold, the particle network could build. (In this study, the critical threshold is 2.4 vol%, meaning that when the CB content was above 2.4 vol%, a CB network could build.) For networks with energetic particle–particle interactions, Arbabi and Sahimi distinguished the systems with central forces dominating when t is about 2.1, in which the particles are free to rotate. Furthermore, in networks with bond-bending forces dominating when t is about 3.75, particles can bear stresses by the unbending of their branches.32,40–42 Surve et al. suggested that for polymer-mediated particle networks a universal trend with t ≈ 1.88 was obtained,43 in contrast to systems with strong particle–particle interactions which exhibited elasticity exponents as high as t ≈ 5.3.32 In our study, the value of critical exponents is 5.1 ± 0.3, indicating that the particle–particle interaction is strong in our system.
Fig. 3 shows the nonlinear viscoelastic behavior of the composite melts with different CB concentrations. For pure iPP matrix, the storage modulus almost remains constant during the whole test domain (γ < 50%). However, for the iPP/CB composite melt, as the strain reaches a critical value (γc), the modulus of the composite melt decreases with the increasing of the strain. Furthermore, the degree of non-linearity increases with filler concentration (as CB concentration increases, the critical strain value reduced from ∼2% to ∼0.2%). There is no doubt that the filler network existing in the annealed iPP/CB composite melt plays the role of backbones, so at the critical value (γc) the decreasing of the storage modulus can be contributed to the breakdown of the filler network.
More details about the breakdown of the filler network are obtained by the changing of the resistivity as a function of strain amplitude, as shown in Fig. 4. At a fixed frequency, the storage modulus of the iPP/CB (8.7 vol%) composite melt decreases dramatically with the deformation increasing to a critical strain (∼0.4%). However the resistivity of the sample does not show any synchronous changing, replaced by a lagging increasing of resistivity when the deformation reaches a higher strain of ∼3%, which is much larger than that of ∼0.4%. This indicates that at the beginning of the network deformation, CB particles do not separate immediately with the strain but keep close to each other, which guarantees the existence of the electronic conductive path. Therefore the decrease of storage modulus at the critical strain γc only reflects the yield behavior of the filler network under an external force effect. However, the particle clusters are not separated until a much larger strain (here the strain is ∼3%) is applied. This deformation may break the touching point of the filler network and separate the particle clusters, which leads to the increase of resistivity. Fig. 4b shows the relative resistivity (ρ/ρ0, ρ0 is the resistivity at the lowest strain amplitude) for the composite melts with different CB concentrations as a function of strain amplitude. Obviously, the resistivity of samples with higher CB concentrations is less sensitive to the deformation, indicating that at higher CB concentrations, the separation of a network or cluster is more difficult. However, this network is much easier to yield, as shown in Fig. 3. In order to clarify the structural information of the filler network in detail, we introduce the concept of semi-dilute fractal theory.35
The formulation of the non-fluctuating semi-dilute fractal concept relates fractal dimension to the rheological scaling laws:35
G′c ∝ c5/(3−df) | (2) |
Based on this scaling law, we realised that the power law of c is 4.9 ± 0.6 and the fractal dimension is 2.0 ± 0.1 for iPP/CB composites with a filler network (Fig. 5). It is reported that in dilute suspensions, a diffusion limited, cluster–cluster aggregation process yields df ≈ 1.75, while the reaction limited aggregation yields df = 2.1 ± 0.1, suggesting that suspensions aggregating by these mechanisms should form gels.48 The exponent reflects the topology of the samples and the motion ability of each part. If the fractal dimension of the cluster is relatively large and the cluster is dense, the exponent would be large. Scaling law power values for the elastic modulus found in the literature for similar compounds are:49 (1) G′c ∼ c3.5±0.2 for the mechanism of diffusion limited cluster–cluster aggregation; (2) G′c ∼ c4.5±0.5 for the mechanism of reaction limited cluster–cluster aggregation. Our result shows that G′c ∼ c4.9±0.6, indicating that when CB particles collide with each other, they cannot aggregate into a cluster directly, only those who overcome the strong barrier could turn into a cluster. Thus in our study, the formation of the CB network meets the reaction limited aggregation mechanism. In order to discuss the kinetics of the aggregation process, the mobility of the polymer matrix was investigated by dynamic rheological measurements. Fig. 6 shows the temperature dependence of the gel time for samples with 6.4 vol% CB, and the inset shows the Arrhenius plot of the zero shear viscosity of the neat iPP as a function of temperature. It is observed that the activation energy for the formation of a gel is larger than that of the polymer viscosity (48.8 kJ mol−1 > 39.7 kJ mol−1), indicating that in the iPP/CB composite melt the aggregation of CB particles does not comply with the mechanism of diffusion limited cluster–cluster aggregation, and it has to overcome a great barrier to form a cluster. This meets the mechanism of reaction limited cluster–cluster aggregation, as our previous study showed.39 Similar reports have also been given by Wu.50,51
![]() | ||
Fig. 6 Temperature dependence of the gel time for the sample with a CB concentration of 6.4 vol%. The inset shows the Arrhenius plot of the zero shear viscosity of the neat iPP as a function of temperature.39 |
![]() | ||
Fig. 7 (a) Relaxation behavior of neat iPP and the iPP/CB composite (2.0 vol% CB) after melt annealing at 200 °C for 2 h. (b) Influence of the melt annealing time on the slow relaxation process of the iPP/CB composite (2.0 vol% CB). (c) The fitting parameters of the KWW function (eqn (3)) as functions of annealing time. |
The relaxation process of the filler network can be described by the Kohlrausch–Williams–Watts (KWW) relaxation function:52,53
Gn(t) = G0 × e−(t/τ)m | (3) |
Parameters τ and m are estimated by curve fitting according to the KWW equation, and the fitting results are shown in Fig. 7c. It is obvious that with an increase of annealing time, both the initial modulus G0 and the characteristic relaxation time τ increase, which indicates that more CB particles take part in the formation of the filler network with increasing time, leading to a denser network structure. Thus the motion of the CB “chains” would be restricted by the surrounding particles. Similar researches on the relaxation behavior have been widely reported.24,26 After 4 h annealing treatment, G0 and τ keep increasing, indicating that the inner structure of the network does not reach equilibrium state yet. At the same time, the value of the stretched exponential constant m is within the range of 0.3–0.4. During the annealing treatment, the stretched exponential constant m increases with time, from which we can speculate that the distribution of the relaxation unit becomes narrower after the annealing treatment. Moreover, in addition to the network backbone, there are also many branched structures of CB “chains” in the CB network, whose motion ability is better than that of the backbone. As the annealing is performed, the surrounding CB particles may take part in the growth of the “chains”, thus these “chains” would become longer and denser, and eventually connect to a new backbone, as shown in Fig. 8a. In this way, the motion of the whole CB network would be restricted, leading to a narrower distribution of the relaxation units.
As for the composite with a higher CB concentration (13.6 vol%), the development of the relaxation process during melt annealing is shown in Fig. 9. Slow relaxation behavior of the samples without melt annealing is observed, indicating the filler network formed before annealing treatment. With increasing annealing time, a significant change in slow relaxation of the filler network takes place. The KWW function is used to fit the slow relaxation behavior, shown in Fig. 9a (dashed line), and the fitting results are shown in Fig. 9b. G0 increases with annealing time in the first 0.5 h, however, it shows no increase in further annealing treatment (>0.5 h), indicating that the network in the composites with high filler concentrations would reach the state of equilibrium much more easily. During the whole annealing treatment, the relaxation time of the networks keeps increasing and finally reaches a state of stability after 3 h of annealing treatment. This kind of phenomenon suggests that some changes emerging within the network structure makes the network difficult to relax. Before annealing, m ≈ 0.41, and after 0.5 h of annealing treatment m decreases to 0.33 and further annealing only slightly decreases the stretched exponential constant m. It is believed that in a high concentration filler filled composite, the filler network would be very dense and that CB particles joined later would only form short CB “chains”, leading to a wide distribution of the relaxation unit, so that the value of m decreases. After annealing for 0.5 h, it is hard for short CB “chains” to make contact with each other, thus these short “chains” could not make a significant contribution to the modulus of the filler network. However, the existence of short CB “chains” would restrict the motion of the backbone, resulting in a longer relaxation time of the filler network, details are shown in Fig. 8b.
![]() | ||
Fig. 9 (a) Development of the slow relaxation process in the composite melt with 13.6 vol% CB during melt annealing. (b) The fitting parameters of the KWW function (eqn (3)) as functions of annealing time. |
![]() | ||
Fig. 10 (a) Relaxation behaviors of the iPP/CB composite melts (after annealing at 200 °C for 2 h) with different CB concentrations. (b) The fitting parameters of the KWW function (eqn (3)) for the slow relaxation process in the composite melts. |
The KWW equation was used to systematically study the relaxation behavior of the filler network. The results showed that in the iPP melt, the CB network was not the ideal Hooke solid and in long time scale it could relax as well. This relaxation behavior of the filler network was closely related to annealing time and filler concentration. For composites with low CB concentrations, the relaxation behavior became slower during annealing treatment, the CB particles or networks became denser and the distribution of relaxation units became narrower, leading to the increase in relaxation modulus. For composites with high CB concentrations, short time annealing treatment brought a wider distribution of relaxation units, as the formation of short chains, while both relaxation time and relaxation modulus of the network increased. However, in further annealing treatments the relaxation time of the network kept increasing, but the distribution of the relaxation units and relaxation modulus of the filler network did not show any difference. The CB concentration dependence of the relaxation behavior revealed that as CB content increased, the relaxation modulus of the filler network increased monotonously. However, both the relaxation time and distribution of relaxation units decreased to a minimum value when the CB content increased to 6.4 vol%, and then increased with CB content.
This journal is © The Royal Society of Chemistry 2015 |