Structure characteristics and photoactivity of simultaneous luminescence and photocatalysis in CaV2O6 nanorods synthesized by the sol–gel Pechini method

Ruijin Yuab, Na Xuea, Shuaidong Huob, Junbo Lib and Jinyi Wang*a
aCollege of Science, Northwest A&F University, Yangling, Shaanxi 712100, PR China. E-mail: jywang@nwsuaf.edu.cn; Fax: + 86-29-87082520; Tel: + 86-29-87082520
bDepartment of Chemistry, University of Massachusetts Amherst, 710 North Pleasant Street, Amherst, MA 01003, USA

Received 2nd June 2015 , Accepted 10th July 2015

First published on 10th July 2015


Abstract

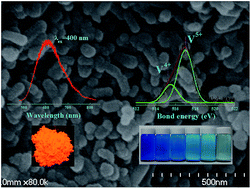
The work reports the large-scale synthesis, and simultaneous luminescent and photocatalytic activities of self-activated metavanadate CaV2O6 nanorods. The samples were synthesized using the Pechini method on the basis of a citrate-complexation route. The phase formation and crystal structure were investigated by X-ray powder diffraction (XRD) and structural refinements. The detailed surface properties were characterized by scanning electron microscopy (SEM), transmission electron microscopy (TEM), energy dispersive X-ray spectroscopy (EDS), X-ray photoelectron spectroscopy (XPS) and Brunauer–Emmett–Teller (BET) measurements. The photoactivity was evaluated by the photoluminescence of the as-prepared powders and the photodegradation of methylene blue (MB) solutions. CaV2O6 presents a broad emission centered at 580 nm, which is different from the luminescence in commonly reported self-activated vanadates. The results of excitation spectra and decay curves (10.5 μs) indicate only one kind of luminescence center in the lattices. In particular, it was found for the first time that CaV2O6 nanorods showed excellent photocatalytic activity. The luminescence properties and degradation mechanism were discussed based on the structure characteristics and the band structure. CaV2O6 presents a layered structure constructed by line-arranged VO5 units. The coexistence of V4+/V5+ ions and the induced oxygen vacancies in the lattices were confirmed to have a contribution to the photocatalytic activities. These results indicate that CaV2O6 could be a potential photoactive material with a two-dimensional structure.

1. Introduction

Transition metal oxides have been widely investigated due to their rich crystal structures, diverse applications, and environmental affability. For example, 3d transition-metal vanadate oxides have been widely investigated due to their interesting redox and electrochemistry properties, and interesting applications such as optical materials, lithium ion battery cathode materials, dielectric ceramics, semiconductors, magnetic candidates, biology materials, catalysis, etc.1–6

Especially as efficient photoactive materials, vanadates have been found to be of considerable interest in basic research7 and different applications such as thermochromism,8 self-activated luminescence,9 rare earth ions doped phosphors,10 optical imaging for medical applications,11 UV-visible-light-driven photocatalyts,12–16 etc. Vanadium ions exhibit three oxidation states V(III), V(IV) and V(V). Unlike phosphates containing only PO4 tetrahedral geometry, V–O configurations in vanadates have several possibilities occurring as VO4, VO5, and VO6 in the lattices.17 Metavanadates MV2O6 (M = Mg, Ca, Zn, Cd) are considered to be interesting candidates for further investigations.18,19 MV2O6 crystallizes in space group C2/m dominated by the presence of ladder-type {V2O6} chains made of edge-shared VO5 square pyramids. It contains zigzag chains of edge-sharing VO6. Octahedrally coordinated M atoms lie on twofold axes situating between the layers.20–22 MV2O6 compounds have been investigated for their structure,18,23 electro-optic technology applications such as morphology-controlled synthesis,24 photocatalytic performance,25 luminescence activated by rare earth ions,26 lithium storage in lithium-ion batteries27 and energy storage/conversion materials.28

In the present work, CaV2O6 nanorods were synthesized via the sol–gel Pechini method. The phase formation and the structural refinement were conducted. The surfaces were characterized by SEM, TEM, EDS, XPS and BET measurements. The luminescence was investigated using photoluminescence spectra, decay curves, and the absolute internal quantum efficiency (η). The photocatalytic activity of CaV2O6 nanostructures were measured using the photodegradation of MB solutions. The photoactive properties were discussed in relation to the structure and defects.

2. Experiments

CaV2O6 was prepared by the Pechini method on the basis of a citrate-complexation route. Firstly, the raw materials of stoichiometric Ca(NO3)2 and NH4VO3 were dissolved in deionized water. The nitrate solution was then complexed by citric acid (in a double molar amount of Ca2+), and neutralized by ammonium hydroxide (25% wt). The obtained solution was promoted by heat treatment at 85 °C for 3–5 h with constant stirring. Then, a certain amount of PVA was slowly added in the solution to adjust the viscoelasticity, and the solution was stirred for 2 h to obtain a homogeneous viscous solution and spin-coated on several glass plates. The precursor thin films can be obtained by natural withering of the coated glasses. Finally, the spin-coated films were annealed at the desired temperature (700 °C) producing a powder with the heating rate of 3–5 °C min−1 and cooled to room temperature naturally.

The XRD pattern was collected with a Rigaku D/Max diffractometer operating at 40 kV, 30 mA with Bragg–Brentano geometry using Cu-Kα radiation (λ = 1.5405 Å). Structural refinements were performed using the GSAS (general structure analysis system) program.29 The UV-excited luminescence spectra were recorded with a Perkin-Elmer LS-50B luminescence spectrometer. The QE was measured using a Hamamatsu-Photonics C9920-02 Absolute Photoluminescence Quantum Yield Measurement System with an integral sphere at room temperature. The diffuse reflection spectrum (DRS) was obtained with a Cary 5000 UV–Vis-NIR spectrophotometer using BaSO4 powder as a standard reference. TEM and high-resolution transmission electron microscopy (HRTEM) images were recorded using a JEOL JEM-2010F microscope. XPS analysis was performed using an XPS, Kratos analytical, ESCA-3400, Shimadzu.

In this work, the photocatalytic activity of CaV2O6 nanoparticles was tested by the photo-removal of methylene blue [i.e. MB, (CH3)2N(C6H3)NS+(C6H3)N(CH3)2Cl] under visible light irradiation. This is one of the common dye pollutants. Exposure to MB can cause harmful effects in humans such as an increase in heart rate, vomiting, Heinz body formation, cyanosis, jaundice, quadriplegia, and tissue necrosis.30 So removal of MB from waste water is an urgent task. Usually several traditional methods are used for the removal of MB from waste water such as adsorption, biological methods (biodegradation) and chemical methods (chlorination, ozonation). Heterogeneous photocatalysis has been developed as a new efficient method for removal of MB.

The photocatalytic experiment was performed in a 0.5 L cylindrical glass photocatalytic reactor with a 500 W Xe lamp as the visible light source. A cut filter (400 nm) was inserted between the xenon lamp and reactor to eliminate ultraviolet light. The flow rate of air was kept at 500 mL min−1. Typically, 300 mL of a methylene blue (10 mg L−1) solution containing 0.05 g of the photocatalyst was mixed in a beaker. Prior to the photocatalytic reaction, the suspension was allowed to reach adsorption/desorption equilibrium by maintaining the solution in the dark for 1 h. At a defined time interval, 5 mL of methylene blue was taken out of the reactor. After being centrifuged, the solution was analyzed using the UV–Vis spectrophotometer. The percentage of degradation was calculated with the formula [1 − (Ai/A0)] × 100%, where A0 is the absorbance of the original methylene blue solution before irradiation and Ai is the absorbance of the methylene blue solution taken from the reactor.

3. Results

3.1 Phase formation

The observed diffraction pattern of the CaV2O6 nanorods was investigated with structural refinement using the GSAS program shown in Fig. 1. The diffraction peaks in the pattern can be clearly indexed to a pure monoclinic CaV2O6 phase. The refined parameters and atomic coordinate parameters are listed in Table 1 and 2, respectively. CaV2O6 crystallizes in a monoclinic system with the space group of C12/m1 (12) and unit parameters of a = 10.0397 Å, b = 3.6666 Å, c = 7.0224 Å, α = 90°, β = 104.84°, γ = 90.65°, Z = 2 and V = 249.88 Å3. The experimental data of the structure are in agreement with the reported monoclinic-CaV2O6 nanoribbons synthesized via a hydrothermal method.24
image file: c5ra10465c-f1.tif
Fig. 1 The observed (crossed) and calculated (red solid line) intensities of the X-ray diffraction profile of CaV2O6. The difference profile is located at the bottom of the figure.
Table 1 Crystallographic data and refinement parameters of CaV2O6
Formula CaV2O6
Radiation Cu Kα
Symmetry Monoclinic
Space group# C12/m1 (12)
a 10.0397(5)
b 3.6666(1)
c 7.0224(3)
α 90
β 104.84(1)
γ 90
Z 2
R-Bragg (%) 2.313
Rp (%) 6.85
Rwp (%) 10.344
Rexp (%) 7.591
X2 1.227
V3 249.88(17)


Table 2 Refined atomic coordinate parameter data of CaV2O6 at room temperature
Atom x/a y/b z/c U2]
Ca1 0 0 0 0.0476(30)
V1 0.2357(4) 0 0.6688(6) 0.0245(18)
O1 0.08740 0 0.72190 0.0214
O2 0.14340 1/2 0.11820 0.0265
O3 0.24650 0 0.39340 0.0244


Fig. 2(a) displays the structure of CaV2O6 along [010] modeled by the data in Table 2. It is well-known that vanadates generally consist of VO4 units. However, in contrast, CaV2O6 has a layered structure constructed by line-arranged VO5 as shown in Fig. 2(b). The framework is composed of zigzag chains of the VO5 trigonal bipyramids along the [010] axis and Ca is eight-coordinated linking three {V2O6} chains. The vanadium has a square pyramidal geometry coordinated by five O atoms with V–O distances from 1.6123 to 1.9099 Å. Each chain consists of two asymmetric VO5 units connected through edge-sharing. The atoms of the nearest pair are situated on the (100) plane at a distance about 3.08 Å from the central V atom. The interaction with the next nearest pair of V atoms is anisotropic and is maximal along the [010] axis.


image file: c5ra10465c-f2.tif
Fig. 2 The schematic view of the CaV2O6 structure along the b-direction (a) and the VO5 chain along [010] (b). The numbers denote the O–V distance (Å).

3.2 Morphological and surface properties

The typical SEM images of the CaV2O6 nanorods are shown in Fig. 3. The sample shows well crystallized worm-like short rods. The estimated average length and width are 100 nm and 50 nm, respectively. In addition, the microstructure and morphology of the nanorods were also investigated by TEM and HRTEM. As displayed in Fig. 4(a) and (b), the as-prepared samples have uniform dispersion. The TEM micrographs also demonstrate that the morphology of the sample is composed of a rod-like microstructure with a diameter of about 50 × 100 mm. The high-resolution (HR) TEM image in Fig. 4(c) confirms the single-crystalline nature of the CaV2O6 nanoparticles. The spacing of 0.5 nm corresponds to the (200) reflections of CaV2O6. In addition, the corresponding selected area electron diffraction (SAED) pattern (Fig. 4(d)) exhibits the typical monoclinic symmetric diffraction pattern ascribed to CaV2O6.
image file: c5ra10465c-f3.tif
Fig. 3 The typical SEM photos of the CaV2O6 nanorods.

image file: c5ra10465c-f4.tif
Fig. 4 The TEM photos (a and b), HRTEM image (c), and selected area electron diffraction (SAED) pattern of the CaV2O6 nanorods (d).

The elemental compositions of the sample were measured using energy dispersive X-ray (EDX) spectroscopy and the spectrum is shown in Fig. 5. Several specific lines show the signals of the Ca, V, and O elements. The average Ca/V ratio was calculated to be 0.513, which is close to the theoretical stoichiometric value in line with the chemical formula of CaV2O6.


image file: c5ra10465c-f5.tif
Fig. 5 The EDX spectrum of the CaV2O6 nanorods indicating the elemental distributions.

The BET surface area and pore size distribution of the nanorods were investigated. Fig. 6 shows the N2 adsorption–desorption isotherm and the corresponding pore-size distribution curve of the CaV2O6 nanorods. According to the IUPAC classification, the isotherm of the sample is the typical IV pattern, which is characterized with a hysteresis loop. The high adsorption at P/P0 approaching to 1.0 indicates the coexistence of mesopores and macropores. The Brunauer–Emmett–Teller (BET) measurement shows that the sample has a specific surface area of 63 m2 g−1. The pore size distribution of the sample is quite narrow and monomodal, implying that the prepared nanoparticles are composed of uniform particles. The pore size distribution is centered at about 3 nm (inset Fig. 6).


image file: c5ra10465c-f6.tif
Fig. 6 The nitrogen adsorption–desorption isotherms of the CaV2O6 nanorods; inset is the corresponding pore-size distribution curve.

3.3 Optical absorption and band gap energy

The UV–Vis absorption spectrum of the CaV2O6 nanorods in Fig. 7 displays a very broad band from 200–500 nm. The optical absorption edge is at about 470 nm. The steep shape of the spectrum indicates that the light absorption is not caused by a transition from the impurity levels but was caused by the band-gap transition.31 In CaV2O6 the band-gap absorption is contributed to by the V5+ optically-activated centers. As is well-known, the charge-transfer (CT) transitions take place from O2− to V5+ ions in the VO43− tetrahedral groups in the spin-allowed transitions which are from the ground state 1A1 to the excited states, the 1T2 and 1T1 levels of the V5+ ion in VO4.32
image file: c5ra10465c-f7.tif
Fig. 7 The UV–Vis absorption spectrum of the CaV2O6 nanorods; inset is the estimation for the band-gap energy (Eg).

The band gap energy (Eg) can be evaluated by Wood–Tauc theory as plotted in the inset of Fig. 7. Eg was calculated by the relation of αhν ∝ (Eg)k, where α is absorbance, h is the Planck constant, ν is frequency, and k is a constant associated to the different transitions. The best linear relation is obtained for a k value of 2 (Fig. 7), indicating an indirect allowed electronic transition. The band gap of the CaV2O6 nanorods is estimated to be 2.56 eV. It can be assumed that in the structure of CaV2O6 O-2p orbitals locate at the top of the valence band, and the empty vanadium 3d orbitals V(3d) of the (VO4) group form the bottom of the conduction band.

3.4 Photoluminescence characteristics

Fig. 8 shows the PL emission and excitation spectra for CaV2O6. The emission excited at 254 nm and 400 nm shows a similar profile from 500 to 800 nm with the maximum at 580 nm. The full-width at half-maximum (FWHM) is about 126 nm. In Fig. 8 the excitation spectrum was obtained by monitoring the emission of two positions. The maximum excitation band is at 254 nm and another shoulder at about 400 nm. The maximum QE of CaV2O6 was measured to be 27% under an excitation of 400 nm. This value is lower than that reported in CsVO3 (87%), but it is higher than those in Ba2V2O7 (25%), Sr2V2O7 (8%) and Ca2V2O7 (0.9%).33 The luminescence CIE chromaticity coordinates were calculated to be about x = 0.561, y = 0.421 as listed in Fig. 9. As shown in the figure, the sample presents a bright reddish brown color under a handheld lamp.
image file: c5ra10465c-f8.tif
Fig. 8 The luminescence and excitation (normalized) spectra of the CaV2O6 nanorods.

image file: c5ra10465c-f9.tif
Fig. 9 The luminescence CIE coordinates of the CaV2O6 nanorods. Inset is the photograph of the phosphors under the UV-lamp.

Fig. 10 shows the decay curves of CaV2O6 by monitoring 550 nm and 650 nm under an excitation of 355 nm with a Nd:YAG laser. The luminescence curves show a single exponential decay with similar lifetimes of 10.5 μs. This indicates only one kind of luminescence center in the lattices. This is in agreement with the results in Fig. 8, i.e., the emissions have nearly the same profile under different excitations, meanwhile, the different emissions also keep similar excitation spectra.


image file: c5ra10465c-f10.tif
Fig. 10 The luminescence decay curves of the CaV2O6 nanorods by monitoring the emission wavelengths 550 and 650 nm under an excitation of 355 nm. The inset shows the schematic model for the absorption and emission processes of the VO4 group.

3.5 Photocatalytic activity

The results of the photocatalytic degradation of MB solutions by the CaV2O6 nanorods under visible light irradiation are shown in Fig. 11(a). The figure is the degradation shown by the UV–Vis adsorption spectra of the MB-CaV2O6 solutions. It can be seen that the absorption intensity of MB significantly decreased with increasing irradiation time which indicates the solution had been decolorized. No new bands appeared in the UV–Vis region due to the reaction intermediates formed during the degradation process.
image file: c5ra10465c-f11.tif
Fig. 11 (a): The UV–Vis adsorption spectra of the MB-CaV2O6 nanorods solutions under light irradiation; (b): the photodegradation effects of MB by the CaV2O6 nanorods, CaV2O6 with the TBA additive, P25; (c): the degradation kinetics by means of plotting ln(C0/C) vs. time.

Fig. 11(b) shows the photocatalytic degradation curves of MB solutions by the CaV2O6 nanorods under visible light illumination by monitoring the decrease in the UV-visible absorption (λmax = 664 nm). A commercial P25 sample was also measured under the same test conditions for comparison. The MB solutions keep stable under light irradiation in a blank experiment without any photocatalysts. The absorption/desorption equilibrium was established after 30 min absorption in the dark for the CaV2O6 photocatalyst. There was less than 30% degradation of MB after light irradiation by P25. This can be attributed to its bad photo-absorption in TiO2. In contrast, the MB concentration decreased quickly with time in the presence of the CaV2O6 nanoparticles. The MB solution was degraded by 90% in 180 min. The kinetic constant was determined from the pseudo-first-order reaction rate equation of ln(C0/Ct) = kt, where C0 is the initial concentration of MB, Ct is the concentration of MB at time t, k is the kinetic constant. ln(C0/Ct) vs. t can be plotted as shown in Fig. 11(c), which has a good linear fit indicating a pseudo-first-order dynamic process for the kinetics of the MB photodegradation by CaV2O6 nanoparticles. The kinetic constants of the CaV2O6 nanorods and P25 were 0.0165 min−1 and 0.0026 min−1, respectively. The CaV2O6 nanorods present a better photocatalytic activity under visible light irradiation.

The photostability of CaV2O6 as a photocatalyst was also examined using a recycling photocatalytic experiment. Fig. 12 shows three repetitive operations of the CaV2O6 nanorods for the photodegradation of MB solutions. The results show that the photodegradation of MB keeps a stable level. In this process the phase formation of the CaV2O6 nanorods after photocatalysis was also checked by XRD measurements. Fig. 13 shows the pattern of the CaV2O6 sample after photocatalysis compared with the standard pattern card PDF# no: 23-0137. The sample also keeps the same phase indicating no structural changes were induced by the photocatalytic effect.


image file: c5ra10465c-f12.tif
Fig. 12 The repetitive operations of the CaV2O6 nanorods for the photocatalytic degradation of MB.

image file: c5ra10465c-f13.tif
Fig. 13 The XRD patterns of the CaV2O6 nanorods after photocatalysis. The pattern is compared with the standard pattern card PDF2 no: 23-0137.

4. Discussion

As demonstrated by the experimental results shown above, there are two obvious specialties in the photoactivity of the CaV2O6 nanorods. Firstly, the emission of CaV2O6 shows great red-shift compared with the reported vanadates. It is well-known that the luminescence of vanadates has been attributed to the ligand–metal charge transfer (CT) bands (2p orbital of oxygen ion → 3d orbital of vanadium ion) in the [VO4]3− group. The molecular orbitals of the V5+ ion are expressed as a ground 1A1 and excited 1T1, 1T2, 3T1, and 3T2 states.32 The excitation and luminescence transitions are expressed in the inset of Fig. 10. The emission of self-activated photoluminescence vanadates is usually located at a green or yellow wavelength, for example, AVO3 (A: K, Rb, and Cs) (525 nm), M3V2O8 (M: Mg and Zn) (575 nm),32 Ba2V2O7 (green), Sr2V2O7 (yellowish green), Zn3(VO4)2 (yellow), and Mg3(VO4)2 (yellow),34 etc. Secondly, the photocatalytic activity of the as-prepared CaV2O6 nanorod solutions was observed, which is far more efficient than that of the commercial P25. This was demonstrated by the photodegradation of MB dye.

To elucidate the photoactivity of the CaV2O6 nanorods, two origins should be considered. Firstly the crystal structure characteristics of the CaV2O6 nanorods is one of the important contributions to its optical properties. Matsushima et al.34 investigated the luminescence of vanadate phosphors including (MII2VO4Cl), (MII2V2O7), (MII3(VO4)2) with divalent cations MII of Mg, Sr, Ba, and Zn, and (AIVOF4) with an alkali metal AI. These vanadates showed self-activated luminescence with the colors covering almost the whole visible-light region from blue to yellow with Sr2VO4Cl (blue), Ca2VO4Cl (blue), Ba2V2O7 (green), Sr2V2O7 (yellowish green), Zn3(VO4)2 (yellow), and Mg3(VO4)2 (yellow). In the report, a correlation was suggested between the colors and the structural features as the longer V–O distances in the crystal structures led to the longer emission wavelengths. Following this conclusion, it is reasonable to explain the long emission wavelength of the CaV2O6 nanorods. As shown in Fig. 2, the V–O distance can reach 1.9099 Å, which is longer than the reported values in vanadate phosphors such as Sr2VO4Cl (blue, 0.1707 Å), Ba2V2O7 (green, 0.1719 Å), CsVOF4 (yellow, 0.1736 Å) and Mg3(VO4)2 (yellow, 0.1729 Å).34 This is the first time photocatalysis using layered vanadate with a framework constructed by VO5 pyramids has been reported. The structure characteristics of the CaV2O6 nanorods could favour the specialty. Similar properties have been reported in titanates of Cs2TinO2n+1 (n = 2, 5, 6).35 Cs2Ti2O5 consists of a layered structure with TiO5 units and shows a higher photocatalytic activity for H2 evolution from aqueous methanol solutions than Cs2Ti5O11 and Cs2Ti6O13 with ordinary six-coordinate structures. The five-coordinate structure in Cs2Ti2O5 is regarded as an unsaturated coordination state for titanates. Such unsaturated active sites are normally only observed on the oxide surface, which are more readily hydrated than those of titanates with ordinary six-coordinate structures. Although detailed evidence is not available for the CaV2O6 nanorods, the five-coordinate structure could be tentatively regarded as one of the contributions to the high photocatalytic activity.

Secondly, the possible defects in CaV2O6 could play an important role on the electrochemical performance especially reducing the dimensionality of the materials in the nano-regime. In the CaV2O6 nanorods, it is indispensable to confirm the oxide states of the V ions. It is well-known that V can present multiple valences in a compound. With this consideration, the XPS information of the V and O ions in the lattices was measured as shown in Fig. 14. The XPS curve shows an obvious asymmetric profile, indicating there are multiple valence states. The curve-fitting could be deconvoluted into two lines at 515.5 eV (Xc1) and 517 eV (Xc2), which could be assigned to the presence of surface V4+36 and V5+,37 respectively. The intensity was estimated by the integrated area indicating V5+ (80 at%) and V4+ (20 at%). The existence of V4+ ions is reasonable because V5+ in CaV2O6 could be reduced to the lower valence due to the reducing effects of the C components in the Pechini synthesis. This suggestion could be clarified by the comparative investigation with the annealed sample shown in Fig. 14. The XPS curve of V in the annealed sample at 500 °C shows a symmetric profile, indicating the presence of only surface V5+.


image file: c5ra10465c-f14.tif
Fig. 14 The X-ray photoelectron spectroscopic curves of the V ions measured in the as-prepared and annealed CaV2O6 nanorods.

To discuss the oxidation state of V, the bond valence sum, Vi, can be considered as the oxidation number of the cation i located in the coordination polyhedron of oxygen ions j calculated by the empirical formula:38

 
image file: c5ra10465c-t1.tif(1)
where Sij is the bond valence, lij is the interatomic distance; l0 is the bond valence parameter reported to be 1.803 for V5+.39 The V–O distances in CaV2O6 are 1.7923 Å, 1.6779 Å, 1.9099 × 2 Å and 1.9756 Å obtained through the structure refinements. So the bond valence sum of V in the CaV2O6 nanorods is calculated to be 4.47. Therefore, it can be considered that V has at least two possibilities, i.e., penta- or lower valence states. The existence of V4+ ions in CaV2O6 is possible. The V4+ ion was also reported in ZnV2O6 crystals grown from the melt.19 In our work, the presence of V4+ might be due to the reduction of V5+ by the organics from the staring materials. The hydrolysis of NH4VO3 in water can generate a lot of H+. It has been demonstrated that VO43+ in acid solutions can exist in the form of VO2+ whose standard electrode potential is as large as +1.0 V (VO2+ + 2H+ + e = VO2+ + H2O, φΘ = +1.0 V) and close to that of Cr2O72− (Cr2O72−+14H+ + 6e = 2Cr3+ + 7H2O, φΘ = +1.33 V) indicating its oxidability.40,41 Therefore, V5+ can be reduced to V4+ species.

In vanadates VO5 usually acts as a quenching center for the luminescence. For example, among M2V2O7 (M = Ca, Sr, Ba), the formation of VO5 pyramids was thought to reduce the luminescence of Ca2V2O7 (consisting both VO4 and VO5, QE = 0.9%), which is much lower than that in Ba2V2O7 (QE = 25%) and Sr2V2O7 (QE = 8%) which consist only of VO4 in the lattices.33 Moreover, no luminescence was observed in MV2O6 (M = Ba, Sr, Ca, Mg, and Zn) with the similarly structured edge-shared VO5 materials.33 The emission band of the CaV2O6 nanorods could come from the color centers of V4+ ions. The emission from V4+ has been reported. For example, V4+ shows a broad emission at 690 nm in CaYAIO4 excited at 500 nm.42 The broad luminescence of 600–800 nm in V-doped Gd3Ga5O12 has been reported due to the V4+-impurity ions.43

The photocatalytic activity of the CaV2O6 nanorods could be understood by the coexistence of V4+/V5+ in the lattices. A similar phenomenon has been reported in V2O5 doped TiO2,44 and BiVO4 nanorods,41 which processed enhanced photocatalysis due to the defects of V4+ species. The mechanism was proposed as shown in Fig. 15.44


image file: c5ra10465c-f15.tif
Fig. 15 The energy band diagram and photocatalytic mechanism illuminating the effects of multiple valences of V.

Firstly V4+ ions as the metal ion dopants alter the recombination rate of the photo-generated electron–hole pairs:

 
Photocatalyst + → eCB + hVB+ (2)
 
V4+ + eCB → Velectron-trap3+ (3)
 
V4+ + hVB+ → Vhole-trap5+ (4)

The induced local energy levels of V4+/V3+ (eqn (3)) and V5+/V4+ (eqn (4)) are located below the CB and above the VB, respectively. When the electrons in the VB are excited to the CB, the same amount of holes are created in the VB. It can be seen that the V4+ ions could act as both electron and hole traps, and turn into V3+ and V5+ ions by trapping photogenerated electrons and holes, respectively.41,45 Afterward, the V3+ ions and electrons could react with the adsorbed O2 on the surface of the photocatalyst to form O2−, which on protonation generates the hydroperoxide radicals, HO2˙ which produce the hydroxyl radical ˙OH. Meanwhile, V5+ and holes could react with the surface hydroxyl groups (or H2O) to produce the hydroxyl radical ˙OH, which then decompose the organic dye:

 
V3+ + O2 → V4+ + O2 (5)
 
eCB + O2 → O2 (6)
 
V5+ + OH → V4+ + ˙OH (7)
 
hVB+ + OH → ˙OH (8)

To confirm the presence of hydroxyl radicals (˙OH), the addition of the scavenger tert-butyl alcohol (TBA) was added in the process of the photocatalysis, which is well-known as an effective scavenger for ˙OH.46 As shown in Fig. 11(b), after 2 mL of TBA was added to the CaV2O6 solutions, the degradation of MB was decreased after the light irradiation. This indicates that the MB degradation could be driven by the contribution of ˙OH radicals. This confirms that the hydroxyl radicals are the major active species responsible for the MB photodegradation, which could oxidize the adsorbed pollutant MB on the surface of CaV2O6.

 
OH˙ + MB → oxidation-products (9)

Usually the hydroxyl radical is a powerful electrophile reacting with organic substances.6,47 The reactive species on the surfaces initiate a series of bond-breaking and formation steps, ultimately leading to the formation of CO2 and H2O. Fig. 16 shows the IR spectra of the MB solutions after reacting with the CaV2O6 samples after different times under visible light irradiation.


image file: c5ra10465c-f16.tif
Fig. 16 The IR spectra of the MB solutions after photocatalytic degradation by the CaV2O6 samples for different times.

The MB molecule presents the typical bonds such as the C–C stretching, the N–CH3 (the bond between CH3 and the nitrogen atom) stretching, the C–H asymmetric stretching of CH3, the C–H symmetric stretching and O–H vibration in H2O, etc. The exposure of MB/CaV2O6 to visible light irradiation causes the intensity of the MB bands gradually weaken due to bond-breaking in the MB molecule. This process finally induces the conversion of MB to the pollution free oxidation products including CO2, H2O etc.

Another important defect inevitably induced by the V4+ defects is the oxygen vacancy (VO) on the surface of the photocatalysts with dimensionality in the nano-level regime. In the CaV2O6 lattices, the existence of V4+ defects requires positive charge compensations for the charge balance. The positive charge due to the V4+ ion substitute for V5+ may be combined with the oxygen vacancy to form complexes of image file: c5ra10465c-t2.tif. Such suggested charge compensation could be clarified on the XPS curves of the oxygen components. Fig. 17 shows the O 1 s XPS spectra of the as-prepared CaV2O6 and the annealed sample at 500 °C in air.


image file: c5ra10465c-f17.tif
Fig. 17 The X-ray photoelectron spectroscopic curves of the O1s components in the as-prepared (a) and annealed (b) CaV2O6 samples. The peaks 1, 2, and 3 were exposed by Gaussian components.

The asymmetrical peak in the annealed sample is deconvoluted into three symmetric Gaussian components labeled as 1, 2, and 3. Peak 1 can be attributed to the oxygen in VO43− because of its dominant concentration. While peak 2 (at 531.9 eV) and peak 3 (at 533.1 eV) can be ascribed to chemically adsorbed water and adsorbed oxygen, respectively, for the approximation to their normal values.48 However, compared with the annealed sample, the as-prepared CaV2O6 presents an extra peak d, which deviates a little from the normal O lattice. This reveals that some oxygen defects exist in the lattices. Considering the annealing treatment occurred in an air atmosphere, it is reasonable that the defect oxygen in the as-prepared sample is related to the oxygen vacancies.49 This is in agreement with the disappearance of the V4+ ions in the annealed samples as shown in Fig. 14.

It has been demonstrated that in BiVO4 nanorods there are plenty of oxygen vacancies induced by V4+ on the surface of the nanoparticles.41 Very recently, Rossell et al.50 reported a detailed quantitative investigation for the VO in vanadium in monoclinic BiVO4 particles: within a 5 nm-thick shell, the oxidation state of vanadium is reduced from +5 to about +4. Thus, the charge neutrality near the surface demands 15% oxygen vacancies. And the experiments provided direct evidence for the oxygen vacancies at the surface of BiVO4, such as X-ray photoelectron spectroscopy, calculations of the density of the electron states and the electron energy-loss near-edge structure. Consequently, it is reasonable the high vacancy concentration in the CaV2O6 nanorods is advantageous for the optical absorption in the lattices. VO can strongly adsorb plentiful O2− and OH species on the surface, strongly enhancing the photocatalytic effects of the vanadates.

5. Conclusions

Nanorod-like CaV2O6 was prepared by the Pechini method with an average length and width of 100 nm and 50 nm, respectively. The sample was investigated through the structural refinement in a monoclinic system containing a layered structure constructed by the line-arranged VO5 pyramid units. CaV2O6 shows an indirect allowed electronic transition with a band gap energy of 2.56 eV. The CaV2O6 nanorods can be excited by near UV light resulting in a broad band between 500 and 800 nm. CaV2O6 presents a broad emission peak at around 615 nm at room temperature, which is different from the yellow luminescence in commonly reported self-activated vanadates. In particular, the CaV2O6 nanorods show an excellent photocatalytic activity for the photodecomposition of MB solutions under UV-visible light irradiation. The luminescence properties and photodegradation mechanism were discussed based on the structure characteristics and the defect states. The two-dimensional layer-structure with VO5 units, the coexistence of V4+/V5+ ions and the defects of oxygen vacancies in the lattices were suggested to be responsible for the simultaneous luminescence and photocatalysis. The results indicate that CaV2O6 could be a potential photoactive material with two-dimensional structures used in environmental quality, smart materials, lighting and display.

Acknowledgements

This work was supported by the National Natural Science Foundation of China (Grant No. 21201141), the Chinese Universities Scientific Fund (Grant No. QN2011119), and the Young Faculty Study Abroad Program of Northwest A&F University.

References

  1. V. S. Nair, S. Sreejith, P. Borah, S. Hartung, N. Bucher, Y. Zhao and S. Madhavi, RSC Adv., 2014, 4, 28601 RSC.
  2. C. Mondal, A. K. Sasmal, S. M. Yusuf, M. D. Mukadam, J. Pal, M. Ganguly and T. Pal, RSC Adv., 2014, 4, 56977 RSC.
  3. P. P. Sahoo, B. Zoellner and P. A. Maggard, J. Mater. Chem. A, 2015, 3, 4501 CAS.
  4. D. Sun, G. H. Jin, H. Y. Wang, P. Liu, Y. Ren, Y. F. Jiang, Y. G. Tang and X. B. Huang, J. Mater. Chem. A, 2014, 2, 12999 CAS.
  5. H. Q. Song, Y. G. Liu, C. P. Zhang, C. F. Liu and G. Z. Cao, J. Mater. Chem. A, 2015, 3, 3547 CAS.
  6. W. Jiang, J. A. Joens, D. D. Dionysiou and K. E. O’Shea, J. Photochem. Photobiol., A, 2013, 262, 7–13 CrossRef CAS PubMed.
  7. X. G. Kong, Z. L. Guo, P. H. Wen, J. F. Huang, L. Y. Cao, L. X. Yin, J. Y. Li and Q. Feng, CrystEngComm, 2015, 17, 3777–3782 RSC.
  8. H. J. Zhou, J. H. Li, Y. C. Xin, X. Cao, S. H. Bao and P. Jin, J. Mater. Chem. C, 2015, 3, 5089–5097 RSC.
  9. J. C. Zhou, F. Huang, J. Xu, H. Chen and Y. S. Wang, J. Mater. Chem. C, 2015, 3, 3023 RSC.
  10. G. Chu, X. S. Wang, T. R. Chen, W. Xu, Y. Wang, H. W. Song and Y. Xu, J. Mater. Chem. C, 2015, 3, 3384 RSC.
  11. L. P. Singh, N. V. Jadhav, S. Sharma, B. N. Pandey, S. K. Srivastava and R. S. Ningthoujam, J. Mater. Chem. C, 2015, 3, 1965 RSC.
  12. P. Li, N. Umezawa, H. Abe and J. Ye, J. Mater. Chem. A, 2015, 3, 10720–10723 CAS.
  13. W. Zhao, F. Liang, Z. M. Jin, X. B. Shi, P. H. Yin, X. R. Wang, C. Sun, Z. Q. Gao and L. S. Liao, J. Mater. Chem. A, 2014, 2, 13226 CAS.
  14. A. Y. Booshehri, S. C. Goh, J. Hong, R. R. Jiang and R. Xu, J. Mater. Chem. A, 2014, 2, 6209 CAS.
  15. X. Y. Fan, K. R. Lai, L. C. Wang, H. S. Qiu, J. Yin, P. J. Zhao, S. L. Pan, J. B. Xu and C. Y. Wang, J. Mater. Chem. A, 2015, 3, 12179–12187 CAS.
  16. P. M. Panchmatia, A. R. Armstrong, P. G. Bruce and M. S. Islam, Phys. Chem. Chem. Phys., 2014, 16, 21114 RSC.
  17. P. Y. Zavalij and M. S. Whittingham, Acta Crystallogr., 1999, 55, 627 Search PubMed.
  18. K. Mocała and J. Ziółkowski, J. Solid State Chem., 1987, 69, 299 CrossRef.
  19. G. D. Andreetti, G. Calestani and A. Montenero, Z. Kristallogr. - Cryst. Mater., 1984, 168, 53 CrossRef CAS.
  20. A. Tsuzuki, K. Kani, S. Kawakami, T. Sekiya and Y. Torii, J. Mater. Sci.Lett., 1989, 8, 1255 CrossRef CAS.
  21. R. L. Tang, Y. Li, N. N. Li, D. D. Han, H. Li, Y. S. Zhao, C. X. Gao, P. W. Zhu and X. J. Wang, Phys. Chem. C, 2014, 118, 10560 CrossRef CAS.
  22. A. A. Belik, A. V. Mironov, R. V. Shpanchenko and E. Takayama-Muromachi, Acta Crystallogr., 2007, 63, 37 Search PubMed.
  23. J. Bouloux, G. Perez and J. Galy, Bull. Soc. Fr. Mineral. Cristallogr., 1972, 95, 130 CAS.
  24. Y. Sun, C. S. Li, X. G. Ma, S. S. Li, L. N. Wang, Y. D. Wang, Y. Z. Wang and H. T. Cui, Nanosci. Nanotechnol. Lett., 2013, 5, 408 CrossRef CAS PubMed.
  25. D. Li, X. J. Bai, C. S. Pan and Y. F. Zhu, Eur. J. Inorg. Chem., 2013, 17, 3070 CrossRef PubMed.
  26. Y. A. González-Rivera, E. Cervantes-Juárez, L. Aquino-Meneses, R. Morales, S. Sandoval, E. Rubio-Rosas, R. Agustín-Serrano, C. Cerna, E. Reyes-Cervantes, O. Zelaya Angel, S. A. Tomas, F. Rodriguez-Melgarejo and M. Palomino-Ovando, J. Lumin., 2014, 155, 119 CrossRef PubMed.
  27. H. W. Liu and D. G. Tang, Mater. Chem. Phys., 2009, 114, 656 CrossRef CAS PubMed.
  28. F. K. Butt, F. Idrees, M. Tahir, C. Cao, R. Hussain, R. Ahmed and B. Ul Haq, Mater. Lett., 2015, 155, 15–17 CrossRef CAS PubMed.
  29. A. C. Larson and R. B. Von Dreele, Los Alamos National Laboratory Report LAUR, Los Alamos National Laboratory, Los Alamos, NM, 1994, pp. 86–748 Search PubMed.
  30. V. Vadivelan and K. V. Kumar, J. Colloid Interface Sci., 2005, 286, 90–100 CrossRef CAS PubMed.
  31. A. Kudo, I. Tsuji and H. Kato, Chem. Commun., 2002, 1958 RSC.
  32. T. Nakajima, M. Isobe, T. Tsuchiya, Y. Ueda and T. Kumagai, J. Lumin., 2009, 129, 1598 CrossRef CAS PubMed.
  33. T. Nakajima, M. Isobe, T. Tsuchiya, Y. Ueda and T. Manabe, J. Phys. Chem. C, 2010, 114, 5160 CAS.
  34. Y. Matsushima, T. Koide, M. Hiro-Oka, M. Shida, A. Sato, S. Sugiyama and M. Ito, J. Am. Ceram. Soc., 2015, 98, 1236 CrossRef CAS PubMed.
  35. A. Kudo and T. Kondo, J. Mater. Chem., 1997, 7, 777 RSC.
  36. W. T. Draai and G. Blasse, Phys. Status Solidi A, 1974, 21, 569 CrossRef CAS PubMed.
  37. J. Mendialdua, R. Casanova and Y. Barbaux, J. Electron Spectrosc. Relat. Phenom., 1995, 71, 249 CrossRef CAS.
  38. I. D. Brown and D. Altermatt, Acta Crystallogr., Sect. B: Struct. Sci., 1985, 41, 244 CrossRef.
  39. N. E. Brese and M. O’Keeffe, Acta Crystallogr., Sect. B: Struct. Sci., 1991, 47, 192 CrossRef.
  40. F. A. Cotton, G. Wilkinson, C. A. Murillo, M. Bochmann and R. Grimes, Advanced inorganic chemistry, John Wiley & Sons, New York, 1999 Search PubMed.
  41. Y. Y. Zhang, Y. P. Guo, H. Duan, H. Li, C. Y. Sun and H. Z. Liu, Phys. Chem. Chem. Phys., 2014, 16, 24519 RSC.
  42. M. Yamaga, T. Yosida, Y. Inoue, N. Kodama and B. Henderson, Radiat. Eff. Defects Solids, 1995, 136, 33 CrossRef PubMed.
  43. A. Brenier, C. Madej, C. Pedrini and G. Boulon, Chem. Phys. Lett., 1991, 177, 590 CrossRef CAS.
  44. Z. Y. Zhang, C. L. Shao, L. N. Zhang, X. H. Li and Y. C. Liu, J. Colloid Interface Sci., 2010, 351, 57 CrossRef CAS PubMed.
  45. W. Choi, A. Termin and M. R. Hoffmann, J. Phys. Chem., 1994, 98, 13669 CrossRef.
  46. Y. Hu, D. Li, F. Sun, H. Wang, Y. Weng, W. Xiong and Y. Shao, RSC Adv., 2015, 5, 54882–54889 RSC.
  47. G. V. Buxton, C. L. Greenstock, W. P. Helman and A. B. Ross, J. Phys. Chem., 1988, 17, 513–886 CAS.
  48. Y. G. Cui, J. Instrum. Anal., 1996, 15, 17 CAS.
  49. Qi-H. Wu, A. Thissen, W. Jaegermann and M. Liu, Appl. Surf. Sci., 2004, 236, 473–478 CrossRef CAS PubMed.
  50. M. D. Rossell, P. Agrawal, A. Borgschulte, C. Hébert, D. Passerone and R. Erni, Chem. Mater., 2015, 27, 3593–3600 CrossRef CAS.

This journal is © The Royal Society of Chemistry 2015