Jun Li,
Li Zhou,
Qingshan Zhu* and
Hongzhong Li
State Key Laboratory of Multiphase Complex System, Institute of Process Engineering, Chinese Academy of Sciences, Beijing 100190, P. R. China. E-mail: qszhu@ipe.ac.cn
First published on 23rd July 2015
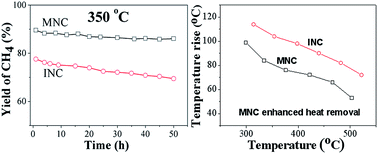
The synthesis and characterization of highly active and stable Ni nanoparticles supported on macro–mesoporous Al2O3 as a CO methanation catalyst for the production of synthetic natural gas are reported. The macro–mesoporous Ni–Al2O3 catalyst (MNC) is synthesized by combination of sol–gel and supercritical drying methods. The MNC showed much higher activity and higher thermal stability for methanation than the catalyst obtained via the conventional wet impregnation method, especially under harsh conditions of high temperatures and high GHSV (90000 h−1). The enhancement in activity of the synthesized MNC catalyst is attributed to the highly stable and smaller Ni nanoparticles that are embedded on the macro–mesoporous structure. The MNC also showed a higher rate constant and lower diffusion activation energy, which should be attributed to the macro–mesoporous structure that facilitated the diffusion of gas products and then enhanced the removal of reaction heat from the catalyst surface. Thus leading to a higher resistance to Ni sintering and carbon deposition.
Fluidized bed reactors have the advantages in preventing the carbon deposition and sintering of Ni catalysts due to almost isothermal conditions in the reactor, superior transfer and hydrodynamic characteristics. Fluidized bed reactors have been developed for production of SNG from coal or biomass, including the multiple-feed fluidized bed reactor,11 the Bi-Gas project,12 the Comflux process,13 and the PSI fluidized bed methanation process.14 The inevitably encountered axial gas and solids back-mixing and severe attrition in the fluidized bed reactor play a negative role in the overall reactor performance.8 From the perspective of the matching of catalyst and reactor, enhancing the diffusion of products gases and heat removal for based on catalyst structure designation would be feasible for improving the catalytic performance and thermal stability.
Nano-sized catalysts exhibiting unique morphological and physicochemical properties play a key role in heterogeneous catalysts.15 Over the past decades, various metal nanoparticles have been employed to CO methanation reaction, such as Ni, Ru, Rh, Co, Fe, and Mo methanation catalysts.16–21 Among the above active metal, catalysts based on Ni are frequently used for industrial applications, such as selective CO methanation to remove trance CO from H2-rich feed gases for fuel cells, due to its relatively active and low cost.22 However, when they are used for SNG production with large concentration of CO in the feed gases, the Ni catalysts tend to aggregate into large particles and prone to forming carbon deposition, which induce a rapid deactivation of the catalysts.23 Thus, addition of small amount of second metal,24,25 core–shell or hollow structure,26,27 or meso/nanoporous particles28,29 have to be introduced to improve the resistant to carbon deposition and to separate the metal nanoparticles from each other to prevent sintering. In addition, process intensification derived from the fluidized bed,30 magnetic fields31 and plasma assistant32 have been explored to inhibit the sintering of metal nanoparticles and carbon deposition of catalysts. Recently, several chemical approaches that rely on the formation of alloy33 or substrate effects34 have also been developed to stabilize metal nanoparticles.
Up to now, most of the aforementioned catalysts were developed for the fixed bed reactor and focus on the size and dispersion of metal species, metal–support interaction and the surface structures. However, the enhancement for the diffusion of products gases and heat removal based on the particle structure designation for methanation in the fluidized bed reactor are not reported in the literatures. In the present work, we aim to enhance the diffusion of products gases and heat removal for improving the catalytic performance and thermal stability based on catalyst structure designation as well as the perspective of the matching of catalyst and fluidized bed reactor. The macro–mesoporous Ni/Al2O3 catalyst is synthesized via a sol–gel method combined with a supercritical drying treatment for formation of highly dispersed Ni crystals embedded on macro–mesoporous Al2O3 nanoparticles. The prepared catalyst large surface area, highly dispersed Ni nanoparticles and a lot of macro–mesoporous structures. The catalytic performances of the macro–mesoporous catalyst for CO methanation were compared with a conventional Ni-based catalyst in a micro-fluidized bed reactor.
The impregnation Ni/Al2O3 catalyst (denoted as INC) was prepared by the conventional impregnation method. The catalyst support used was a commercial Al2O3 with particle sizes of 70–90 μm, bulk density of 660 kg m−3. Firstly, Ni(NO3)2·6H2O was dissolved in distilled water, followed by the addition of Al2O3 particles. The slurry was stirred at room temperature for 8 h, and then dried at 120 °C for 4 h. The solid sample was afterwards calcined at 400 °C in air for 4 h. The content of NiO in the catalyst prepared was 40 wt%. Detailed preparation method of the Ni catalyst was shown in the ref. 30.
Temperature programmed reduction of hydrogen (H2-TPR) was performed on a chemisorption apparatus (ChemBet 3000, Quantachrome, USA), which provide important information about the reduction difficult degree of Ni species and the interaction with the supports. The sample (15 mg) was loaded in a U-type quartz tube of 5 mm diameter. The sample was pretreated with Ar (99.99%) flow at 200 °C for 60 min, followed by cooling it to room temperature. Then the sample was heated to 900 °C at a constant heating rate of 10 °C min−1 using a flow of H2/Ar mixture (5% H2, vol%) under a flow rate of 100 mL min−1. The signal of hydrogen consumption was detected by a thermal conduction detector (TCD).
Hydrogen chemisorption was also performed on the chemisorption apparatus (ChemBet 3000, Quantachrome, USA). The sample was first pre-reduced with purified H2 at 600 °C for 2 h using a heating rate of 10 °C min−1. The sample was purged with helium at this temperature for 1 h and it was then cooled to room temperature for the chemisorption measurement.
The thermogravimetric and differential thermal analyzer, TG/DTA6300 model, was used to analyze the carbon deposition of the spent catalyst, operated in a temperature range from room temperature to 900 °C at a heating rate of 10 °C min−1.
The amounts of MNC and INC catalysts were fixed to be 0.2 g. To keep the same GHSV value, the INC catalyst was mixed with Al2O3 particles with settled bed height of 12 mm. The feed gas consisted of CO, H2, N2 with a molar ratio of 1:
3:
1, where N2 was added as the fluidized gas and also as an internal standard gas for GC analysis. In the experiment, the Ni catalyst was pre-reduced in pure H2 with flow rate of 100 mL min−1 at 600 °C for 4 h. Then, the feed gas was supplied up-flow through a porous quartz sintered distributor at the bottom of the reactor to allow fluidization of the catalyst particles. The outlet gas stream was cooled by using an ice trap. To determine the composition of outlet gas products, the gas products (H2, N2, CH4, CO2 and CO) were collected after half an hour of steady-state operation for each temperature and analyzed by GC (3000 Micro GC, Inficon). The calculation formulas for CO conversion, CH4 selectivity and yield were calculated as follows:
![]() | (1) |
![]() | (2) |
![]() | (3) |
The effect of GHSV on the catalytic reaction of the MNC and INC catalysts were carried out at 400 °C in the GHSV range of 7500–90000 h−1. The stability tests of the MNC and INC catalyst were carried out at 350 °C with GHSV of 30
000 h−1. A thermocouple was put into the central section of the catalyst bed to measure the reaction temperature with average error less than 5%. All the tests were duplicated to ensure accuracy, and the carbon balance across the reactor was within ±2%.
![]() | (4) |
The rate of the CH4 formation can be described by the following equation:38
![]() | (5) |
From eqn (5) we can obtain
ln![]() | (6) |
The yield of CH4 and CH4 formation rate are in direct ratio
rCH4 = mYCH4 | (7) |
The apparent activation energy (E) can be determined from the slope of the plot of lnrCH4 against 1/T.
![]() | ||
Fig. 1 H2-TPR profiles of MNC after calcination at 400 °C (a), 500 °C (b), 600 °C (c) and INC after calcination at 400 °C (d) for 4 h. |
The isothermal adsorption–desorption curves of the MNC and INC catalysts are shown in Fig. 2A. The MNC catalysts showed a clear hysteretic behavior in the N2 physisorption curves that attributed to the mesopores (range 2–50 nm). All of the MNC catalysts showed a broad desorption curves that consist of mesopores and macropores (Fig. 2B). The broad desorption curves that above 50 nm might be attributed to the aggregation of the smaller particles. These results could be confirmed in the SEM images of the MNC catalyst (Fig. 3a). Nevertheless, a relatively smaller desorption peak with average pore size of 12.1 nm was observed for the INC catalyst. Compared to the INC, the MNC exhibited much larger mesoporous than the INC, which would be highly desirable for high exothermic methanation reaction. High BET surface and enriched macropores are conducive to not only the dispersion of the nickel species but also the diffusion of the reactants and products, namely the mesopore frameworks can provide more accessible active sites for the reactants.43
![]() | ||
Fig. 2 The isothermal adsorption–desorption curves (A) and the pore distribution (B) of MNC after calcination at 400 °C (a), 500 °C (b), 600 °C (c) and INC after calcination at 400 °C (d) for 4 h. |
![]() | ||
Fig. 3 SEM, TEM images and particle size distributions for MNC (a and b) and INC (c and d) after calcination at 400 °C and further reduced at 600 °C for 4 h. |
Fig. 3a and b showed the well dispersed Ni nanoparticles embedded on mesoporous Al2O3 after calcined at 400 °C and further reduced at 600 °C. They had Al2O3 particle sizes of 23.3 nm and Ni crystalline sizes of 4.8 nm. As can be seen in Fig. 3c and d, the INC exhibited Al2O3 particle sizes of 60.0 nm and crystalline sizes of 10.8 nm. The obvious heterogeneous distribution of the Ni crystalline sizes was observed from Fig. 3d.
The physicochemical properties of the MNC and INC catalysts are summarized to Table 1. As comparison with INC, the MNC showed extremely low bulk density, higher dispersed Ni nanoparticles and higher specific surface areas than that of the INC. This should be attributed to the differences of preparation method. In the sol–gel process, Ni species could be uniformly dispersed and reached to atomic or molecular level interaction with support. The skeleton of the original sol–gel was almost kept intact in the aerogel, as in the supercritical drying process, the influence of surface tension and capillary force on the gel skeleton can be neglected.44 While in the case of the conventional preparation process, the dispersion of nickel species could block part of pores on support and resulted in the lower specific surface area. Thus, the MNC exhibited high specific surface areas, low bulk density, small Ni crystalline sizes, strong metal–support interaction and high Ni dispersion degrees, which make them an ideal material for heterogeneous catalysis.
![]() | ||
Fig. 4 Catalytic activity of MNC and INC in the temperature range of 200–500 °C with GHSV of 30![]() |
The increase in temperature during the methanation reaction is shown in Fig. 5. For INC catalyst, the temperature increased about 115 °C at the reaction temperature of 315 °C. When the reaction temperature was higher than 315 °C, the temperature rise decreased with increasing methanation reaction temperature. MNC shows a similar trend of temperature rise curve. However, MNC has a much lower temperature rise compared to INC. This indicated that MNC enhanced the heat transfer from the catalyst particle phase to the gas phase. The enhanced heat transfer property of MNC should be attributed to the macro–mesoporous structure that enhanced gas-products diffusion efficiency.
Comparison the catalytic activity and thermal stability of the MNC and INC catalysts at 350 °C are illustrated in Fig. 6. It shows that the conversion of CO, selectivity and yield of CH4 over the MNC catalyst were much higher than those over the INC catalyst. For INC catalyst, the CO conversion, selectivity and the yield of CH4 decreased from 99.0%, 78.7% and 77.6–96.2%, 72.2% and 69.5% respectively, indicating some deactivating of INC catalyst. However, for MNC catalyst, no obvious decrease in CO conversion, selectivity and the yield of CH4 are observed. This suggested that the MNC catalyst would have better catalytic activity and thermal stability.
![]() | ||
Fig. 6 Stability test of MNC and INC catalyst in a fluidized bed reactor at 350 °C. CO conversion (a) CH4 selectivity (b) and (c) CH4 yield. |
It is well known that the carbon deposition and sintering of the catalyst particles at high temperature deteriorate the activity of the catalyst during the CO methanation process.47,48 Fig. 7 shows the XRD patterns of the fresh reduced catalysts and the spent catalysts after methanation reaction test. The obvious diffraction peaks (2θ = 44.5°, 51.7° and 76.2°) ascribed to Ni phases were observed in both fresh and spent catalysts. The fresh MNC (Fig. 7a) exhibited much weaker and broader Ni XRD peaks than the fresh INC catalyst (Fig. 7c), which indicated the Ni particle sizes of the MNC are much smaller than that of the INC. The Ni peaks of both spent MNC catalyst (Fig. 7b) and spent INC catalyst (Fig. 7d) showed slightly increased compared to their fresh catalysts respectively, suggesting a little increase in Ni crystalline size of spent catalysts. The Ni crystalline sizes of the fresh and spent MNC and INC catalysts were calculated from the Ni (111) diffraction peak using the Scherrer equation. The shape factor (K) used in the Scherrer equation was 0.94. As can be seen in Table 2, compared to the fresh catalyst, the Ni crystalline sizes of the spent INC catalyst increased to 15.3 nm from 10.3 nm, indicating a fast sintering of the Ni crystalline particles. However, the Ni crystalline sizes of the spent MNC catalyst showed little changes, only from 4.6 nm to 5.1 nm compared the fresh catalyst. This was further corroborated with the STEM analysis. From the STEM images of Ni crystalline size of the fresh (Fig. 8a) and spent MNC catalyst (Fig. 8b), the Ni crystalline size shows no obvious change. In contrast, much sintering of Ni crystalline in the spent INC catalyst were observed (Fig. 8d), as compared to the fresh INC catalyst (Fig. 8c). This kind of sintering of Ni particles would undoubtedly bear the responsibility for the deactivation of the INC catalyst. Previous investigation revealed that the Ni particles growth rate is related to the particles size,49 supports50 and reaction temperatures.51 It was shown that the rate of Ni sintering is lower for MNC catalysts than INC catalyst, which would be attributed to macro–mesoporous structure that facilitated the reaction heat removal during the methanation process.
![]() | ||
Fig. 7 XRD patterns of the spent MNC (b) and INC (d) in comparison of the fresh MNC (a) and INC (c). |
![]() | ||
Fig. 8 High-angle annular dark-field (HAADF)-STEM images of the fresh and spent MNC (a and b), and fresh and spent INC (c and d) after 50 h reaction. |
The TG-DTA analysis of the spent MNC catalyst after 50 h stability test is shown in Fig. 9a. The mass loss below 252 °C is attributed to the moisture and the volatile species adsorbed on the catalyst. The mass gain from 252 °C to 291 °C is ascribed to the oxidation of the metallic nickel species.52 The mass loss from 291 °C to 671 °C that belongs to the oxidation of carbon species on MNC is 0.05 mg, which accounting for 1.5 wt% of the total catalyst. The exothermic peak at 400 °C in the DTA curve is designated as the active carbon, which is responsible for the formation of SNG.53 However, for the spent INC catalyst (Fig. 9b), the exothermic peak at higher temperature of 680 °C in DTA curve is attributed to the inactive carbon which is responsible for the deactivation of the catalyst.53 Correspondingly, the mass loss from 437 °C to 900 °C that ascribed to the inactive carbon is 0.461 mg, accounting for 3.9% of the total INC catalyst. Comparing the mass loss of carbon, the amount of carbon deposition on MNC was less than those on INC catalyst. Moreover, most of the carbon depositions on MNC are active carbon, while those on INC are mostly inactive carbon. This is reason why the MNC catalyst could maintain a high catalytic performance during the time on stream. This higher performance in preventing carbon deposition is probably attributed to the relatively smaller Ni crystalline size of MNC catalyst than that of the INC catalyst. On the other hand, the attrition of INC catalyst in the fluidized bed reactor may also be the reason for the decreased activity of INC catalyst.
Fig. 10 showed the conversion of CO versus to reaction time, which were used for the fitting curves. The pseudo curves agrees well with the experimental data suggested that the parabolic law model gave a good agree to the kinetics data. The pseudo rate constant of MNC are nearly three times higher than the INC catalyst.
In order to better understand the effect of mesoporous structure on the catalytic activity of catalysts, the rate-determining step of CO methanation, kinetics and catalytic activity energy were also investigated. The curves of lnrCH4 versus to 1/T are shown in Fig. 11. The CH4 formation rates (rCH4) are calculated from the yield of CH4 in the temperatures range of 250–350 °C. It can be seen that the apparent activation energy of MNC and INC are 2.4 kJ mol−1 and 7.1 kJ mol−1. The low apparent activity energy suggested a mass transfer controlling of CO methanation. Sehested et al. also found the diffusion restrictions are most important at high activities and low CO concentrations due to the high conversions of CO in this cases.55 This result indicated that the diffusion activation energy of MNC is less than that of INC. This would be attributed to the enhanced gas diffusion of the large mesoporous of MNC catalyst to the CO methanation. The enhanced diffusion improves the reactivity of CO methanation and leads to a higher rate constant. It is expected that the enhanced gas diffusion of the large mesoporous structures are favor for the heat removal from the surface of catalyst. Thus, lead to a higher resistance to Ni sintering and less carbon deposition. Generally speaking, there will be more errors about the K and Ea obtained by a micro-fluidized reactor than that by micro-fixed reactor. And the value of CH4 formation rates obtained from high yield of CH4 also brings errors to the reaction activation energy. However, the fitting curves of Fig. 10 based on the Ea and K was coincident highly with the experimental data. The apparent reaction activation energy showed here was to illuminate the reactivity of CO methanation in the fluidized bed reactor.
This journal is © The Royal Society of Chemistry 2015 |